

Analysis

April 21, 2015
US Vehicle Sales and NAFTA Vehicle Production Analysis for March 2015
Written by Peter Wright
March vehicle sales brought welcome new by bouncing back vigorously to 17.15 million units on a seasonally adjusted annualized basis, up from 16.23 million units in February. The March 2015 sales pace was 4 percent higher than the March 2014 pace. Cars had the greatest growth from 7.2 million units in February to 7.7 in March. Light trucks grew from 9.0 in February to 9.4 in March. Sales of domestic product grew from 12.9 to 13.4, imports from 3.4 to 3.7.
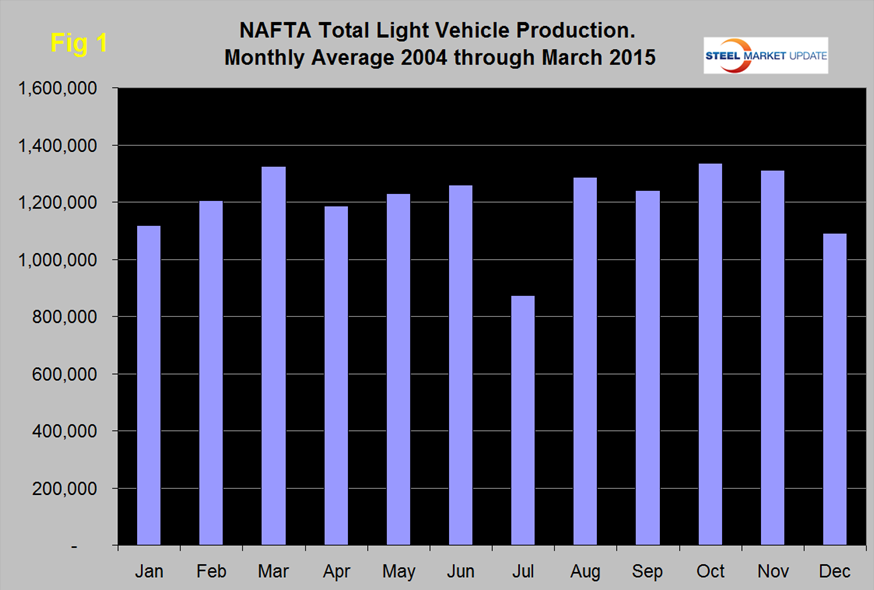
Total light vehicle (LV) production in NAFTA in March was at an annual rate of 18,859,176 units, up by 2.7 million from February or 17.0 percent. On average since 2004, March’s production has been 10.0 percent higher than February so this was a very good result (Figure 1). Note: these production numbers are not seasonally adjusted, the sales data reported above are seasonally adjusted. History predicts that production will decrease in April by 10.4 percent.
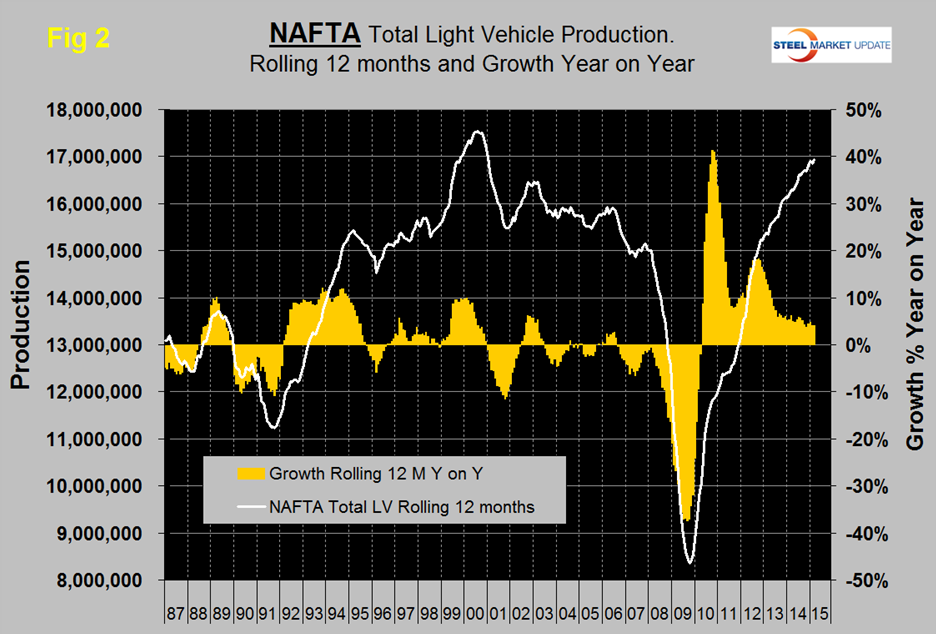
On a rolling 12 months basis y/y LV production in NAFTA increased by 4.0 percent through March. LV production in NAFTA is now well above the pre-recession peak of Q2 2006 and is heading for the all-time high of mid-2000 (Figure 2).
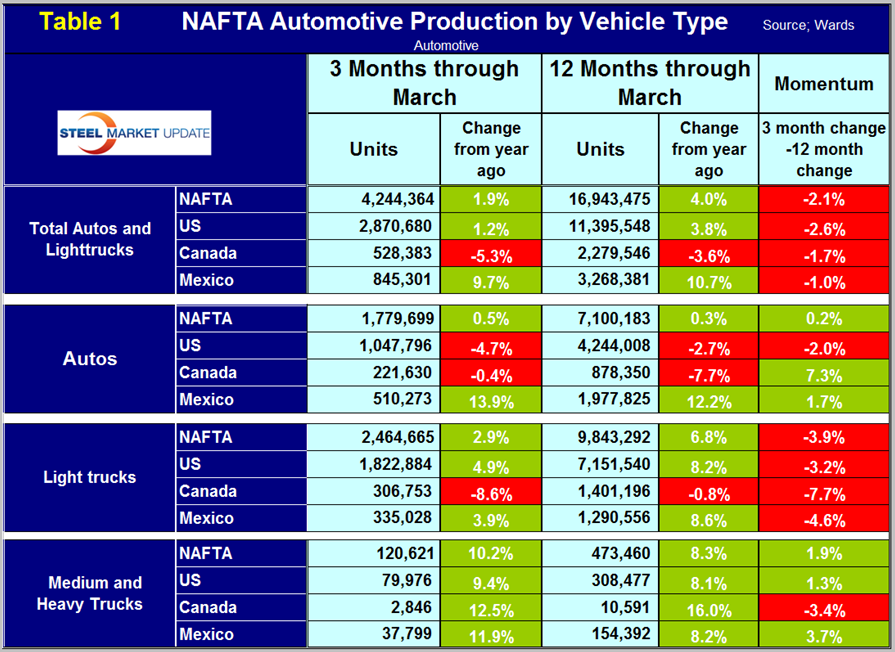
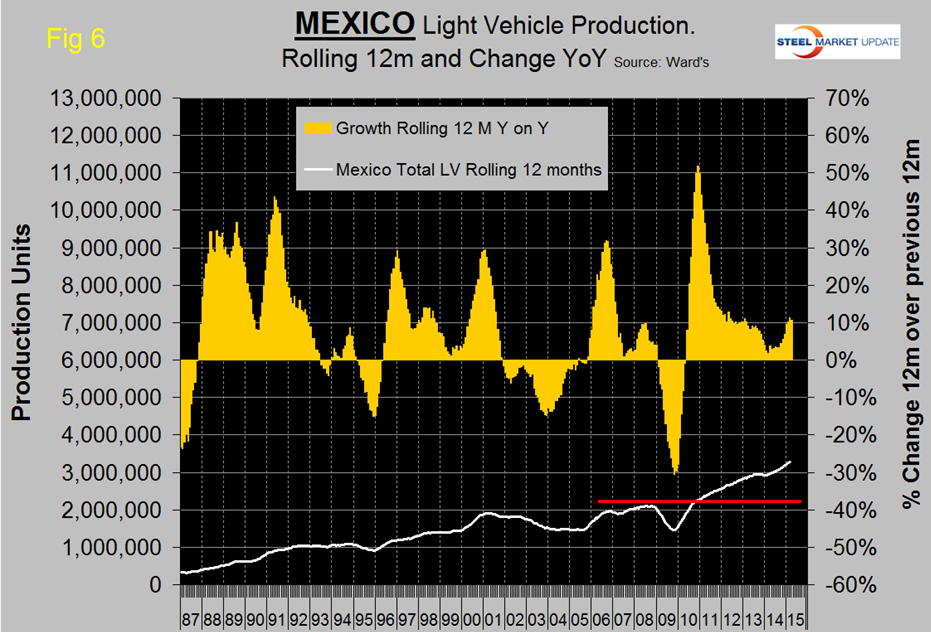
On a rolling 12 months basis y/y the US is up by 3.8 percent, Canada is down by 3.6 percent and Mexico is up by 10.7 percent (Table 1).
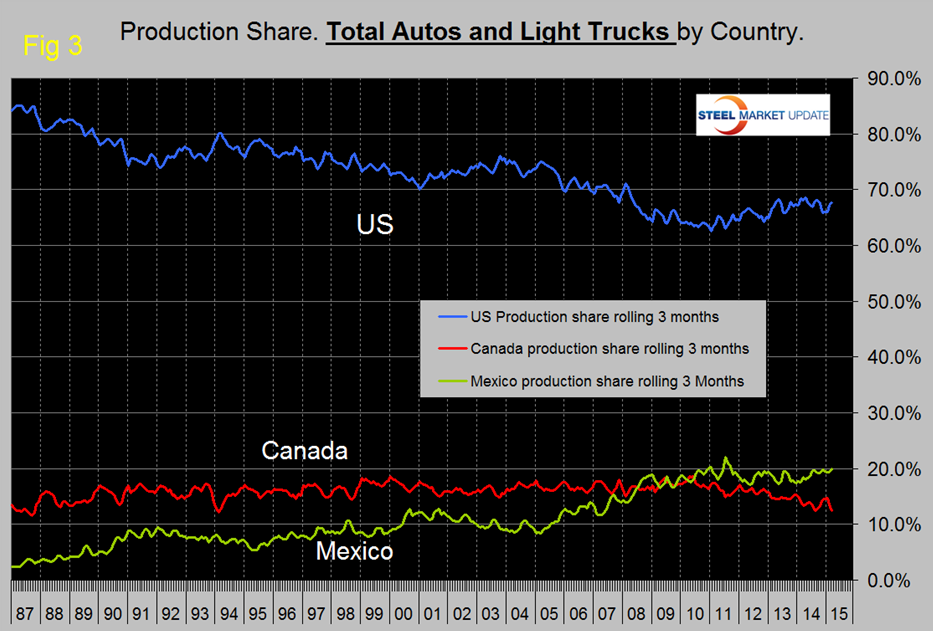
The US has gained production share in the most recent 3.5 years (Figure 3), but that gain has flattened since mid-2013.
On March 30th the Detroit News reported, “In recent years, Mexico is attracting more investment by foreign automakers than the United States. Toyota Motor Corp. has announced plans for a new $1 Billion plant in central Mexico to produce 200,000 Corollas a year and about a dozen major automakers have expanded in Mexico or announced plans to open new plants. With lower wages and free trade agreements, Mexico is becoming increasingly attractive for auto expansions — and nearly 80 percent of all vehicles built in Mexico are exported. Mexican auto production rose by more than 25 percent in 2014. This month, Volkswagen AG said it will make a $1 billion investment to expand a plant in Mexico to build its next generation Tiguan SUV. In December, General Motors Co. said it will invest $5 billion in Mexico over six years and will add 5,600 new jobs. GM said the investments will “help establish GM as Mexico’s No. 1 vehicle exporter.”
Figure 4, Figure 5 and Figure 6 show total LV production by country with y/y growth rates and on each the red line shows the change in production since Q2 2006. Note the scales are the same to give true comparability and that Mexican growth is surging at twice the rate in the US and Canada continues to contract.
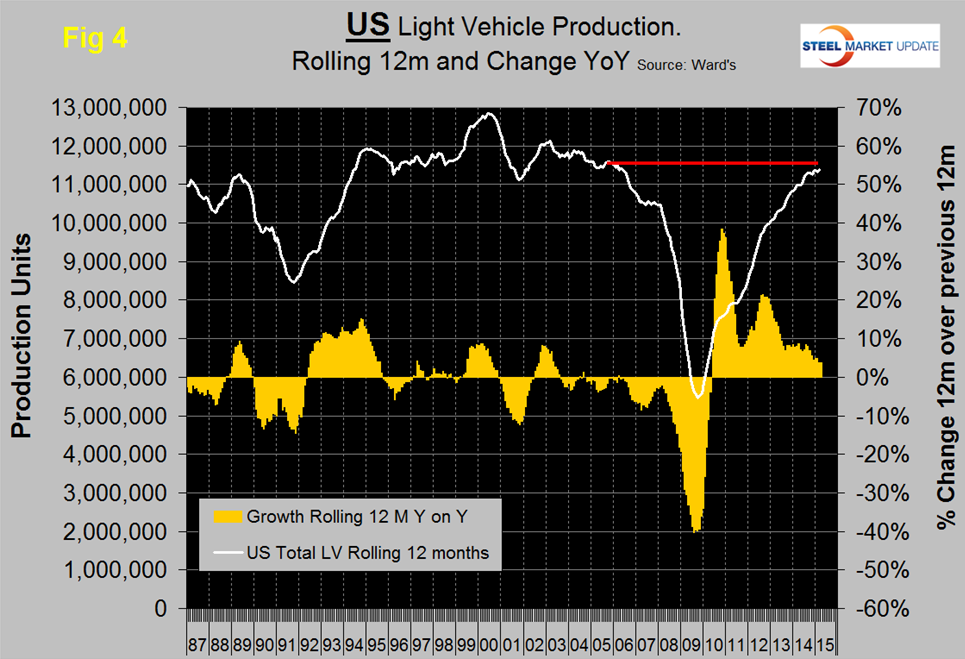
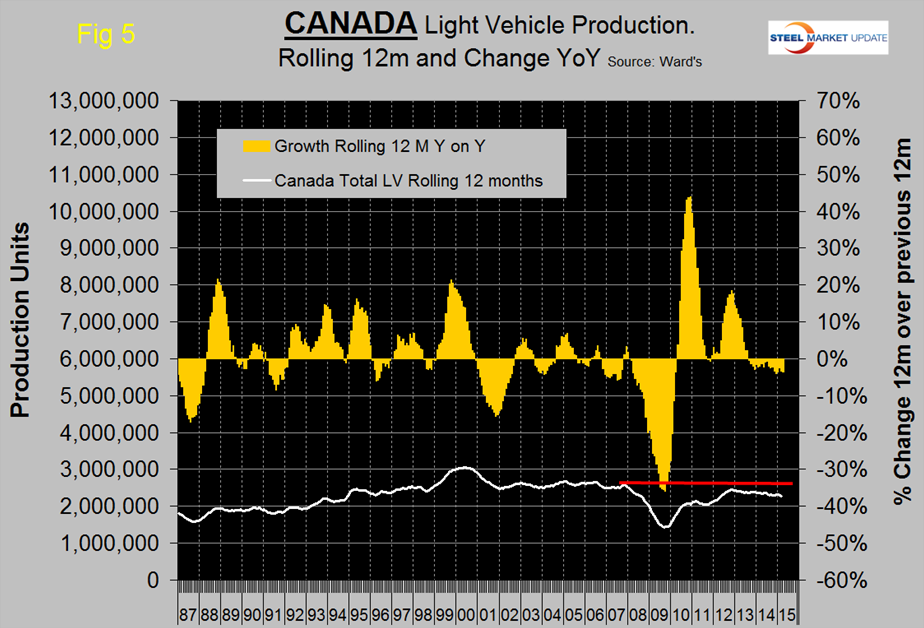
The decline of both the Canadian dollar and the Mexican Peso must be causing auto assemblers to look at moving production to Mexico, in particular. We believe there is spare capacity both sides of both borders for the automotive manufacturers to play this game. This isn’t happening so much in Canada in spite of the depreciation of the Loonie because, (in our opinion) the labor relations situation in Canada is causing manufacturers in general to reduce their exposure. US steel is a case in point.
Some good news for the US from Automotive news on March 30th. Volvo will spend about $500 million to build its first assembly plant in the United States as part of an ambitious plan to jump-start lagging sales. Production will start in 2018 with targeted annual capacity of 100,000 to 120,000 vehicles that will use underpinnings of the company’s new XC90 SUV, Lars Wrebo, head of manufacturing and purchasing, said in a phone interview. The Sweden-based automaker is in talks with three U.S. states on a possible location.
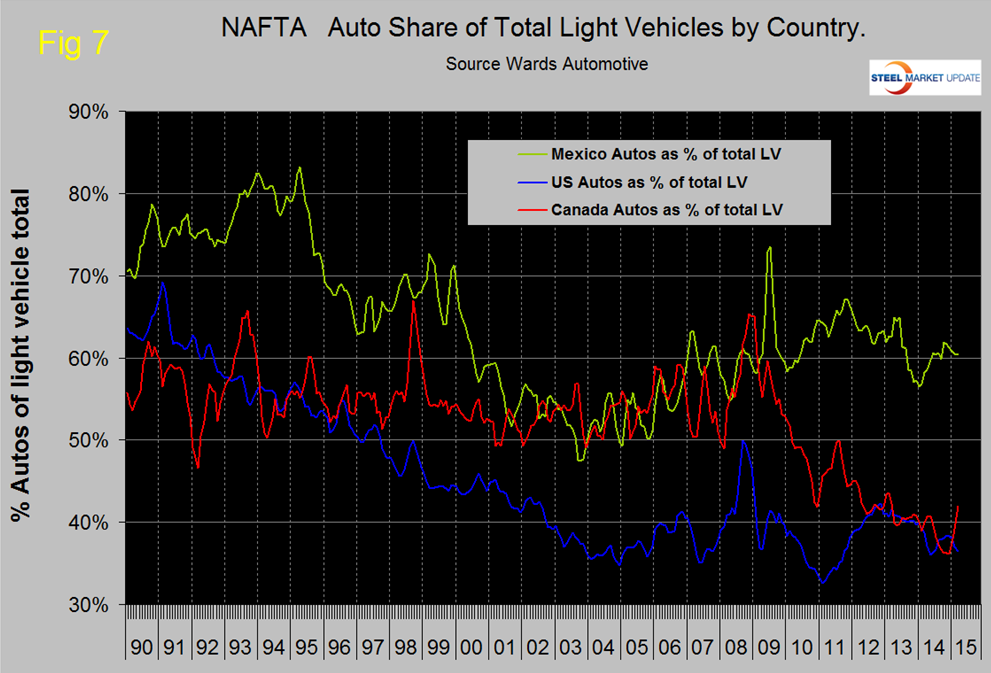
The mix of light vehicles is very different by country (Figure 7). The percentage of autos in the Mexican mix in the last three months was 60.4 percent but only 36.5 in the US and 41.9 percent in Canada.
Ward’s Automotive reported on Monday that total light vehicle inventories in the US decreased by 11 days of sales from the end of February to the end of March to 58 days, 4 days lower than March last year. Month over month FCA (Fiat Chrysler Automotive) was down by 11 days to 74, Ford down by 15 days to 65 and GM no change at 76 days.
The SMU data file contains more detail than be shown here in this condensed report. Readers can obtain copies of additional time based performance results on request if they wish to dig deeper. Available are graphs of auto, light truck and medium and heavy truck production, growth rate and production share by country.


