Analysis

May 4, 2015
Construction Expenditures (CPIP) Through March 2015
Written by Peter Wright
Each month the Commerce Department issues its Construction Put in Place (CPIP) data, usually on the first working day covering activity two months earlier. March data was released on May 1st.
![]() Construction Put in Place is based on spending work as it occurs, estimated for a given month from a sample of projects. In effect the value of a project is spread out from the project’s start to its completion. Construction starts data published by the Commerce Department for residential construction and by McGraw Hill/Dodge and Reed Construction for non-residential is completely different as in these cases the whole project is entered to the data base when ground is broken. The official CPIP press report gives no appreciation of trends on a historical basis and merely compares the current month with the previous one on a seasonally adjusted basis. The detail is hidden in the published data tables which we at SMU dissect to provide a long term perspective. Our intent is to provide a rout map for those subscribers who are dependent on this industry to ‘Follow the money’. This is a very broad and complex subject therefore to make this monthly write up more comprehensible we are keeping the information format as consistent as possible.
Construction Put in Place is based on spending work as it occurs, estimated for a given month from a sample of projects. In effect the value of a project is spread out from the project’s start to its completion. Construction starts data published by the Commerce Department for residential construction and by McGraw Hill/Dodge and Reed Construction for non-residential is completely different as in these cases the whole project is entered to the data base when ground is broken. The official CPIP press report gives no appreciation of trends on a historical basis and merely compares the current month with the previous one on a seasonally adjusted basis. The detail is hidden in the published data tables which we at SMU dissect to provide a long term perspective. Our intent is to provide a rout map for those subscribers who are dependent on this industry to ‘Follow the money’. This is a very broad and complex subject therefore to make this monthly write up more comprehensible we are keeping the information format as consistent as possible.
Total Construction: Data is reported on both a seasonally adjusted and non-adjusted basis. In the SMU analysis we consider only the non-seasonally adjusted data and remove seasonality by the consideration of year over year (y/y) data. We also focus on rolling 3 and 12 months to remove the noise in single month numbers. Please note that the official news release from the Commerce Department may at first glance seem to conflict with the SMU analyses. This is because the government commentary is based on seasonally adjusted numbers.
March expenditures were $65.471 billion which breaks down to $47.404 B of private work, $16.236 B of state and locally (S&L) funded work and $1.831 B of federally funded (Table 1).
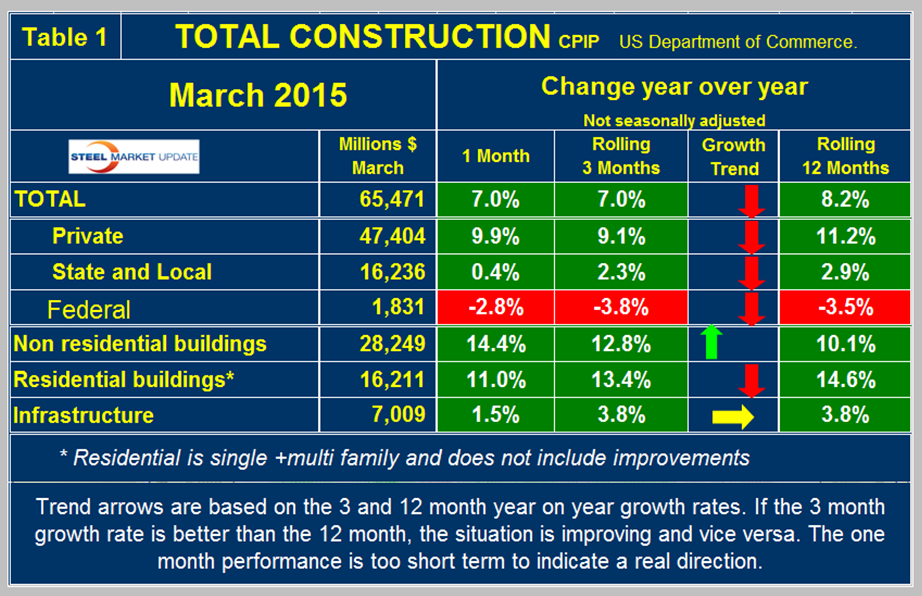
On a rolling three month basis y/y total construction was up by 7.0 percent led by private work up by 9.1 percent. On a rolling 12 month basis y/y total construction was up by 8.2 percent, this measure has been consistently in the range 8.2 percent to 8.9 percent for the last ten months, however total construction growth is decelerating since the short term growth (3 months 7.0 percent) is less than the long term, (12 months 8.2 percent). We report this as negative momentum. Note this is not a seasonal effect because our y/y analysis removes seasonality. All three funding categories, private, S&L and federal had negative momentum in March. We consider three sectors within total construction. These are non-residential, residential and infrastructure. On a rolling three month basis y/y non-residential is growing at 12.8 percent and accelerating. Residential is growing at 13.4 percent and has been slowing for 23 straight months on a 3MMA y/y basis. In that time frame single family is down from a 29.1 percent growth rate to 11.0 percent and multifamily is down from 54.6 percent to 33.2 percent. Infrastructure grew 3.8 percent y/y on both a rolling 3 and 12 month bases, therefore momentum was zero. The growth rate of total construction on a rolling 12 month basis improved from November 2013 through December 2014 but has slowed in the first two months of 2015 as shown by the brown bars in Figure 1.
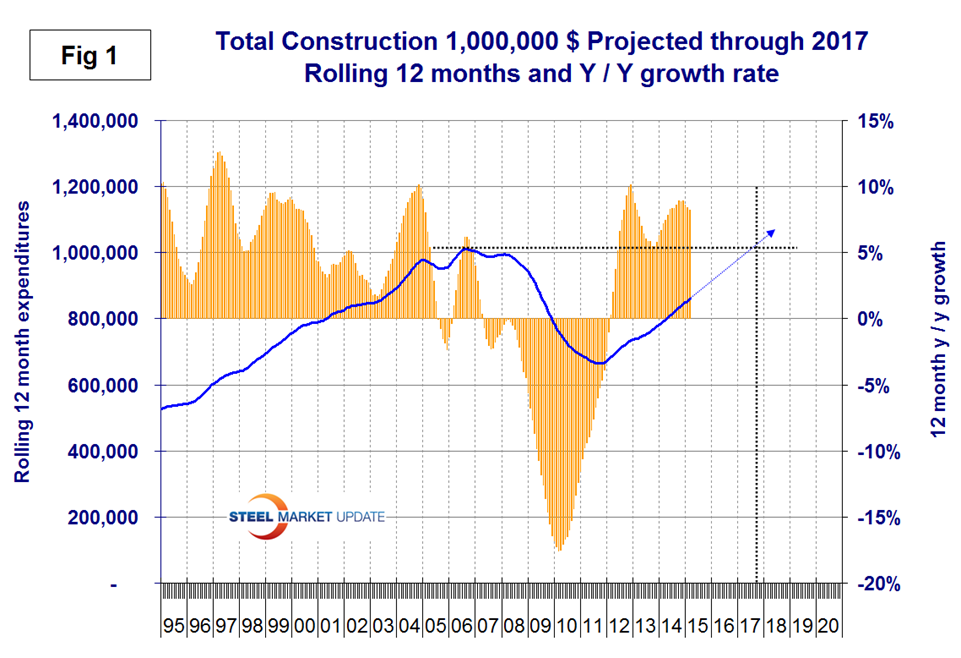
The trajectory of total annual expenditures as shown by the blue line is still on track for a complete recovery in late 2017. The pre-recession peak of total construction on a rolling 12 month basis was $1,145 B in 12 months through February 2007. The low point was $665.1 B in 12 months through October 2011. The 12 month total through the latest data of March 2015 was $859.008 B.
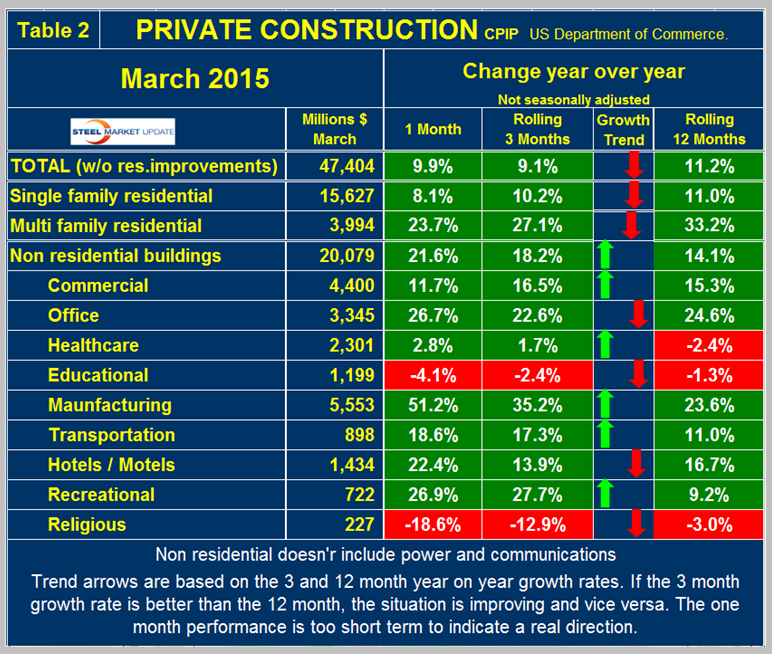
Private Construction: Table 2 shows the breakdown of total private expenditures into residential and non-residential and sub-sectors of both.
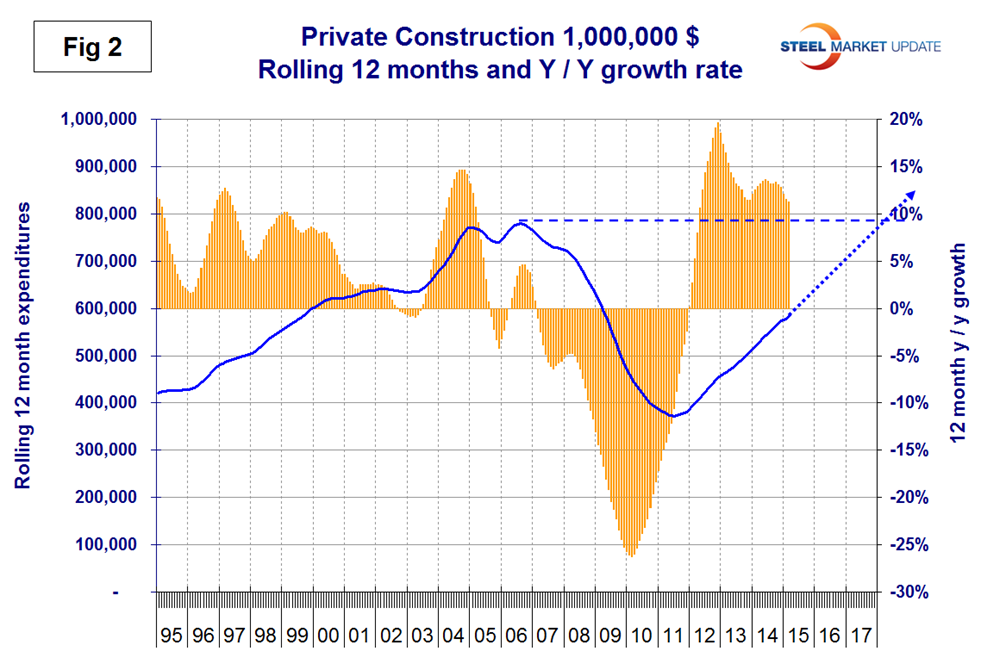
On a rolling 12 month basis the growth rate of private construction has been slowing since June last year when it was 13.6 percent. The rate in 12 months through March was 11.2 percent as shown by the brown bars in Figure 2.
All four graphs in this report are on a rolling 12 month basis which smooths out seasonal variation. Excluding improvements our report shows that for residential buildings, both single and multi-family still have strong y/y growth but both have negative momentum. The single family expenditures reported here have a rate of growth higher than that of single family starts reported by the Census Bureau which have starts growing at 5.6 percent. Starts being lower than current expenditures suggests a future slowdown. The discrepancy between this CPIP report and starts data for multi-family is huge. In this CPIP report multi-family is growing at 27.1 percent as the multifamily housing starts data shows a collapse to 3.1 percent. Note: the housing data published around the 12th of each month reports starts in which the total project cost is entered in the single month of groundbreaking. This suggests that the CPIP data for multifamily will decline strongly in 2015. Private non-residential buildings grew at a 18.2 percent rate in three months through March y/y with a positive momentum. Within private non-residential, only education and religious buildings had negative y/y growth on a rolling three months basis. Most educational buildings are financed by state and local government and total private and S&L educational buildings also declined for the first time in seven months. Private commercial buildings, offices, manufacturing, hotels/motels, transportation and recreational continued to have strong year over year growth in three months through March. In over 10 years since mid-2004, religious buildings have achieved positive growth in only six individual months and in that time period expenditures have declined from $8.6 B on a rolling 12 months basis to $3.45 B through March 2015.
State and Local Construction: S&L work expanded by 2.3 percent in the rolling three months through March y/y (Table 3).
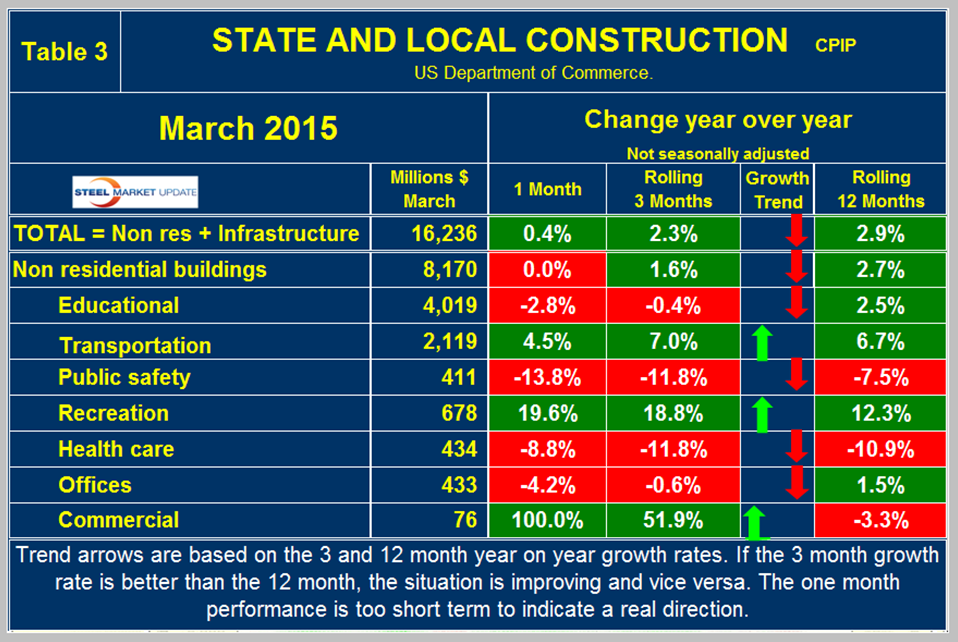
This was the eleventh consecutive month of positive y/y growth on a rolling three months basis, the first time that has happened in four years however momentum is negative as indicated by the three month growth rate being lower than the twelve month. Figure 3 shows eight consecutive months of positive growth after 54 months of contraction on a rolling 12 month basis.
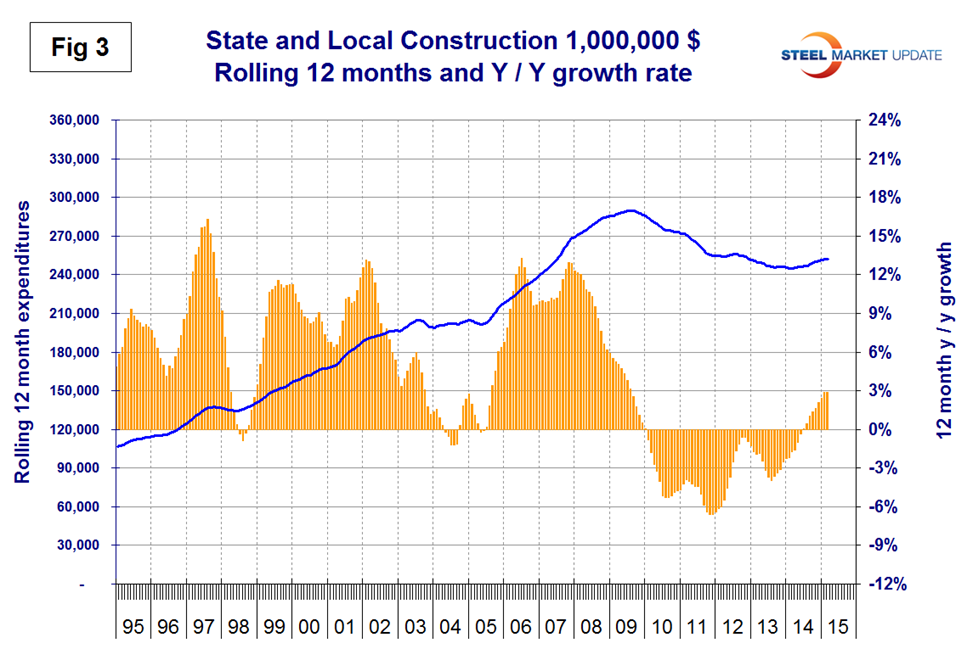
S&L non-residential building grew by 1.6 percent in three months through March y/y with negative momentum. It looks as though state and local governments are beginning to loosen the purse strings as far as construction is concerned. Educational buildings are about 70 percent funded by state and local governments and are by far the largest sub sector of S&L non-residential at $4.0 billion in March. State and locally funded educational building construction contracted by 0.4 percent in three months through March. Recreational buildings have accelerated markedly in the last six months and grew by 18.8 percent in the latest data. Transportation terminals have slowed to a 7.0 percent growth rate. Public safety buildings which includes jails, police and fire stations have had negative growth for 28 straight months on a rolling 3 months basis y/y. Comparing Figures two and three it can be seen that S&L construction did not have a proportional decline as severe as private work during the recession and that private work is bouncing back faster. Many state and local governments are still far from healthy, as increased revenues have been more than offset by increased future obligations, including the need to replenish reserve and rainy-day funds and to service defined benefit liabilities, pensions and Medicaid foremost. In spite of these limitations S&L construction has begun a long period of recovery that will take to the end of the decade to reach pre-recession levels.
Drilling down into the private and S&L sectors as presented in Tables 2 and 3 shows which project types should be targeted for steel sales and which should be avoided. There are some project types within S&L that are doing quite well but there are also major regional differences to be considered.
Infrastructure: Expenditures have had positive growth in each of the last 19 months through March on a rolling 3 months basis with a + 3.8 percent result in the latest data. The growth in 3 months is the same as that in 12 months indicating that there is no growth momentum. Highway and streets including pavement and bridges accounts for about 2/3 of total infrastructure expenditures and had positive growth for 15 months through February but in March experienced a 3.0 percent contraction (Table 4).
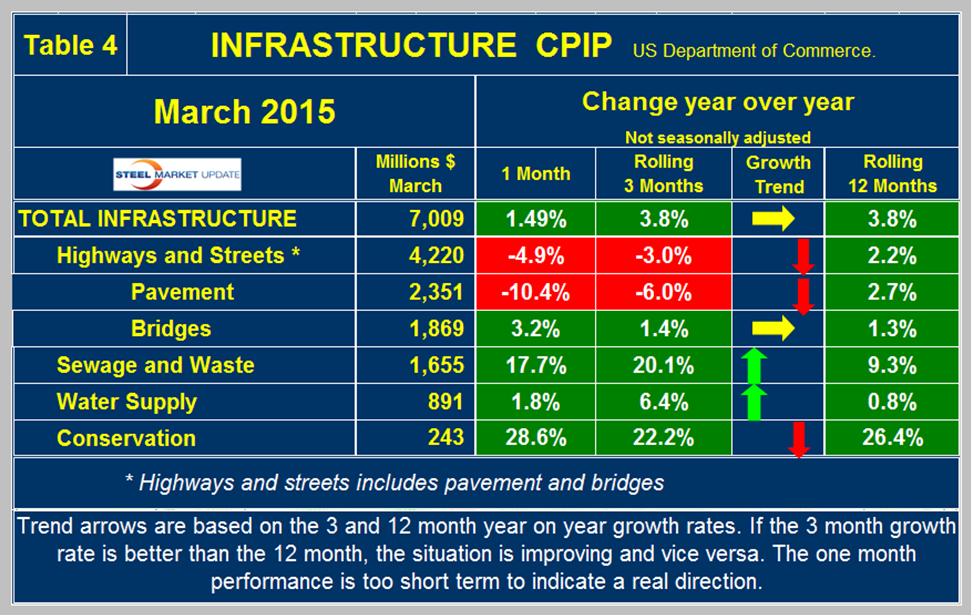
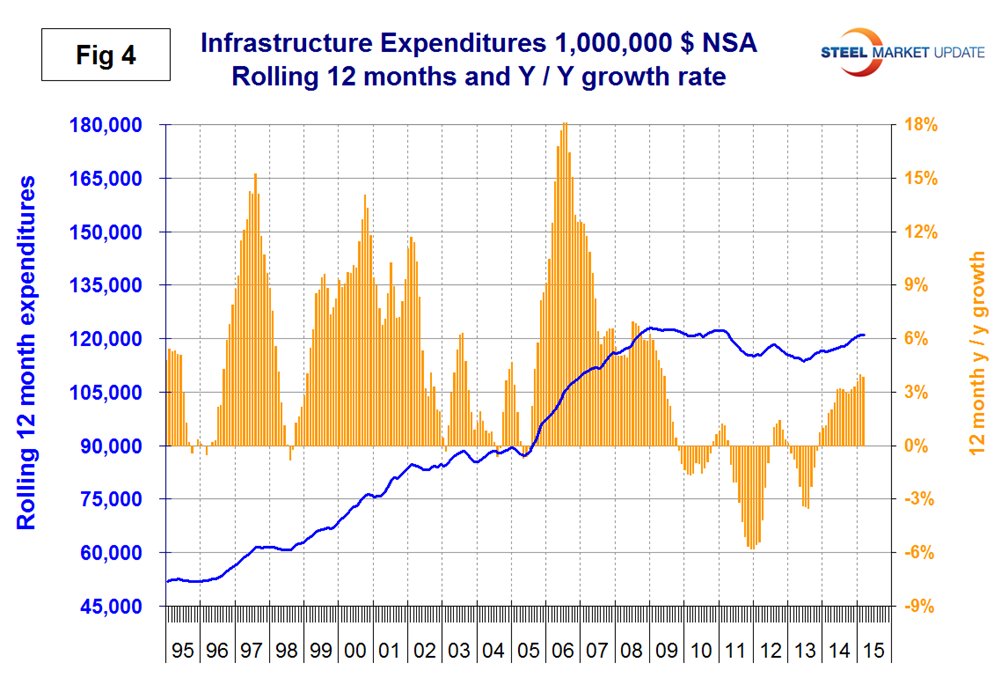
Highway pavement is the main sub-component of highways and streets and had a 6.0 percent negative growth in three months through March y/y. This was only the 3rd negative month since September 2013.On a rolling 12 month basis, pavement has had positive growth for 11 straight months. Bridge work has also expanded for the last 11 months y/y and totaled 4.9 B in three months through March. In 2014, total expenditures on bridges was $29.5 B which was over three times the expenditures in 2000. This doesn’t seem to support the much publicized view of the proportion of unsafe bridges in the country. Water supply was up by 6.4 percent in three months through March and reports out of California suggest that construction in this sector will continue to accelerate. Water supply contracted for nine months from December 2013 through August 2014 and has steadily improved since then. Conservation expenditures have been surging since November 2013 but the outlays are relatively small. On a rolling 12 month basis, infrastructure expenditures are about where they were four years ago, and have expanded for 16 straight months (Figure 4).
‘The Hill’ blog reported as follows this week:
“The House Appropriations Committee on Tuesday released a $55.3 billion bill funding the Transportation and Housing and Urban Development departments, as well as related agencies, for fiscal 2016. The bill provides $1.5 billion more than the current 2015 level, but $9.7 billion less than President Obama’s request.
For fiscal 2016, which begins Oct. 1, the bill would provide $17.2 billion to the Transportation Department, which is $1 billion below the 2015 level and $6.8 billion below Obama’s request.
It provides nearly $40.3 billion from the Highway Trust Fund, whose authorization expires at the end of May.
The Federal Aviation Administration would receive $15.9 billion, which is $159 million above 2015 and $40 million above Obama’s request. This provides funding to air traffic personnel. The Federal Railroad Administration would receive $1.4 billion, which is $262 million below 2015 level. Of the total, $289 million would fund Amtrak.
The bill would provide $10.7 billion to the Federal Transit Administration, which is $161 million less than 2015.
Housing and Urban Development would receive $42 billion, which is $1 billion above the 2015 level and $3 billion less than Obama’s request.
A House Appropriations subcommittee with jurisdiction over transportation will mark the bill up Wednesday.
This marks the fourth 2016 spending bill released so far. House GOP leaders had planned on voting on two this week, but the delayed release of a budget deal could shift the schedule.”