

Prices

February 4, 2016
Flat, Long, and Semi-Finished Steel Imports Analysis
Written by Peter Wright
The following article is normally produced for our Premium level members. However, we wanted to share this report so those who are Executive level members can evaluate the product and if you find it of interest you can contact our office to see about upgrading (or trialing) to our Premium level service. If you have any questions please contact our office: 800-432-3475 or info@SteelMarketUpdate.com.
Licensed data for January was reported by the Steel Import Monitoring System of the US Commerce Department on February 2nd. At SMU we perform a detailed analysis of this data, an explanation of our methodology is given at the end of this write up.
![]() Total rolled product licensed imports in the single month of January were 2,004,000 short tons up by 3.8 percent from the preliminary December volume. We prefer not to dwell on single months results because of the extreme variability that can occur in individual products. There was an example of this in the press on Thursday when the AMM published a piece on a January surge in rebar imports. This was true if you only look at one month but they neglected to point out that December’s volume was the lowest since June and that on a 3MMA basis rebar imports in January were down by 7.8 percent. In the comments below we use only three month moving averages (3MMA) to get a more representative picture. The 3MMA through January was 1,937,000 tons, down by 3.1 percent from the 3MMA through December. On the same basis flat rolled was down by 6.7 percent, long products down by 2.4 percent and pipe and tube up by 3.8 percent.
Total rolled product licensed imports in the single month of January were 2,004,000 short tons up by 3.8 percent from the preliminary December volume. We prefer not to dwell on single months results because of the extreme variability that can occur in individual products. There was an example of this in the press on Thursday when the AMM published a piece on a January surge in rebar imports. This was true if you only look at one month but they neglected to point out that December’s volume was the lowest since June and that on a 3MMA basis rebar imports in January were down by 7.8 percent. In the comments below we use only three month moving averages (3MMA) to get a more representative picture. The 3MMA through January was 1,937,000 tons, down by 3.1 percent from the 3MMA through December. On the same basis flat rolled was down by 6.7 percent, long products down by 2.4 percent and pipe and tube up by 3.8 percent.
Figure 1 shows the 3MMA through January licenses for semi-finished, flat and long products.
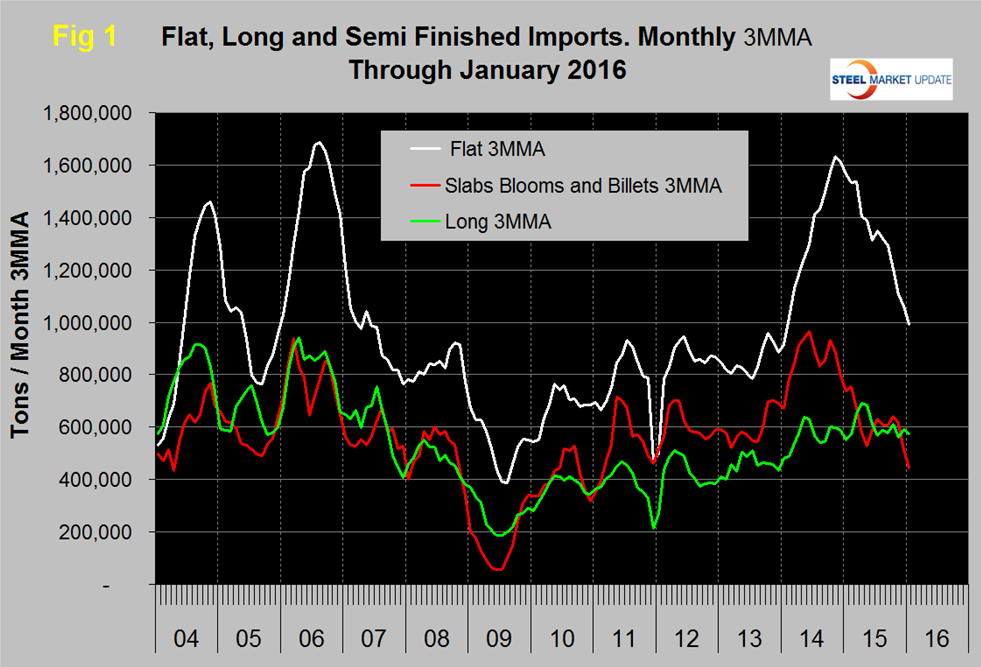
Flat includes all hot and cold rolled sheet and strip plus all coated sheet products including tin-plate plus both discrete and coiled plate. The 3MMA of flat rolled imports peaked at 1,634,000 tons in November 2014 and declined to 992,000 tons in January 2016. This was the lowest month since January 2014, two years ago. In November 2014 the 3MMA of semi-finished imports was 884,641 tons, this volume declined to 443,000 tons in January 2016. Long product imports have been stuck in the range 519,000 tons to 772,000 tons since March 2014 with no particular trend evident. In January the 3MMA of long product imports was 576,000 tons.
Figure 2 shows the trend of sheet and strip products since January 2011.
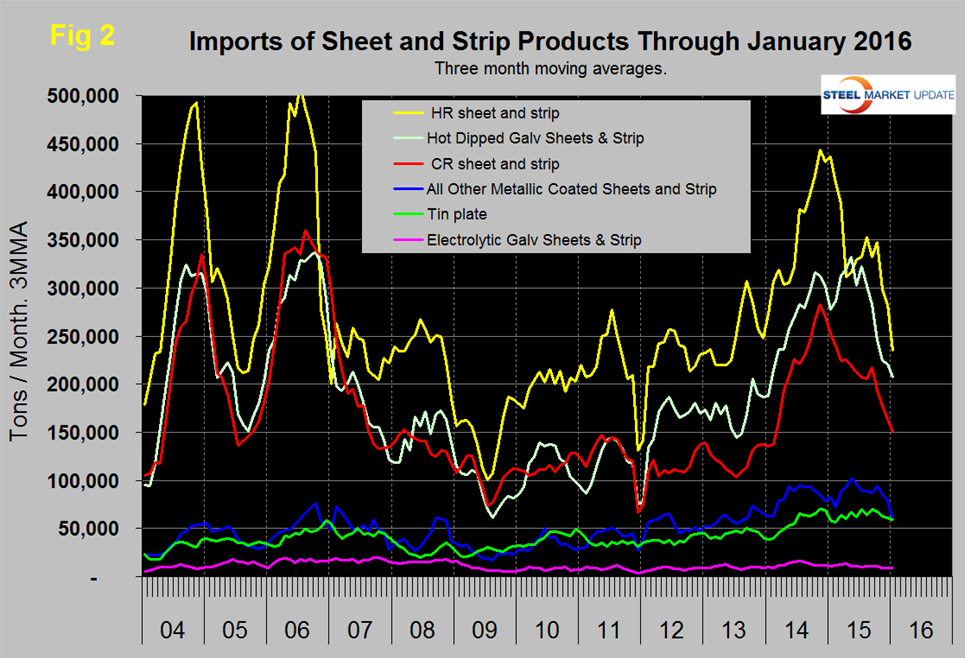
Of the big three tonnage items, HR, CR and HDG, all three are down sharply since Q3 last year. All other metallic coated (mainly galvalume) and tin plate were also down in the last three months. Electro-galvanized has been little changed in three years.
Table 1 provides an analysis of major product groups and of sheet products in detail.
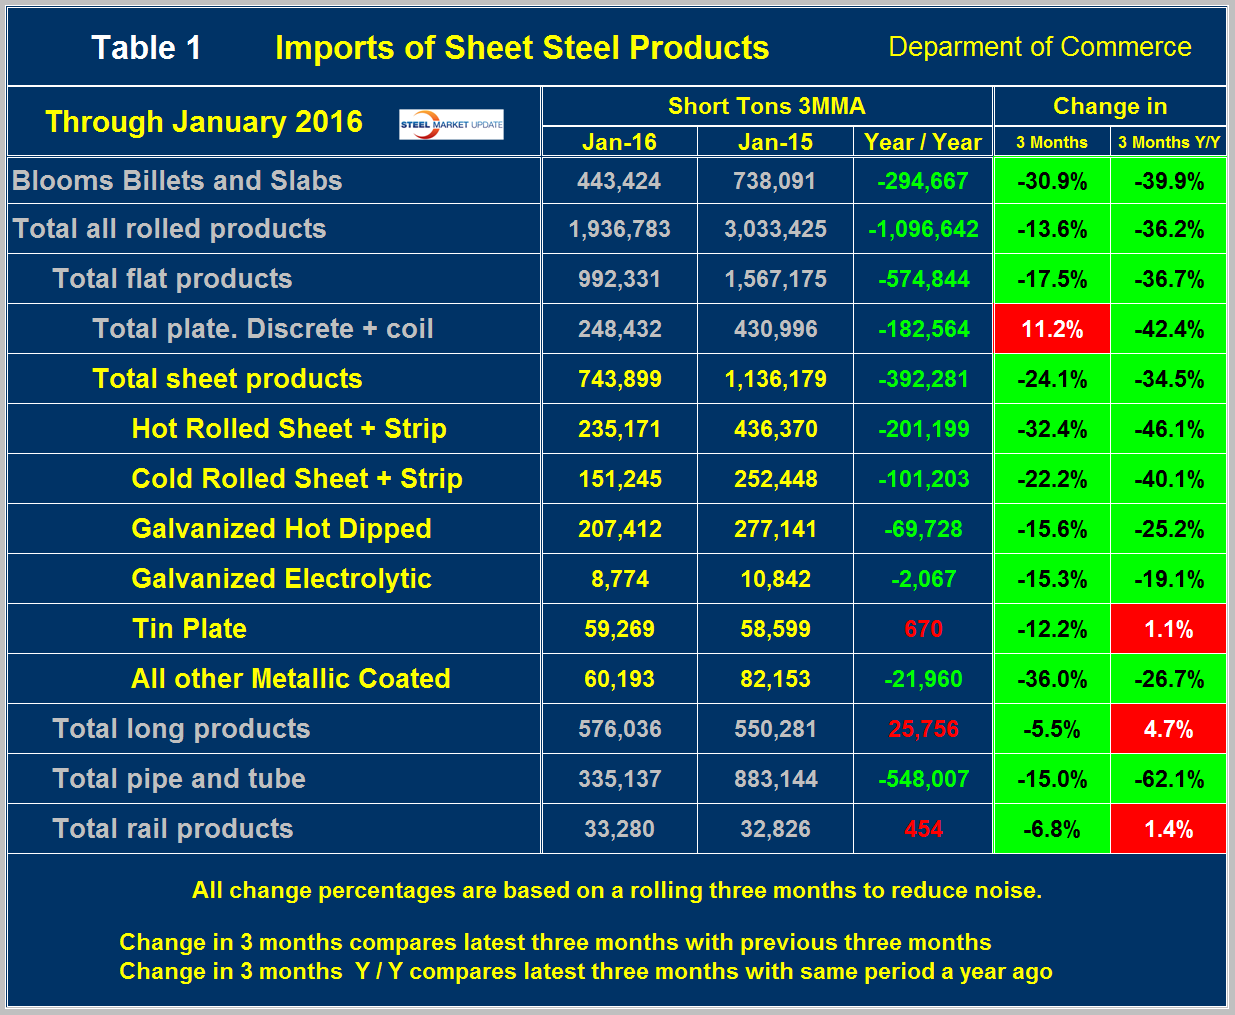
It compares the average monthly tonnage in the latest three months through January with both three months through October (3M/3M) and three months through January 2015 (Y/Y). On a Y/Y basis the total of all rolled products was down by 36.2 percent, as total sheet products was down by 34.5 percent. Tubulars were down by 62.1 percent. Semi-finished slabs, blooms and billets were down by 30.9 percent 3M/3M and down by 39.9 percent Y/Y. The total volume of hot worked products was 1,936,783 tons in January on a 3MMA basis, down by over a million tons from January 2015. The total hot worked tonnage was down by 13.6 percent 3M/3M and down by 36.2 percent Y/Y. These trends indicate that in the big picture the overall volume of imports is falling fast but the rate of decline has slowed as shown by cases where the 3 month decline is less than the year over year decline. The color codes in Tables 1 and 2 for the three month and year over year change show which products are improving and which have still experienced import volume increases in these two time frames.
Table 2 shows the same analysis for long products and it is immediately obvious that the situation is far different than for flat rolled.
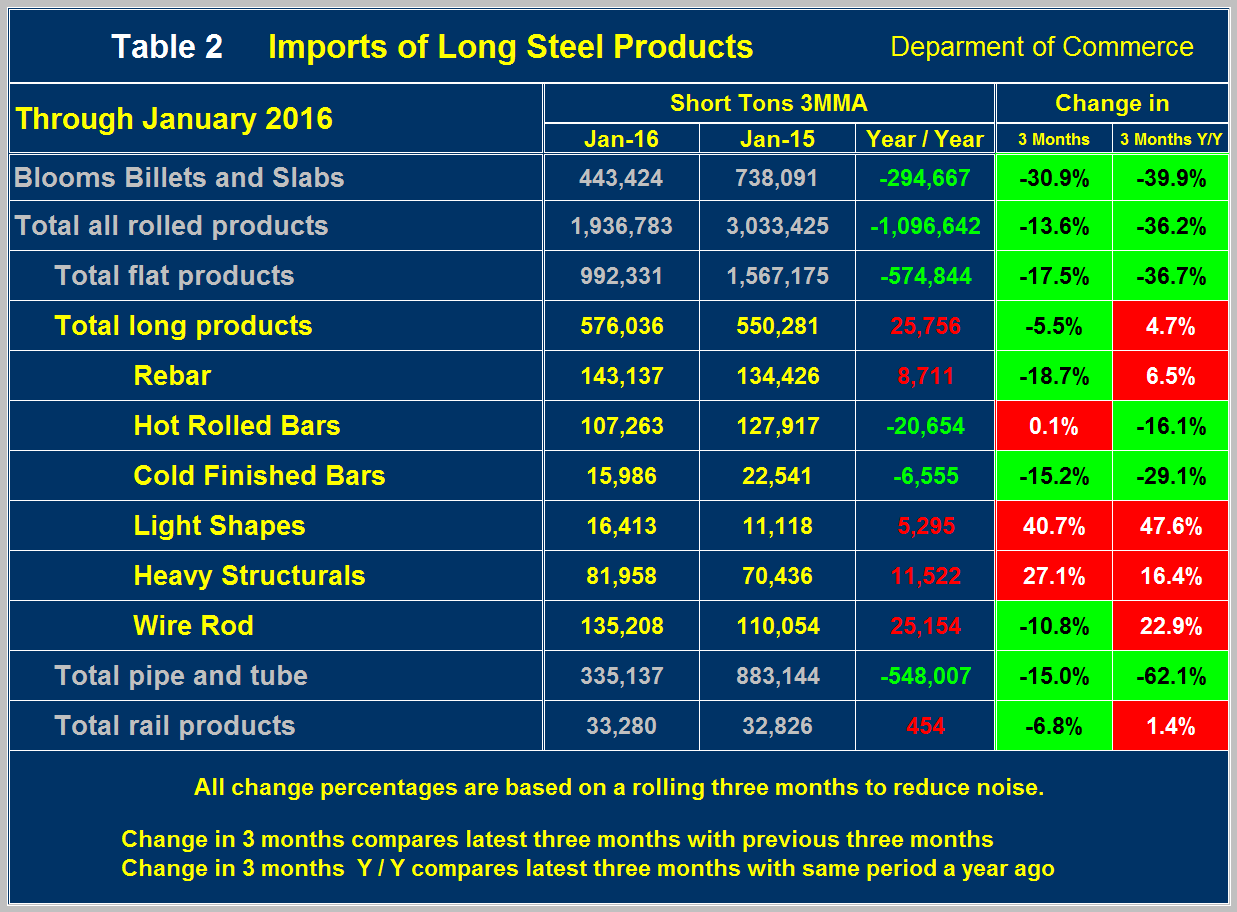
For total long products the tonnage was up by 25,756 tons Y/Y which was 4.7 percent. In 3M/3M the volume decreased by 5.5 percent. Light shapes had a particularly strong surge in both the three and twelve month comparisons. Wire rod was up by 22.9 percent year over year. Imports of pipe and tube declined by 15.0 percent 3M/3M and by 62.1 percent Y/Y.
Figure 3 shows the import market share of sheet and long products through November which is the latest data available for total steel supply.
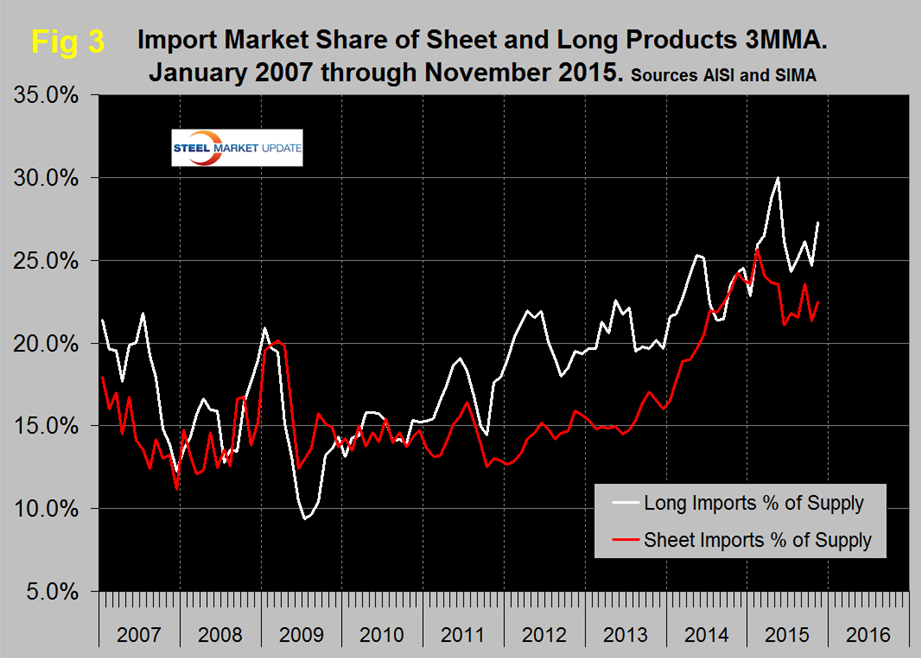
The import market share of sheet products peaked at 24.3 percent in March, fell to 21.3 in October then rose again to 22.5 percent in November. For long products the import share peaked at 30 percent in May, declined to 24.7 percent in October then in this latest data bounced back to 27.3 percent.
Explanation: The SMU publishes several import reports ranging from this very early look using licensed data to the very detailed analysis of final volumes by product, by district of entry and by source nation which is available on the premium member section of our web site. The early look, the latest of which you are reading now has been based on three month moving averages (3MMA) using the latest licensed data, either the preliminary or final data for the previous month and final data for earlier months. We recognize that the license data is subject to revisions but believe that by combining it with earlier months in this way gives a reasonably accurate assessment of volume trends by product as early as possible. We are more interested in direction than we are in absolute volumes at this stage. The main issue with the license data is that the month in which the tonnage arrives is often not the same month in which the license was recorded. In 2014 as a whole our data showed that the reported licensed tonnage of all carbon and low alloy products was 2.3 percent less than actually receipts, close enough we believe to confidently include licensed data in this current update. The discrepancy declined continuously during the course of the twelve month evaluation as a longer time period was considered.


