Market Data

March 1, 2016
End of Month Data for February 2016
Written by John Packard
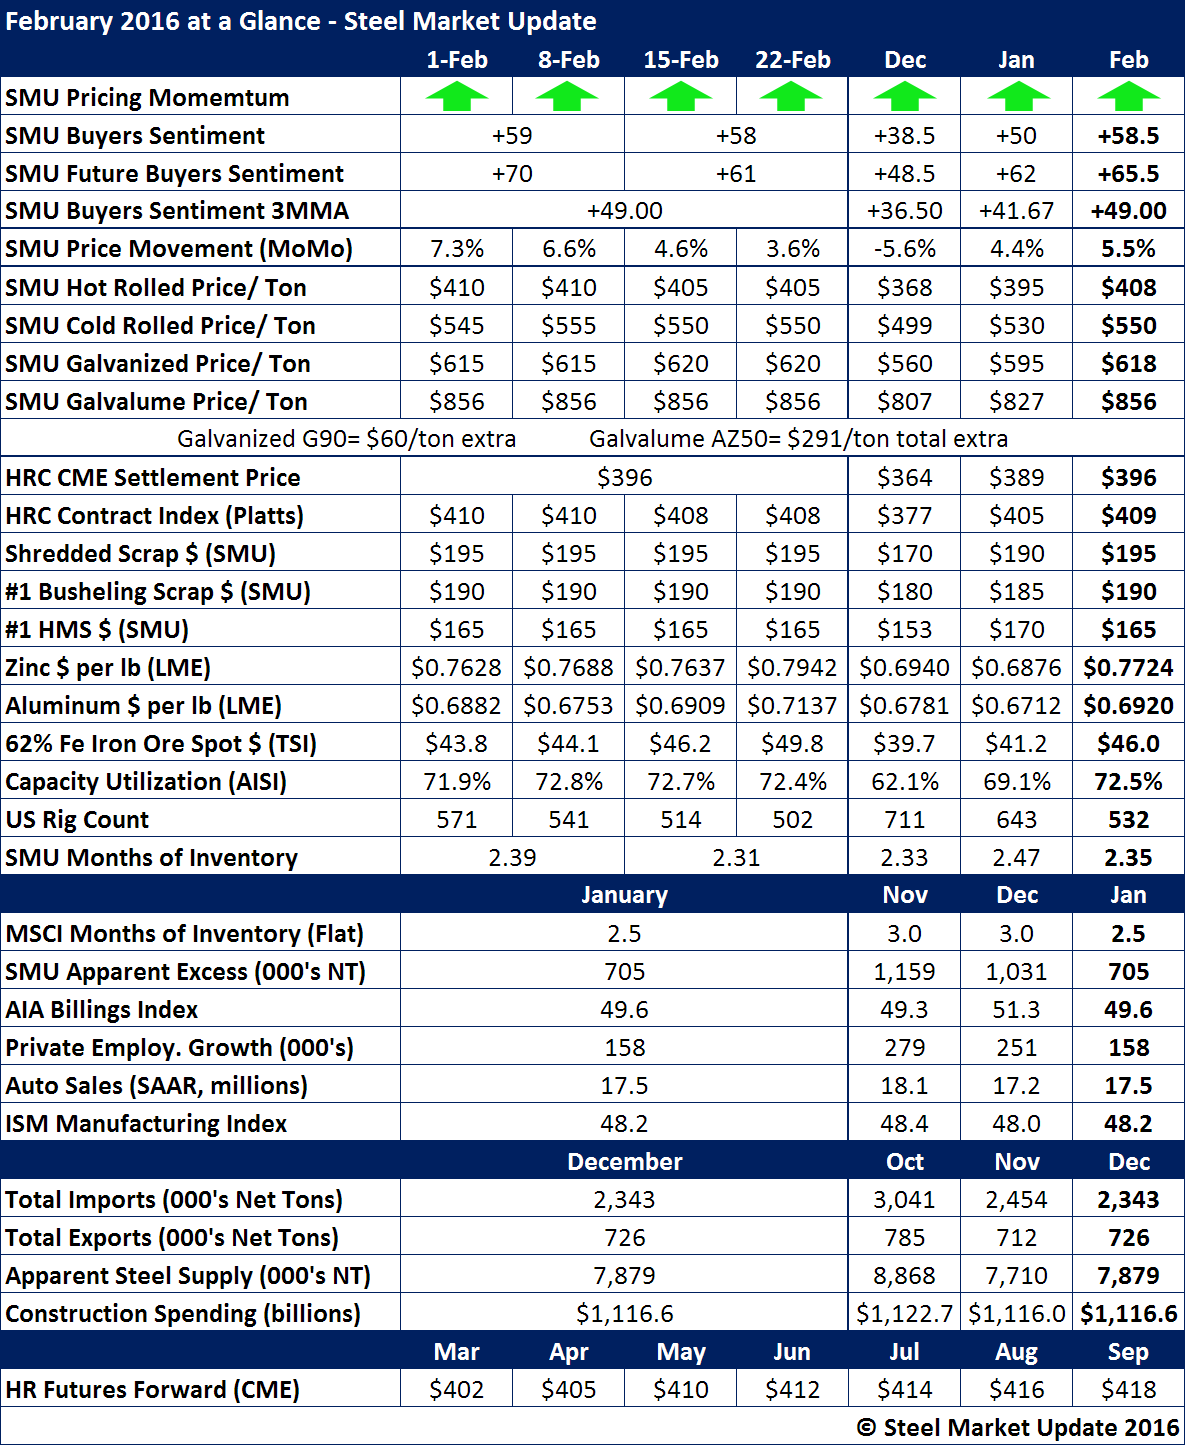
Steel prices continued their three month hike higher as SMU benchmark hot rolled price index (average) for the month was $408 per ton. Even with some minor stumbles noted in hot rolled and cold rolled during the second half of the month, our Price Momentum Indicator is still pointing toward higher prices over the next 30 days. That was reinforced on the last day of the month as SSAB and ArcelorMittal raised plate and sheet spot prices.
Our $408 per ton average was in line with Platts $409 average. The Platts index is one used in some of the domestic steel mill contracts and one that SMU recommends due to its transparency.
The February CME HRC (hot rolled coil) settlement price was $396.
The SMU Sentiment Index improved both on a month to month basis as well as the 3 month-moving-average (3MMA). This, combined with our Service Center Apparent Excess/Deficit dropping by 300,000 tons (and expected to drop further when the February final MSCI numbers come out), are a couple of the reasons why we continue to keep our Price Momentum Indicator pointing toward higher flat rolled steel prices over the next 30 days.
We are seeing a number of the commodity prices rallying as iron ore ended the month just below $50/dmt for 62% Fe fines in China (today ore broke through the $50 barrier) and both aluminum and zinc have rallied off the lows of the month and ended the month on a higher note.
Rig counts, ISM Manufacturing Index, AIA Billings Index and capacity utilization rates are negatives while automotive continues to carry the steel industry on its back.