Prices

March 23, 2016
Global Steel Production Down M/M and Y/Y in February
Written by Brett Linton
According to data released by the World Steel Association, total world crude steel production for February 2016 was 120,412,000 metric tons, down 6,461,000 tons or 5.1 percent from the previous month. February 2016 production was down 4.1 percent over February 2015 production of 125,575,000 tons.
![]() North American production (United States, Canada, Mexico, Cuba, El Salvador, Guatemala, and Trinidad and Tobago) during February was 8,809,000 tons, down 293,000 tons or 3.2 percent compared to the previous month. When compared to February 2015 when North America produced 8,656,000 metric tons, February 2016 represents an increase of 1.8 percent.
North American production (United States, Canada, Mexico, Cuba, El Salvador, Guatemala, and Trinidad and Tobago) during February was 8,809,000 tons, down 293,000 tons or 3.2 percent compared to the previous month. When compared to February 2015 when North America produced 8,656,000 metric tons, February 2016 represents an increase of 1.8 percent.
The United States produced 6,366,000 tons in February, an estimated decrease of 90,000 metric tons or 1.4 percent over the previous month, but an increase of 180,000 tons or 2.9 percent compared to one year ago.
Crude production in the European Union in February totaled 13,081,000 tons, down 351,000 tons or 2.6 percent from the prior month. Compared to this time last year when crude steel production was 13,966,000 tons, February 2016 represents a decrease of 6.3 percent.
Total South American production in February was 3,180,000 tons, down 36,000 tons or 1.1 percent from the prior month and down 331,000 tons or 9.4 percent over levels one year ago.
Production in Africa for February was 912,000 tons, down 106,000 tons or 10.5 percent compared to the prior month. Compared to February 2015 when crude steel production was 1,244,000 tons, February 2016 represents a decrease of 26.7 percent.
Raw production in the Middle East in February was 2,175,000 tons, down 72,000 tons or 3.2 percent compared to last month and down 167,000 tons or 7.1 percent over February 2015.
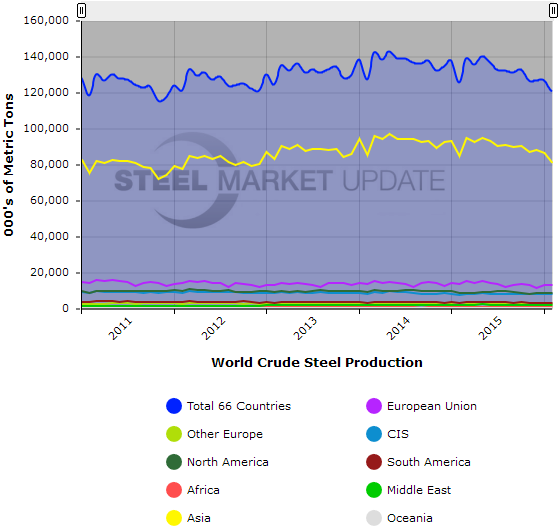
The largest steel producing market was Asia which produced 81,085,000 tons during the month of February. This represents a decrease of 5,436,000 tons or 6.3 percent over the prior month. When compared to February 2015 when crude steel production was 84,986,000 tons, February 2016 represents a decrease of 4.6 percent. (Source: World Steel Association)
Below is a graph showing global steel production data in total and for 9 major regions. To dig deeper and see each region’s data, you will need to view the graph on our website and use it’s interactive features, you can do so by clicking here. If you need assistance with either logging in or navigating the website, please contact our office at 800-432-3475 or info@SteelMarketUpdate.com.