Market Data

October 31, 2016
Chicago Business Barometer Reveals Weaker Q4
Written by Sandy Williams
Economic activity in October lost some of the momentum gained in third quarter, according to the latest survey by MNI Indicators. The Chicago Business Barometer fell 3.6 points to a five month low of 50.6 in October. The three month moving average was at 52.1, down from 53.8 in September.
Production dropped 5.4 points from September’s nine month high and the new orders component of the Barometer fell to its lowest level since May. Backlogs remained in contraction although improving slightly. Inventory levels fell at the fastest pace since May 2016 and moved back into contraction. Supplier deliveries were at their lowest levels since June.
Prices paid were at their highest level since November 2014 as oil prices improved and prices for steel and plastic products increased. MNI noted that suppliers have pushed for, and received, sought after price increases in October.
Companies still expect orders to increase in Q4 but were less optimistic about than they were a year ago or in June of this year. MNI reports 45 percent of those surveyed expect demand to stay unchanged as election uncertainty continues.
“A key takeaway from the latest survey was the pick-up in Prices Paid to a nearly two-year high. Inflationary pressures are on the rise, which is one of the metrics the Federal Reserve has been waiting for to increase rates. However, economic growth ahead, as read by the October Chicago Business Barometer, looks very disappointing. Hopefully, it doesn’t mark the start of a downward trend,” said Lorena Castellanos, senior economist at MNI Indicators.
About The Chicago Business Barometer:
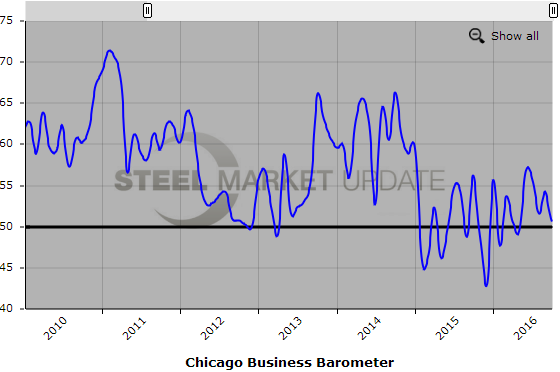
The Chicago Business Barometer, produced monthly by ISM and MNI Indicators, is a closely watched leading indicator of U.S. economic activity and is based on a survey panel of purchasing/supply chain professionals, primarily drawn from membership of the Institute for Supply Management-Chicago (ISM-Chicago). The survey panel contains both manufacturing and non-manufacturing firms, many with global operations. A reading above 50 indicates expansion, and below 50 indicates contraction.
Below is a graph showing the history of the Chicago Business Barometer. You will need to view the graph on our website to use its interactive features, you can do so by clicking here. If you need assistance logging into or navigating the website, please contact our office at 800-432-3475 or info@SteelMarketUpdate.com.