Market Data

February 3, 2017
SMU Apparent Excess/Deficit Model: Service Center Flat Rolled Inventories
Written by John Packard
Service center flat rolled steel inventories grew in December based on our Service Center Inventories Apparent Excess/Deficit model.
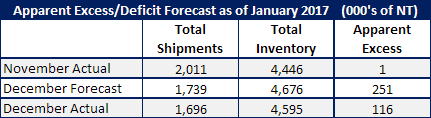
November shipments totaled 2,011,000 tons, inventories of flat rolled were 4,446,000 tons (MSCI numbers) and the Apparent Excess as of the end of November 2016 was 1,000 tons. Service centers were, according to the SMU model, in a balanced inventory status.
SMU projected shipments in December 2016 would be down from the November levels (as they are every year due to the holidays). We forecast shipments of carbon flat rolled would be 1,739,000 tons. According to the MSCI shipments were 43,000 tons lower at 1,696,000 tons.
We also forecast inventories would come in at 4,676,000 tons, an increase of 230,000 tons compared to November ending inventories. Actual inventories at the service centers were 4,595,000 tons, 81,000 fewer tons than our forecast.
Our forecast for December was for the Apparent Excess of carbon flat rolled inventories would expand from 1,000 tons to 251,000 tons. Inventories did expand but only to 116,000 tons.
January Forecast
For the month of January SMU is forecasting shipments of 2,190,000 tons (+23.3 percent above December levels which is the average of the last 4 years).
Flat rolled inventories at the U.S. service centers are forecast to be 4,570,000 net tons at the end of January. If correct, then our Apparent Excess/Deficit model would show a 25,000 ton excess at the end of the month.
Looking forward is we continue with our assumption that the service centers shipments and receipts would be at the 4-year average month/month rate of change this is what would happen with service center inventories:
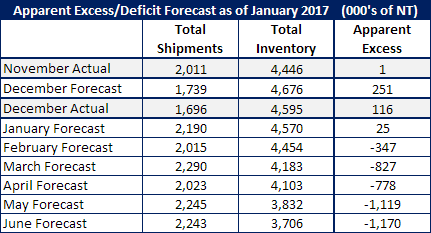
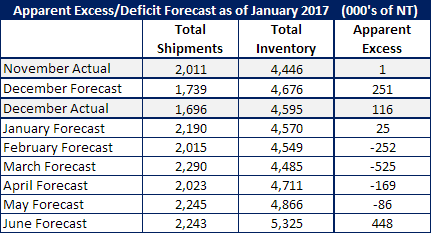
As you can see by the above table if we continue to use the 4-year average for receipts and shipments service center flat rolled inventories will go into a deepening deficit. We believe it is much more likely that the service centers will increase their purchases. If we expand receipts to be 5 percent higher than the 4 year average during the months of February through June this is what would happen to our Apparent Excess/Deficit model:
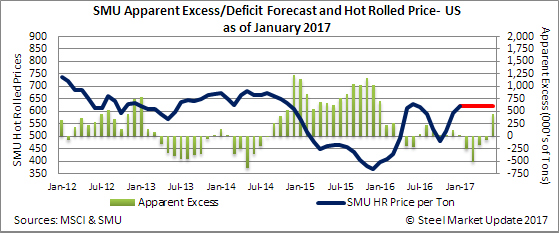
At the moment our Price Momentum Indicator is at Neutral which means prices are in transition and could go higher or lower from here. Since we just came off 13 weeks of higher prices and the SMU hot rolled index average was down $10 per ton this week the chances of prices going lower from here are higher than prices moving up. Even so, neutral means they could go in either direction. Below is our forecast for HRC prices (red line) in light of our Neutral Indicator. Once price direction becomes clearer we will adjust our forecast.
The SMU opinion is receipts will rise as will inventories over the next five months.