Prices

February 14, 2017
Analysis of Sheet Steel Imports by District of Entry and Source
Written by Peter Wright
We believe that miss-information (or lack of) about regional import volumes is often used to influence purchase decisions. Our intent with this analysis of tonnage by district of entry is to describe in detail what is going on in a company’s immediate neighborhood and thus provide a negotiating advantage for our premium subscribers.
![]() We are now publishing monthly data in the Imports/Exports section of our website that breaks down the tonnage of the four major sheet products (hot rolled, cold rolled, hot dipped galvanized, and other metallic coated) into the port of entry and country of origin in metric tons. This data set is large, therefore we will make no attempt to provide a commentary. Each readers interest will be different and he/she simply needs to select one of the four products then find the nearest port or ports of entry to see how much came into their region each month and where from. It is clear from these detailed reports that the growth of tonnage entering a particular district in many cases is completely different to the change in volume at the national level.
We are now publishing monthly data in the Imports/Exports section of our website that breaks down the tonnage of the four major sheet products (hot rolled, cold rolled, hot dipped galvanized, and other metallic coated) into the port of entry and country of origin in metric tons. This data set is large, therefore we will make no attempt to provide a commentary. Each readers interest will be different and he/she simply needs to select one of the four products then find the nearest port or ports of entry to see how much came into their region each month and where from. It is clear from these detailed reports that the growth of tonnage entering a particular district in many cases is completely different to the change in volume at the national level.
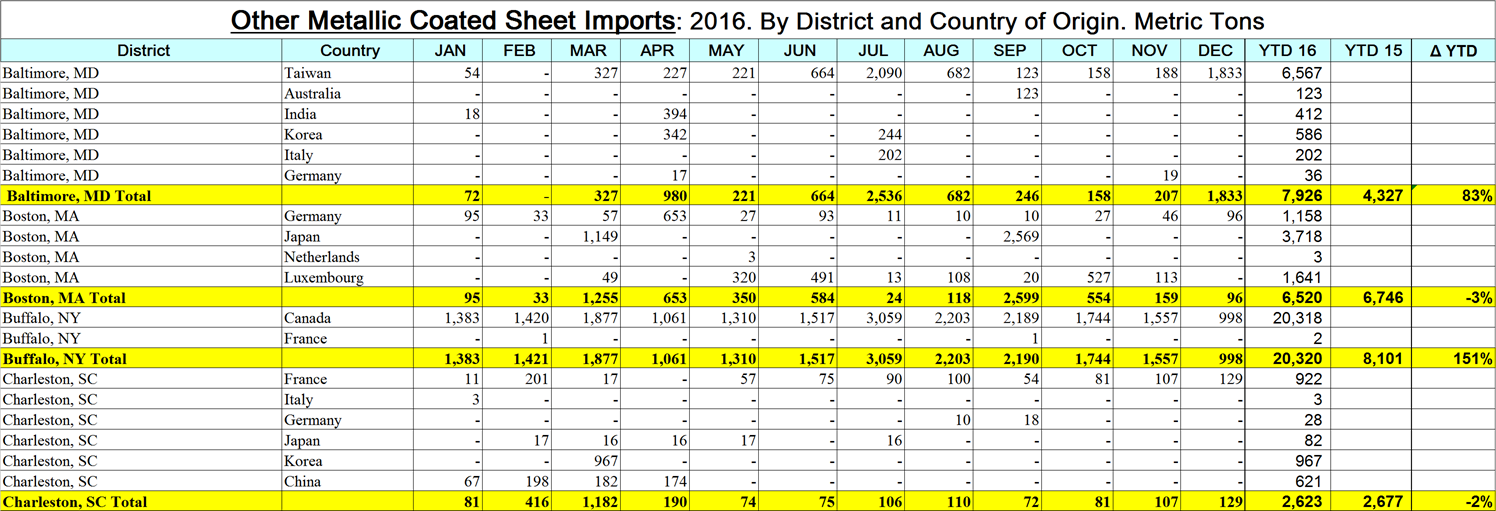
The table included here (click to enlarge) is a small extract from the data sheet for other metallic coated coil which is mainly Galvalume. It describes the tonnage that has come in through Baltimore, Boston, Buffalo and Charleston. It shows where it came from, the YTD tonnage and the YTD change compared to 2015. The grand total volume of OMC through December was down by 2.0 percent but Baltimore and Buffalo had a large increase in tonnage.
The differences between regions and the discrepancy between each region and the national total is why we think it important for both market understanding and negotiating position to know what is going on in your own back yard.
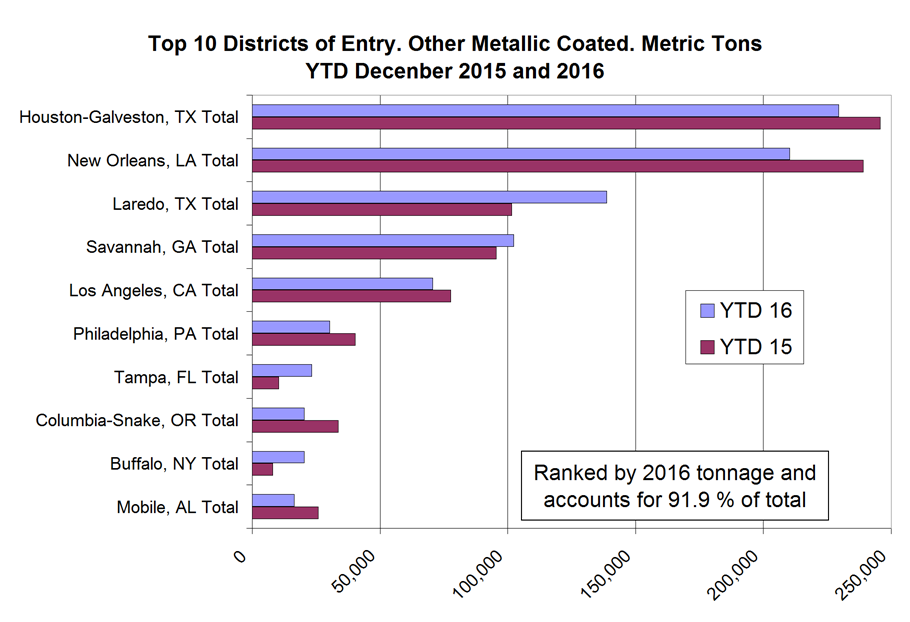
The chart shows graphically the tonnage of OMC that entered the top 10 districts in YTD December for 2015 and 2016 and is ranked by 2016 tonnage. These 10 districts account for 91.9 percent of the grand total in 2016. Houston and New Orleans received the most tonnage in both years but were down YTD by 7 percent and 12 percent respectively.
The data in these detailed reports is compiled from tariff and trade data from the U.S. Department of Commerce and the U.S. International Trade Commission. Our other import reports are sourced from U.S. Department of Commerce, Enforcement and Compliance, otherwise known as the Steel Import Monitoring System. In the development of these reports by district and source country we have discovered that the SIMA data for HRC and CRC contains some high alloy steel such as stainless and tool steel which have been miss classified at the ports. These alloy steels are not included in our detailed reports which results in a discrepancy between the two data sets for CRC in particular and for HRC to a lesser degree.