Analysis
May 11, 2018
March Heating and Cooling Equipment Shipment Data
Written by Brett Linton
Below is the latest data released by the the Air-Conditioning, Heating, and Refrigeration Institute (AHRI) regarding residential and commercial heating and cooling equipment shipments through March 2018. You may read the full press release on their website here.
Residential Storage Water Heaters
U.S. shipments of residential gas storage water heaters for March 2018 decreased 2.2 percent, to 414,458 units, down from 423,787 units shipped in March 2017. Residential electric storage water heater shipments decreased 2.9 percent in March 2018, to 390,281 units, down from 401,754 units shipped in March 2017.
Year-to-date U.S. shipments of residential gas storage water heaters increased 2.1 percent, to 1,180,448, compared to 1,156,644 shipped during that same period in 2017. Residential electric storage water heater shipments increased 0.6 percent year-to-date, to 1,104,062 units, compared to 1,097,558 shipped during the same period in 2017.
Commercial Storage Water Heaters
Commercial gas storage water heater shipments decreased 1.2 percent in March 2018, to 9,860 units, down from 9,976 units shipped in March 2017. Commercial electric storage water heater shipments increased 7.1 percent in March 2018, to 13,431 units, up from 12,546 units shipped in March 2017.
Year-to-date U.S. shipments of commercial gas storage water heaters decreased 1.5 percent, to 25,374 units, compared with 25,761 units shipped during the same period in 2017. Year-to-date commercial electric storage water heater shipments increased 1.3 percent, to 34,873 units, up from 34,422 units shipped during the same period in 2017.
Warm Air Furnaces
U.S. shipments of gas warm air furnaces for March 2018 increased 10.7 percent, to 268,582 units, up from 242,530 units shipped in March 2017. Oil warm air furnace shipments decreased 6.3 percent, to 2,158 units in March 2018, down from 2,304 units shipped in March 2017.
Year-to-date U.S. shipments of gas warm air furnaces increased 12.4 percent, to 740,141 units, compared with 658,540 units shipped during the same period in 2017. Year-to-date U.S. shipments of oil warm air furnaces decreased 1.5 percent, to 7,780 units, compared with 7,897 units shipped during the same period in 2017.
Central Air Conditioners and Air-Source Heat Pumps
U.S. shipments of central air conditioners and air-source heat pumps totaled 828,513 units in March 2018, up 6.1 percent from 780,712 units shipped in March 2017. U.S. shipments of air conditioners increased 2 percent, to 528,041 units, up from 517,518 units shipped in March 2017. U.S. shipments of air-source heat pumps increased 14.2 percent, to 300,472 units, up from 263,194 units shipped in March 2017.
Year-to-date combined shipments of central air conditioners and air-source heat pumps increased 6.7 percent, to 1,827,120, up from 1,711,938 units shipped in March 2017. Year-to-date shipments of central air conditioners increased 1.9 percent, to 1,102,420 units, up from 1,081,918 units shipped during the same period in 2017. The year-to-date total for heat pump shipments increased 15 percent, to 724,700, up from 630,020 units shipped during the same period in 2017.
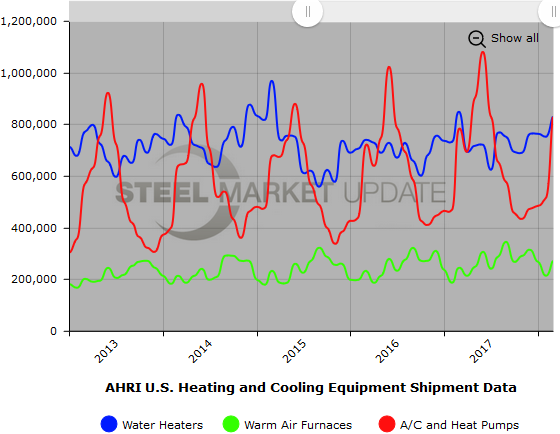
Below is a graph showing the history of water heater, warm air furnace, and air conditioner shipments. You will need to view the graph on our website to use it’s interactive features; you can do so by clicking here. If you need assistance with either logging in or navigating the website, please contact our office at 800-432-3475 or info@SteelMarketUpdate.com.