Market Data

September 13, 2018
SMU Analysis: Imports of Coiled Plate by Region
Written by Peter Wright
Each month, Steel Market Update produces an import analysis by region for two of the six flat rolled product groups (HRC, CRC, HGD, OMC, CTL plate and coiled plate). This month, we are focusing on plate products. The intent of these regional updates is to bridge the gap between our monthly licensed data summaries and the detailed monthly reports we produce for premium subscribers that cover import volume by port and source.
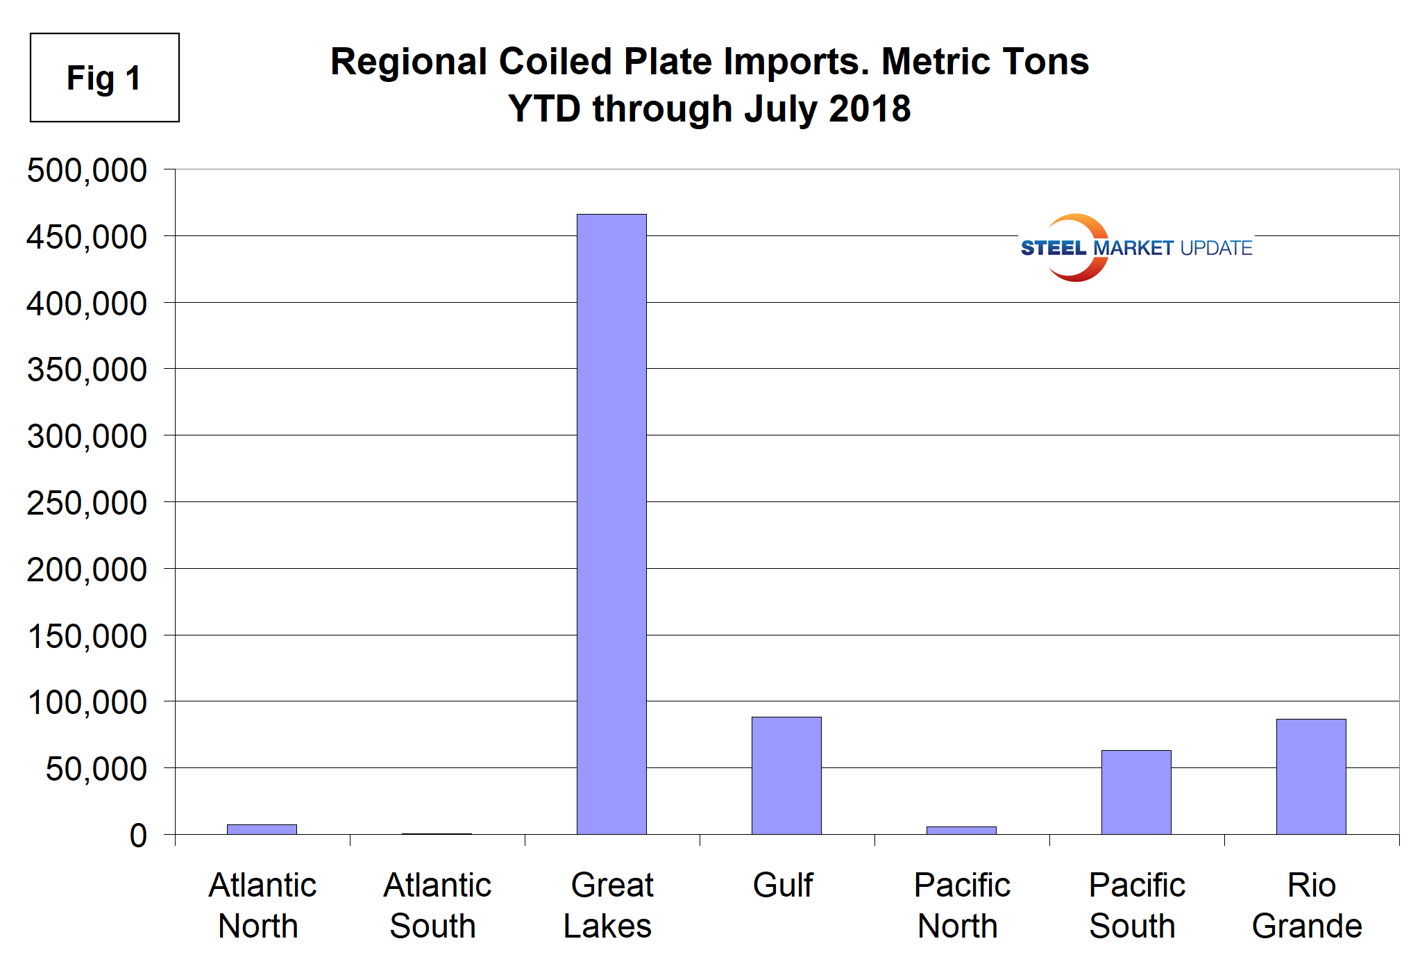
Important to note about coiled plate is that in the 19 months from January 2017 through July 2018, the Great Lakes region received three times as much tonnage as all other regions combined. The Rio Grande, Gulf and Pacific South were a distant second, third and fourth, respectively. Minimal tonnage arrived at the North and South Atlantic or Pacific North ports. Figure 1 shows the year-to-date tonnage into each region and the dominance of the Great Lakes.
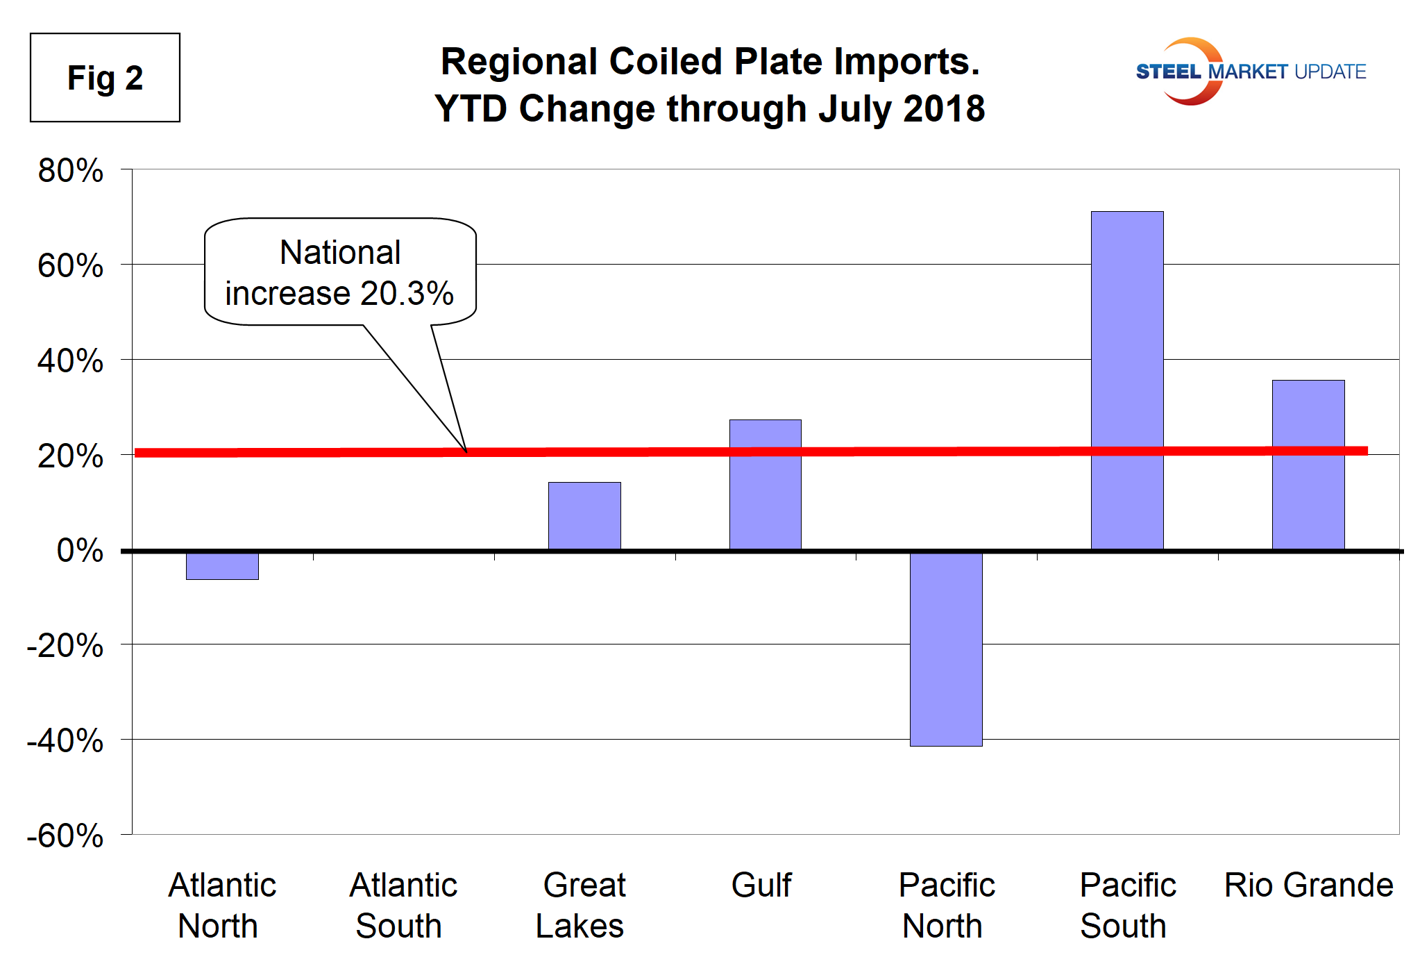
National level import reports do a good job of measuring the overall market pressure by product, but the downside is that there are huge regional differences. Figure 2 shows the year-to-date change for each of seven regions and the change at the national level. Imports of coiled plate into the U.S. as a whole were up by 20.3 percent year to date compared to 2017. Growth in the Great Lakes region where most of the tonnage arrived was 14.1 percent year to date. The tonnage into the Pacific South ports of Los Angeles and San Diego increased by 71.1 percent and across the Rio Grande was up by 35.6 percent.
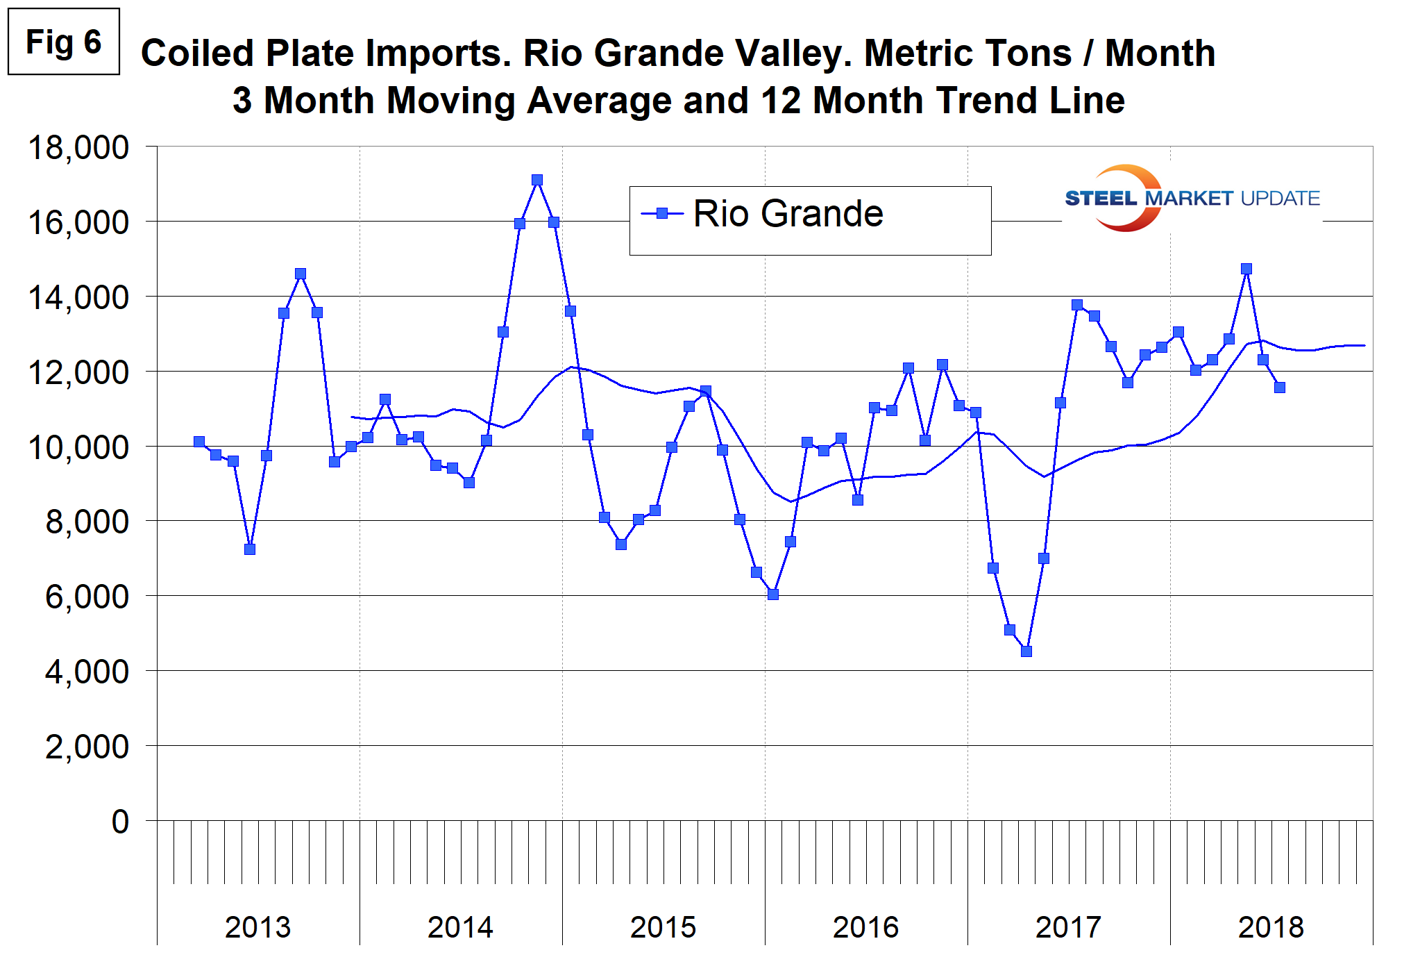
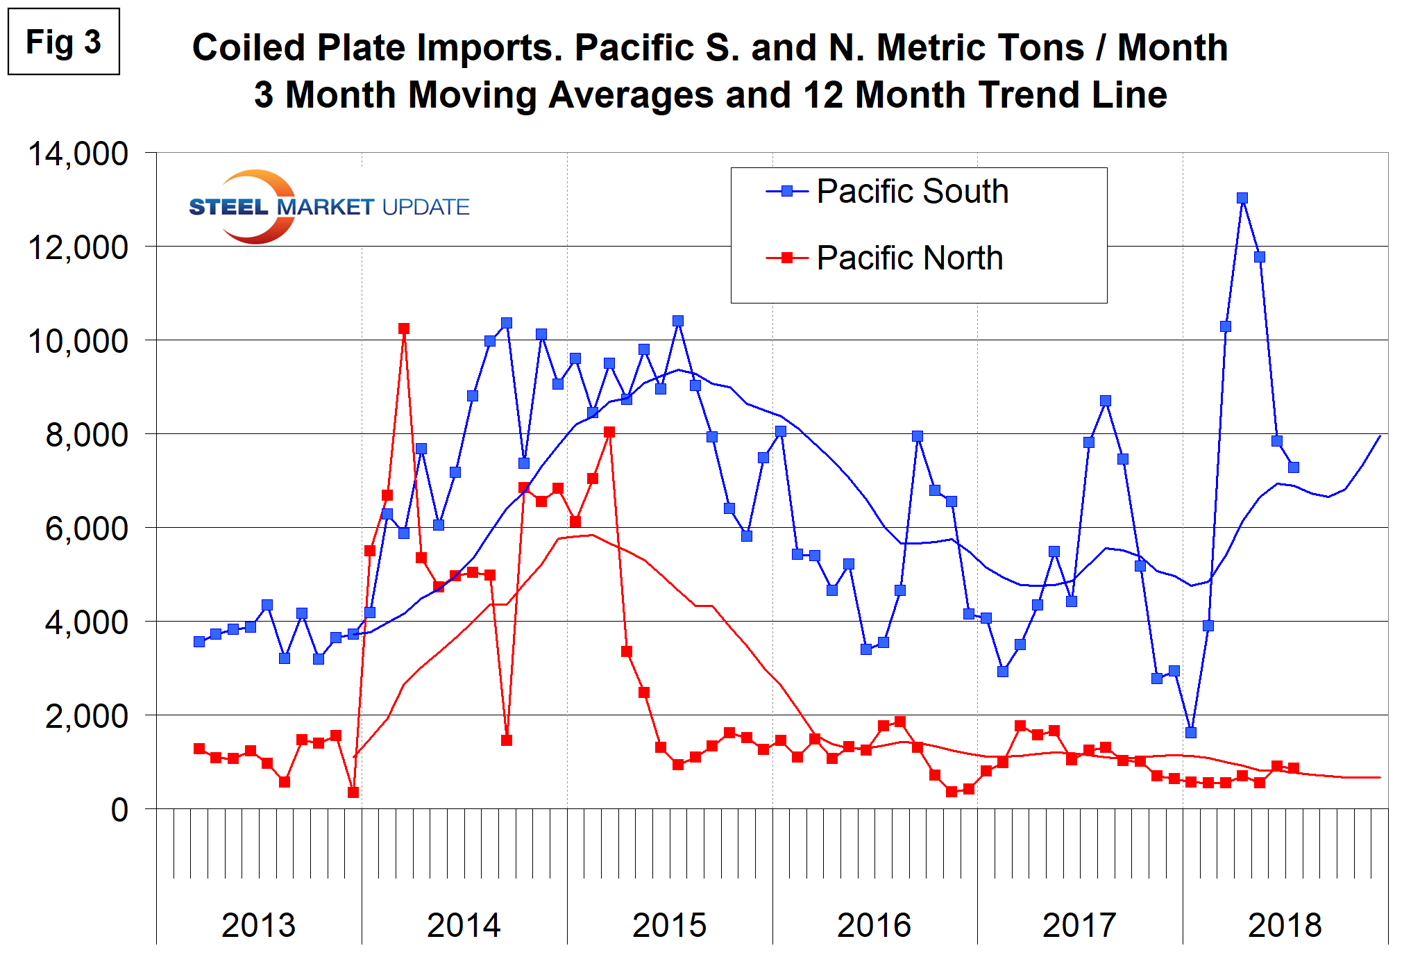
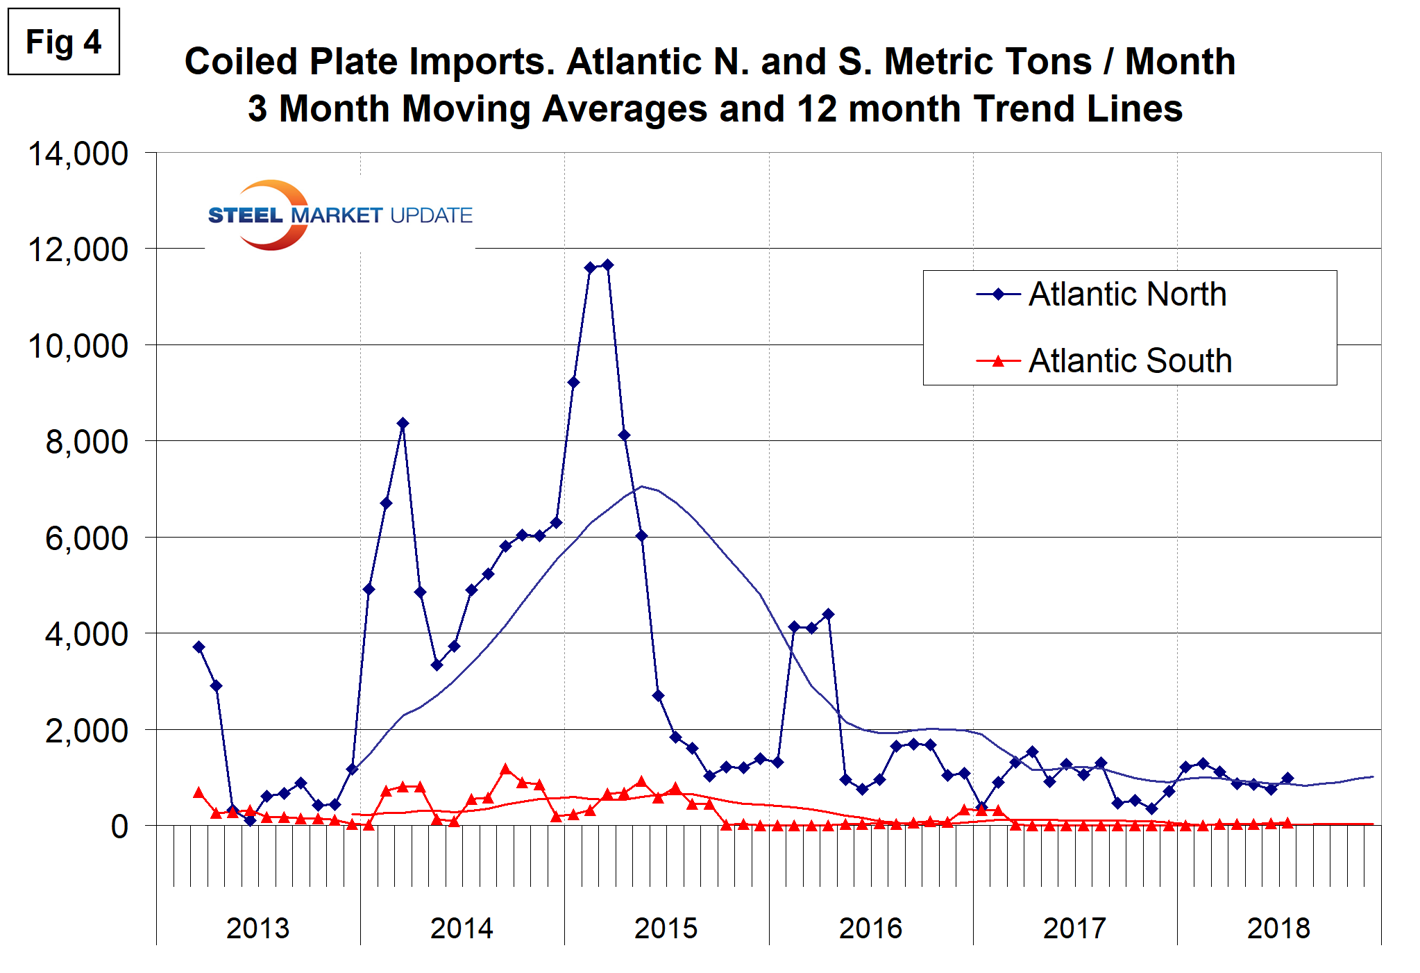
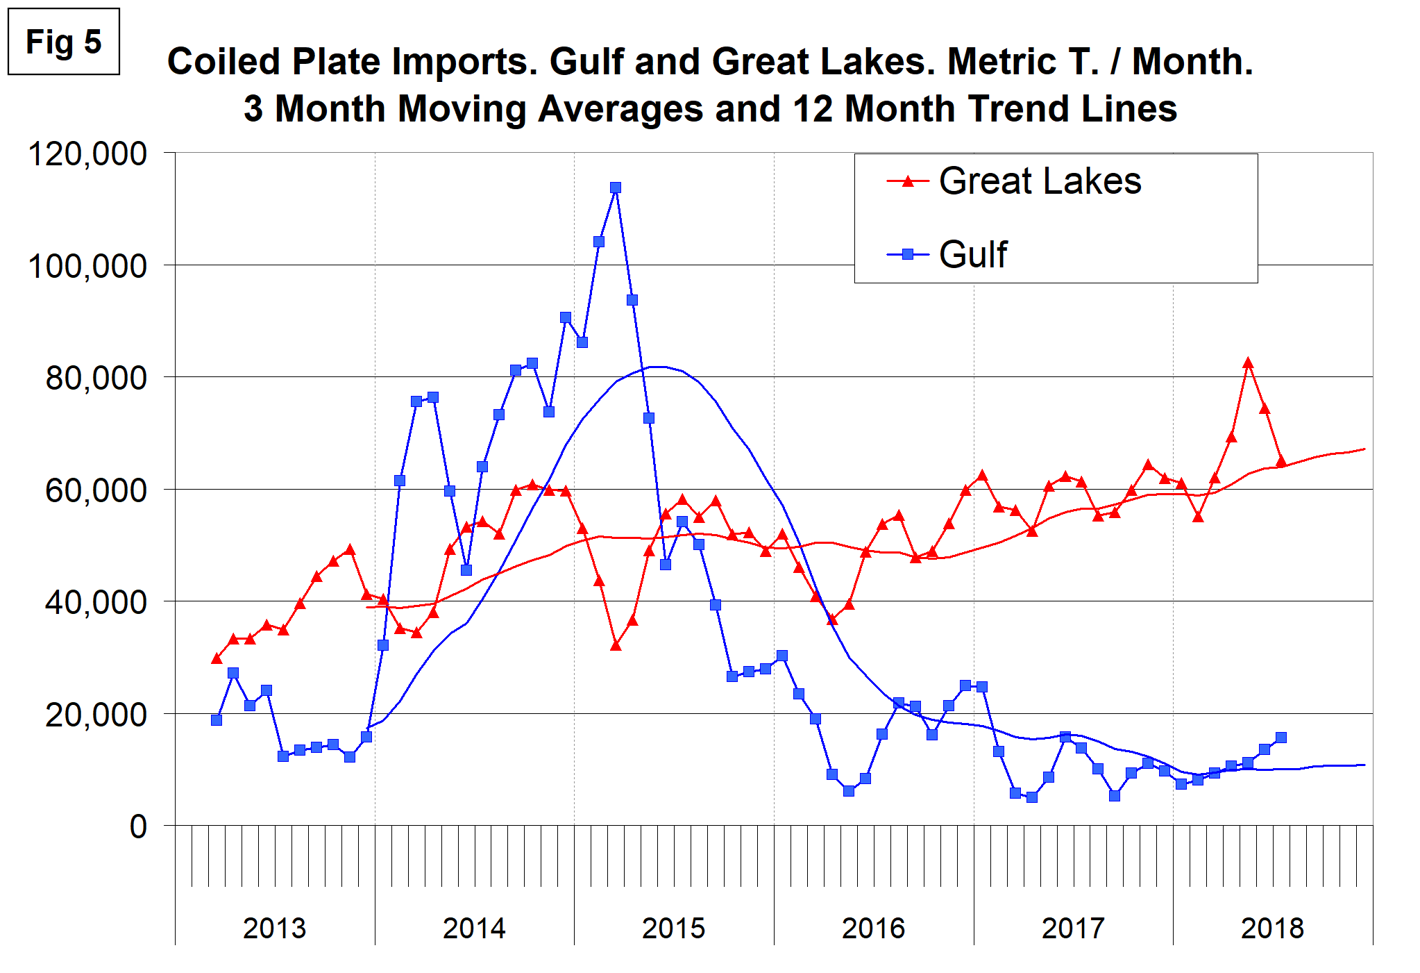
Figures 3, 4, 5 and 6 show the history of coiled plate imports by region since March 2013 on a three-month moving average basis. There has been a drastic decline of coiled plate imports into the Pacific North since 2014 and the first half of 2015. Tonnage into the Pacific South has been trending up for 18 months.
Coiled plate imports into the whole Atlantic seaboard have been minimal since mid-2015.
Import volume into the Great Lakes has been increasing steadily for two years. The trend into the Gulf is flat after a declining trend from 2015 through 2017.
Tonnage out of Mexico, mostly through Laredo, has trended up since the beginning of 2016 except for a four-month hiatus in February through May last year.