Market Data

October 22, 2018
China’s Economy Slows, But Not Its Steel Production
Written by Peter Wright
The growth of the Chinese economy has slowed, but their steel production is growing almost three times as fast as the rest of the world.
Once each quarter, Steel Market Update publishes the official statistics for Chinese GDP, industrial production, consumer price inflation and fixed asset investment. Many analysts don’t believe these self-serving Party figures, but we include them in our reports because of the importance of China on the global steel scene, and these numbers are all that’s available. China’s economic statistics are never revised, which makes them suspicious. The U.S. routinely makes revisions back decades. Figure 1 shows published data released this week for the growth of GDP, industrial production and consumer prices through the third quarter of 2018. The GDP and industrial production portions of this graph are three-month moving averages (3MMAs).
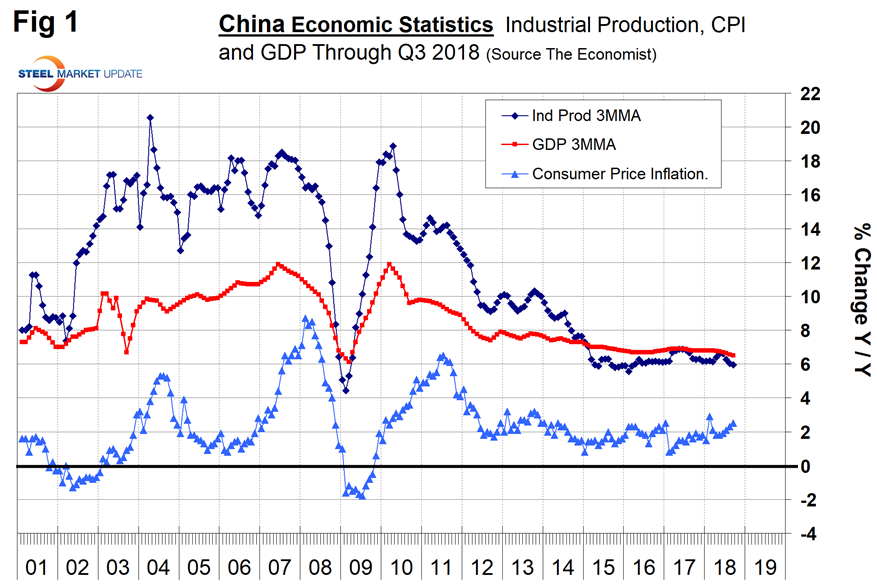
GDP grew at a rate of 6.5 percent in Q3, down from 6.6 percent in Q2 and 6.7 in Q1. Growth has gradually slowed from 7.0 percent in the first and second quarters of 2015. Issues are reported to be tightening by the central bank to tame excess credit, efforts to improve environmental controls and to reduce capacity in heavy industries including steel manufacturing. The imposition of tariffs by the U.S. on Chinese imports has so far had no effect, and in fact the trade surplus with the U.S was at an all-time high in September.
The growth of industrial production slowed from 7.0 percent in April to 5.7 percent in September. The 3MMA slowed from 6.4 percent to 6.0 percent in the same time fame. There has been a decline in sentiment across the Chinese economy as investors await the outcome of the reciprocal trade actions with the United States.
Figure 2 shows the growth of fixed asset investment year over year. In September, FAI grew at 5.4 percent, down from 7.9 percent in January. The slowdown has been partially driven by environmental restrictions and a reduction in new investment in heavy industries. In an attempt to reduce the slowdown, the government has reduced the export tax to help counter U.S. tariffs and is encouraging public works expenditures.
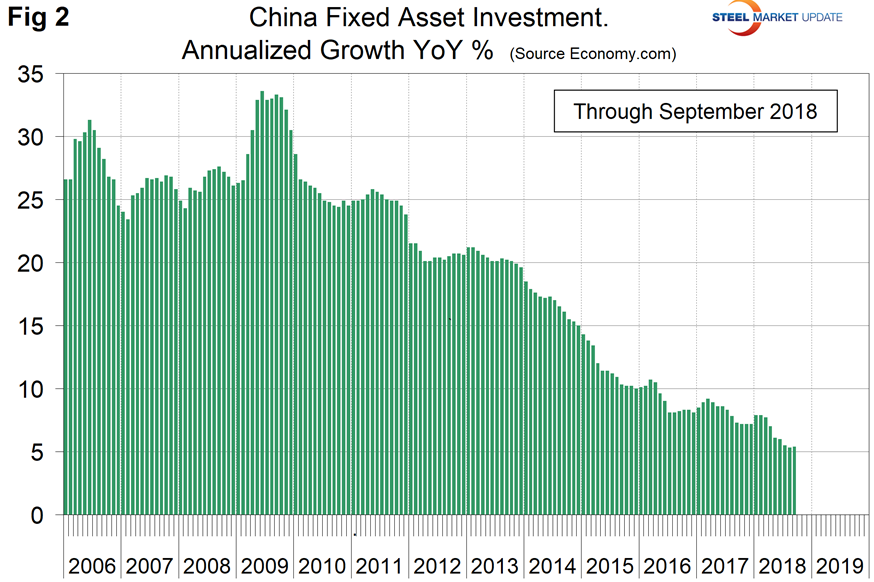
Figure 3 shows the 3MMA of China’s crude steel production through August when it accounted for 52.9 percent of global production. The World Steel Association is forecasting a deceleration in China’s steel production growth in 2019. Last week, the chairman of the WSA economics committee said that China is expected to experience zero growth in 2019, down from 6 percent this year. This is partly a result of trade tensions with the U.S., he reported.
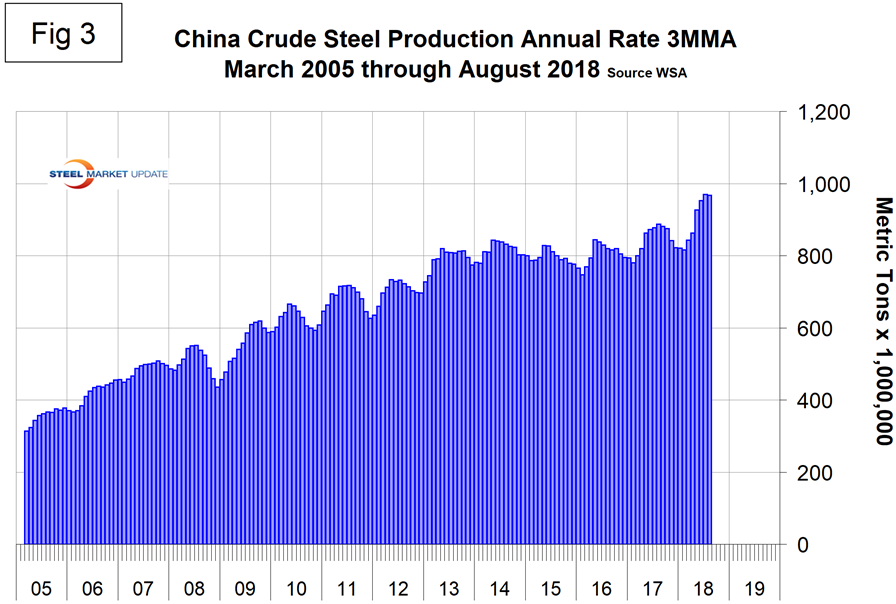
Figure 4 shows the year-over-year growth. After slowing for 13 straight months, China’s production has returned to positive growth each month since April 2016. Preliminary results for August continued this trend with 6.5 percent growth year over year. This compares to 2.2 percent for the rest of the world.
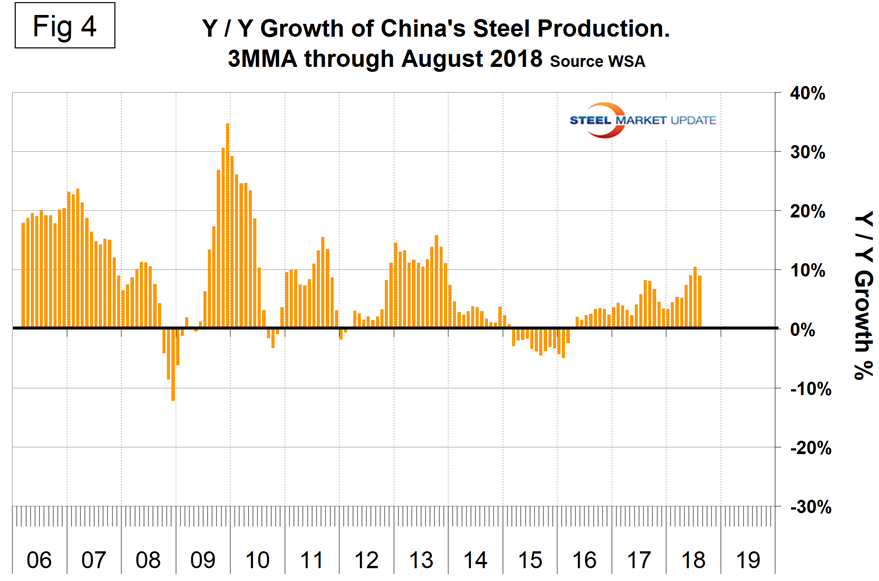
SMU Comment: For years now (since the Beijing Olympics), we’ve been reading about China’s intent to reduce steel production. The remarks from the World Steel Association reported in this piece are typical. The fact is it isn’t happening! China’s share of global steel production was at an all-time high in August and production there is growing almost three times as fast as the rest of the world.