Market Data

December 17, 2018
BLS: U.S. Gains 155,000 Jobs in November
Written by Peter Wright
Net job creation in November totaled 155,000 positions. This was a correction from the very strong result in October, according to Steel Market Update’s latest analysis of Bureau of Labor Statistics employment data.
Table 1 breaks total U.S. employment down into service and goods-producing industries and then into private and government employees. Most of the goods-producing employees work in manufacturing and construction, and the components of these two sectors of most relevance to steel people are broken out in Table 1.
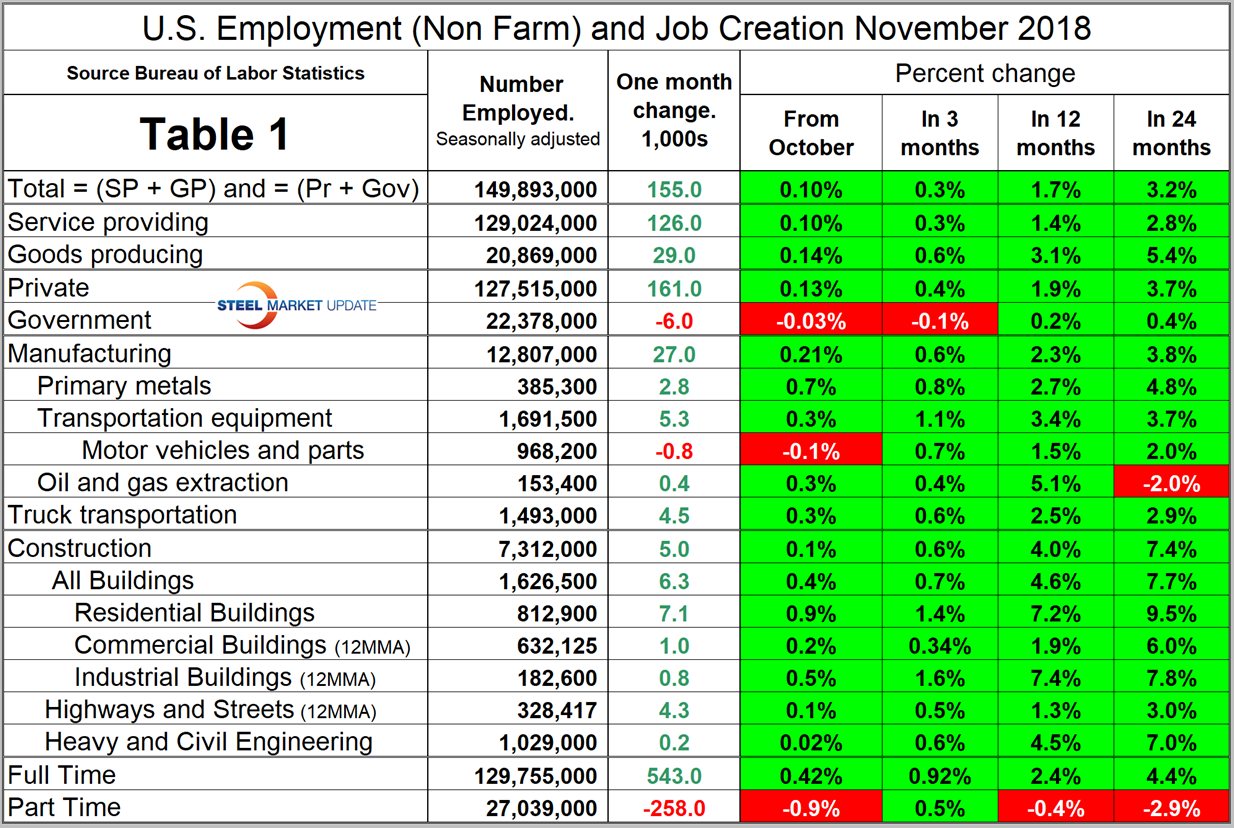
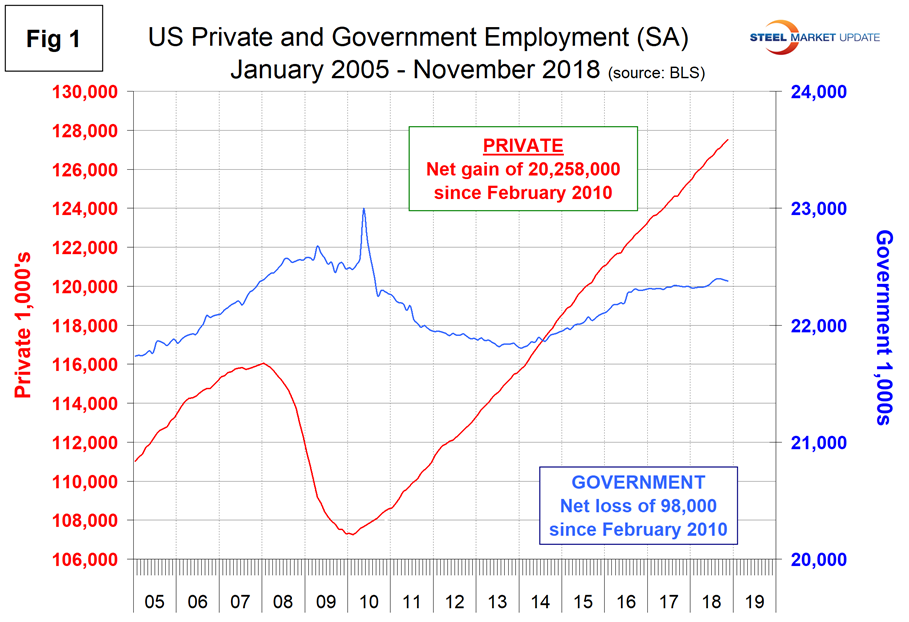
In November, 161,000 jobs were created in the private sector and government lost 6,000 jobs. The number employed by the federal government gained 3,000, state governments lost 13,000 jobs and local governments gained 4,000 jobs. Since February 2010, the employment low point, private employers have added 20,258,000 jobs as government has lost 98,000 (Figure 1).
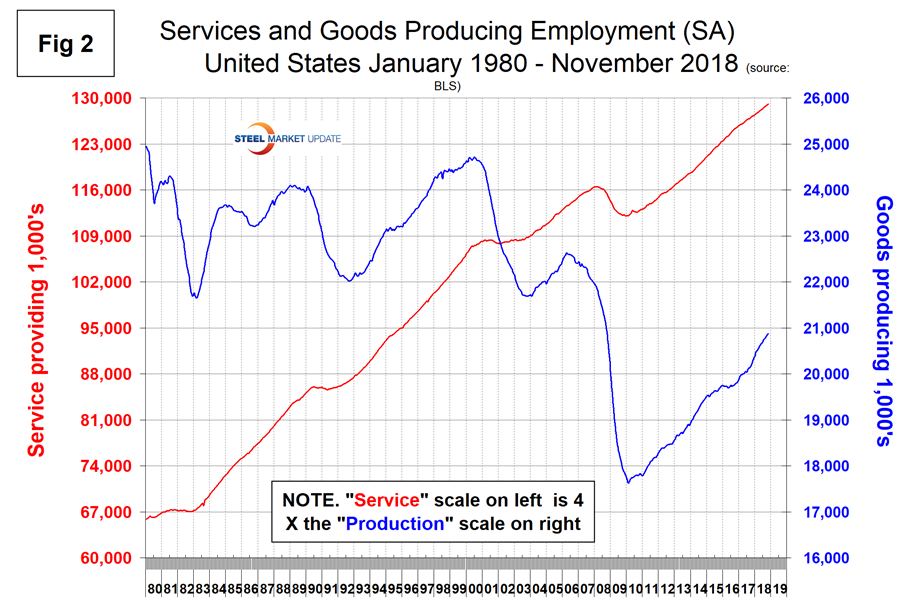
In November, service industries expanded by 126,000 as goods-producing industries, driven mainly by construction and manufacturing, expanded by 29,000 (Figure 2). Since February 2010, service industries have added 16,918,000 and goods-producing 3,242,000 positions. This has been a drag on wage growth since the recession as service industries on average pay less than goods-producing industries such as manufacturing.
Construction was reported to have gained 5,000 jobs in November making a total of 240,000 year to date. According to the Associated General Contractors of America, contractors are raising pay faster than at any time since the recession to attract workers from other industries, yet many firms report difficulty in filling positions.
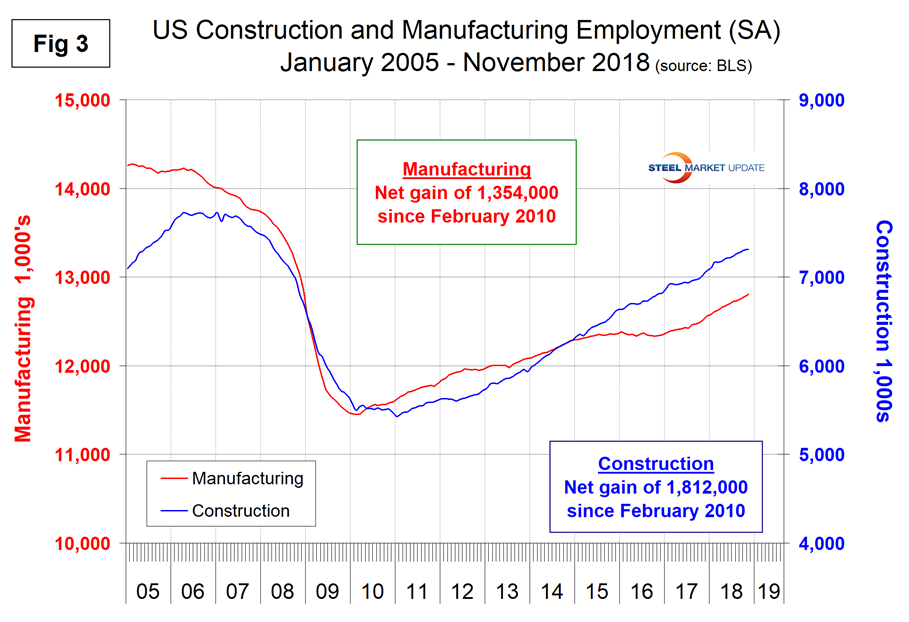
Manufacturing and construction are running neck and neck this year as job creators. Manufacturing gained 27,000 jobs in November making a total of 249,000 year to date. Figure 3 shows the history of construction and manufacturing employment since January 2005. Construction has added 1,812,000 jobs and manufacturing 1,354,000 since the recessionary employment low point in February 2010.
Note, the subcomponents of both manufacturing and construction shown in Table 1 don’t add up to the total because we have only included those with the most relevance to the steel industry.
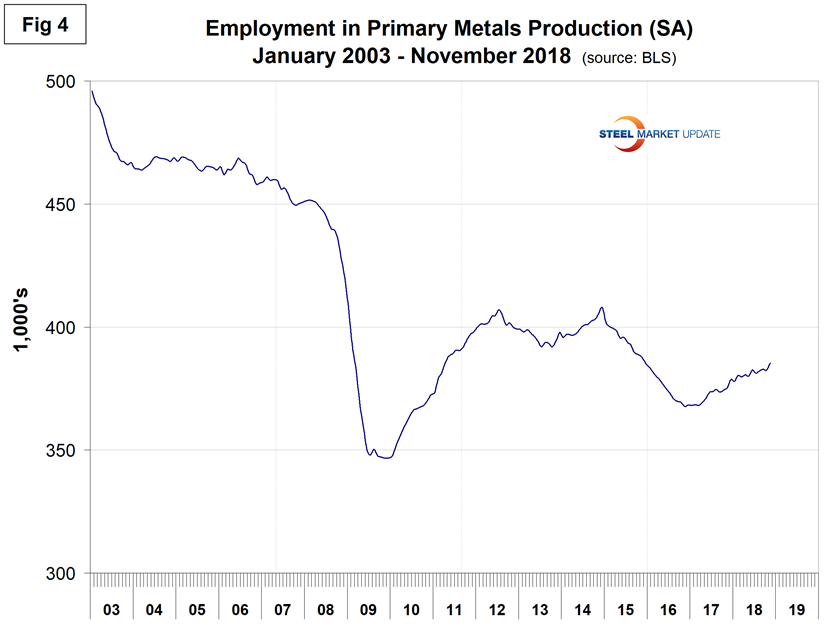
Table 1 shows that primary metals gained 2,800 jobs in November, and in the last 12 and 24 months, gains on a percentage basis were a little better than for total manufacturing. Figure 4 shows the history of primary metals employment since January 2003.
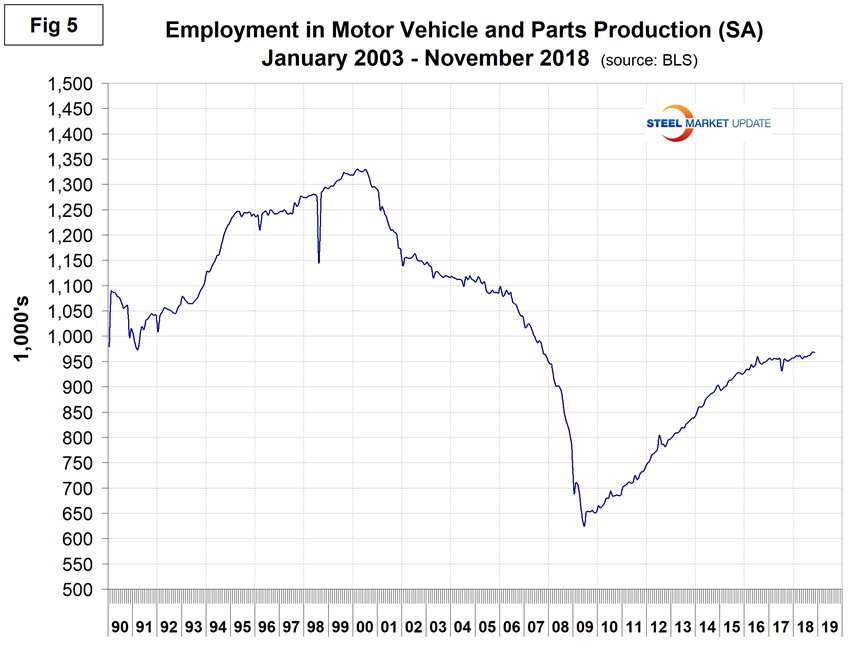
Motor vehicles and parts industries were reported to have lost 800 jobs in November after gaining 6,000 in October. Figure 5 shows the history of motor vehicles and parts employment. The flattening in the last two years is a reflection of U.S. light vehicle sales.
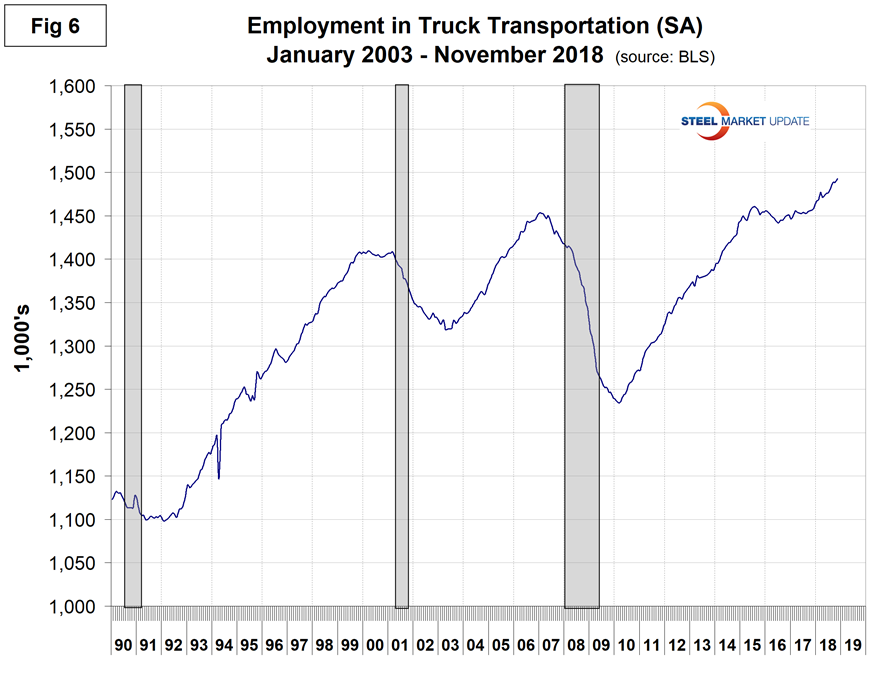
Trucking gained 2,500 jobs in November, for a total of 32,700 year to date. Employment in truck driving is one of SMU’s recession monitors and Figure 6 suggests that at the present time the economy is still on a roll.
SMU Comment: Manufacturing and construction have both had solid employment gains this year, which bodes well for steel consumption into next year.
Explanation: On the first Friday of each month, the Bureau of Labor Statistics releases the employment data for the previous month. Data is available at www.bls.gov. The BLS employment database is a reality check for other economic data streams such as manufacturing and construction. It is easy to drill down into the BLS database to obtain employment data for many subsectors of the economy. The important point about all these data streams is the direction in which they are headed.