

Market Data

January 7, 2019
BLS: Employment by Industry for December
Written by Peter Wright
Employment gains in manufacturing and construction were strong in December, as 301,000 jobs were created in the private sector and 11,000 in government, according to the latest Bureau of Labor Statistics data. Table 1 breaks total employment down into service and goods-producing industries and then into private and government employees. Most of the goods-producing employees work in manufacturing and construction, and the components of these two sectors of most relevance to steel people are broken out in Table 1.
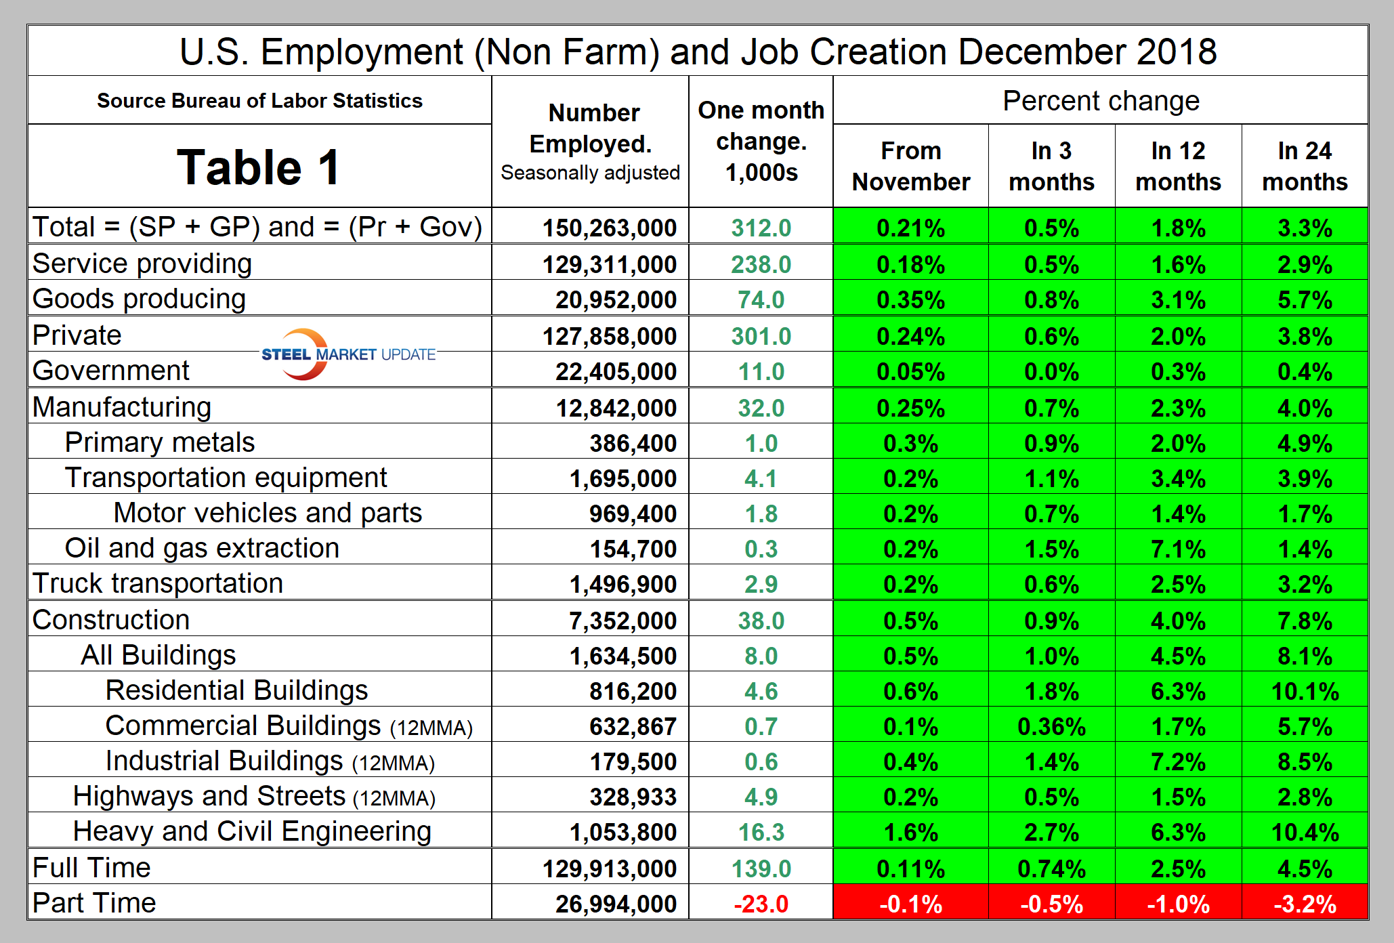
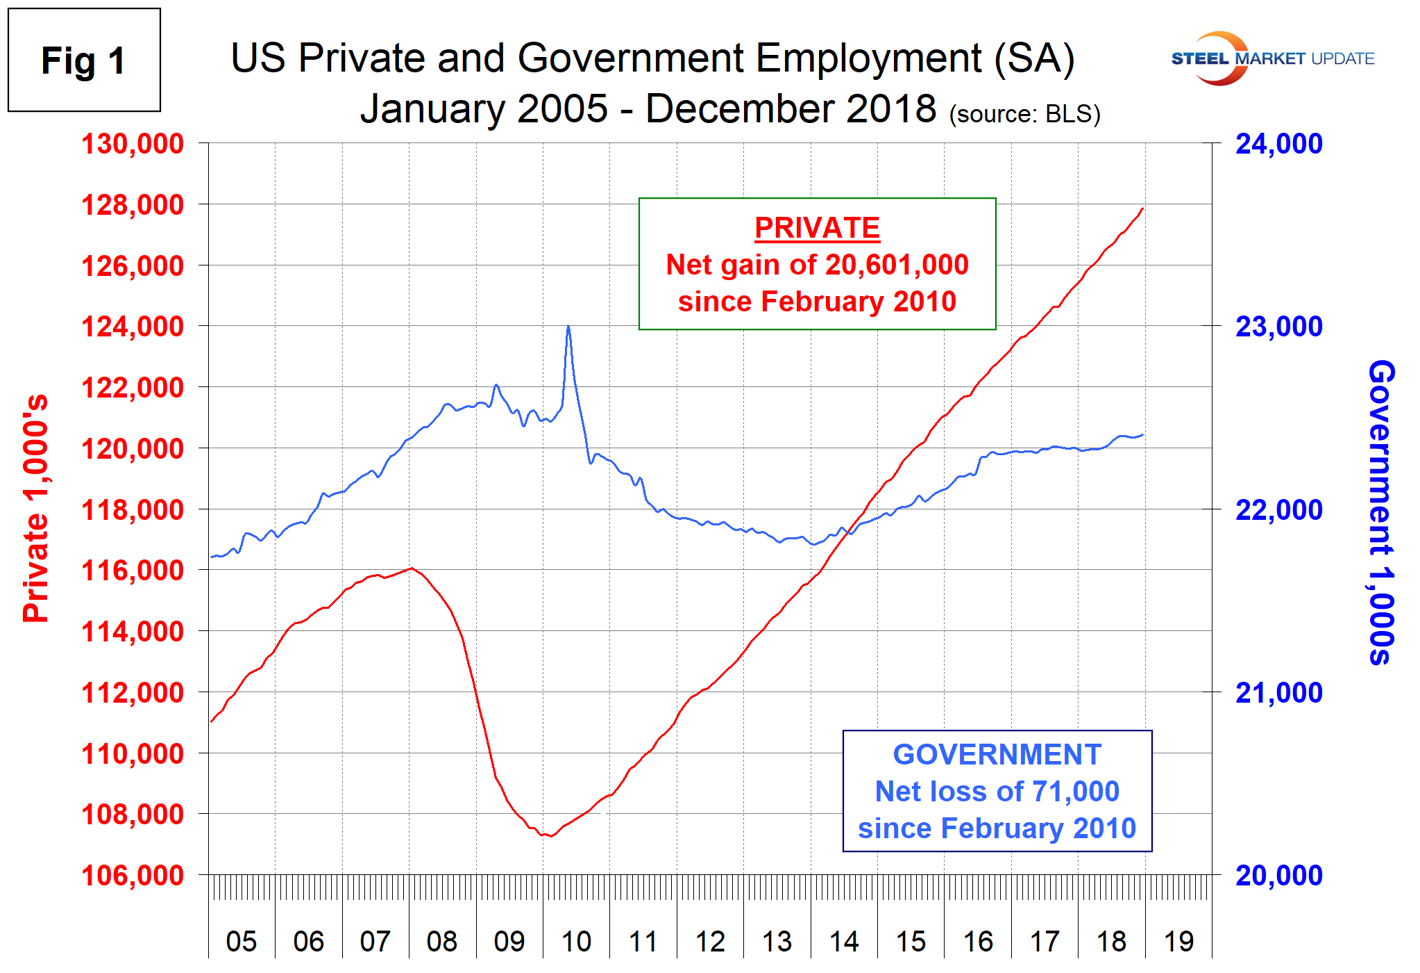
In December, the number employed by the federal government declined by 3,000, while state governments and local governments gained 5,000 and 9,000, respectively. Since February 2010, the low point of total nonfarm payrolls, private employers have added 20,601,000 jobs as government has lost 71,000 (Figure 1).
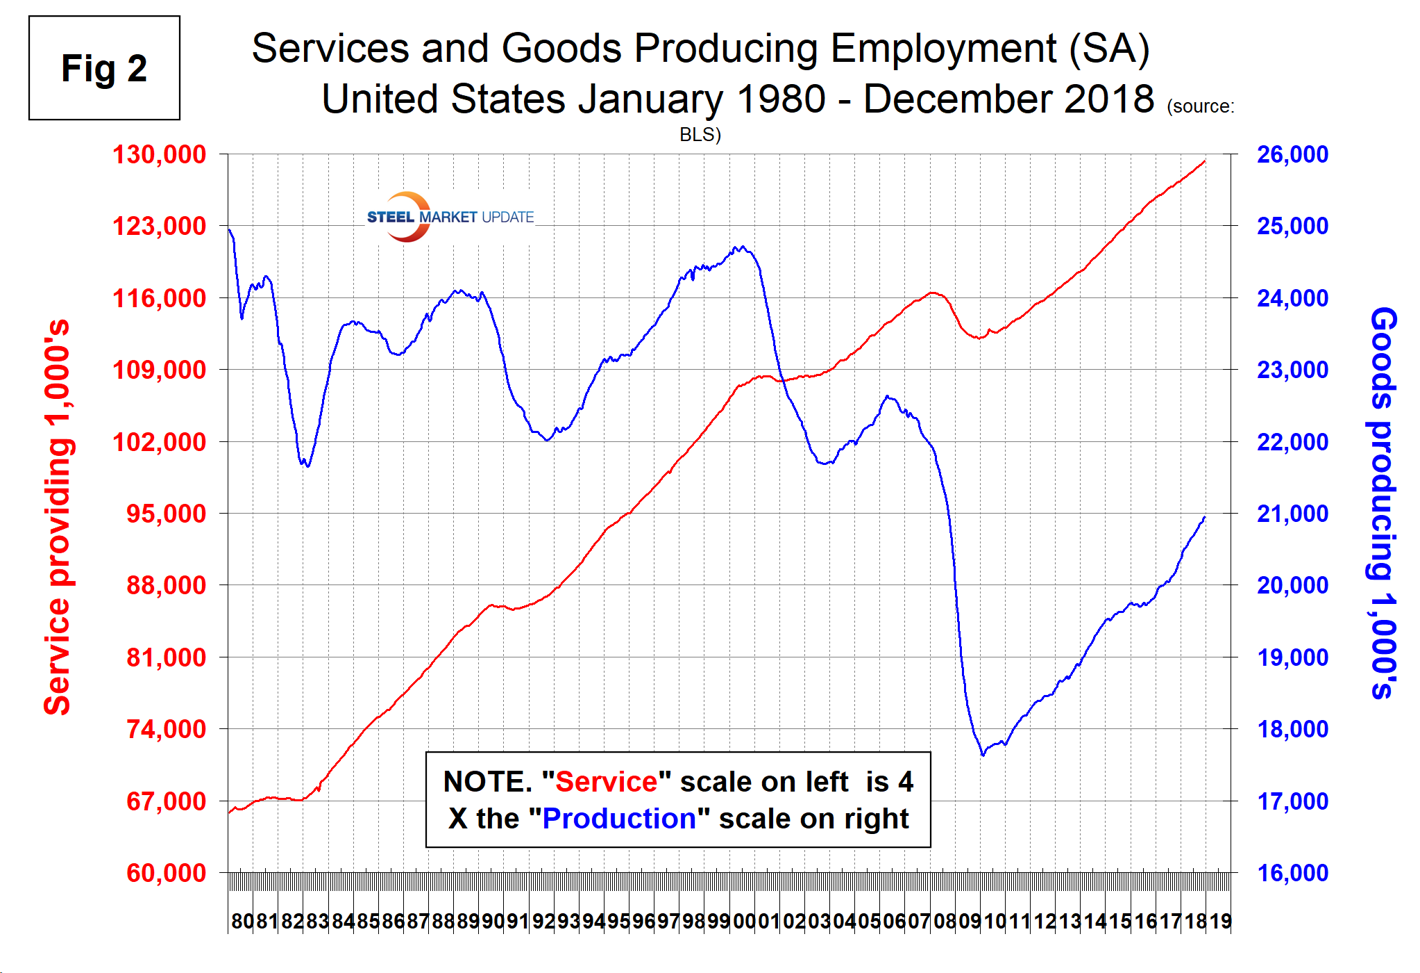
In December, service industries expanded by 238,000 as goods-producing industries, driven mainly by construction and manufacturing, expanded by 74,000 (Figure 2). Since February 2010, service industries have added 17,205,000 and goods-producing 3,325,000 positions. This has been a drag on wage growth since the recession as service industries on average pay less than goods-producing industries such as manufacturing. The good news is that in the last 24 months the rate of job creation in goods-producing industries on a percentage basis has been almost twice as great as in service industries.
Construction was reported to have gained 38,000 jobs in December for a total of 280,000 in 2018. According to the Associated General Contractors of America, the industry’s average pay accelerated and unemployment decreased to a historic low in 2018. According to the AGC’s annual outlook, released earlier this week, most contractors plan to continue hiring in 2019, but are having difficulty finding qualified workers. The number of unemployed workers who have construction experience is at the lowest December level in 19 years.
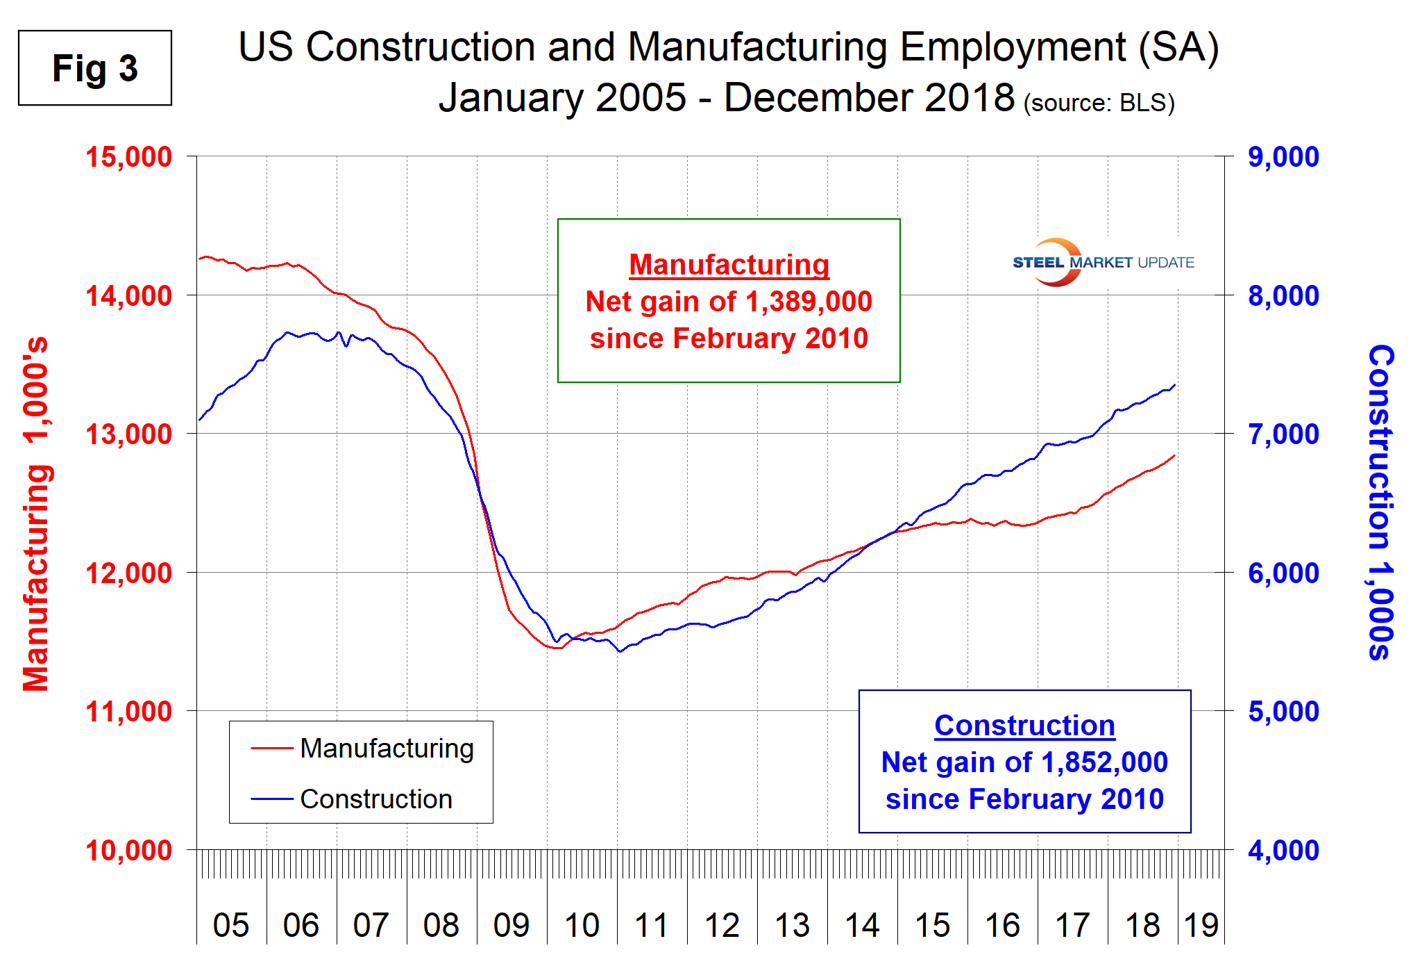
Manufacturing and construction are running neck and neck this year as job creators. Manufacturing gained 32,000 jobs in December making a total of 284,000 year to date. Figure 3 shows the history of construction and manufacturing employment since January 2005. Construction has added 1,852,000 jobs and manufacturing 1,389,000 since the recessionary employment low point in February 2010.
Note, the subcomponents of both manufacturing and construction shown in Table 1 don’t add up to the total because we have only included those with the most relevance to the steel industry.
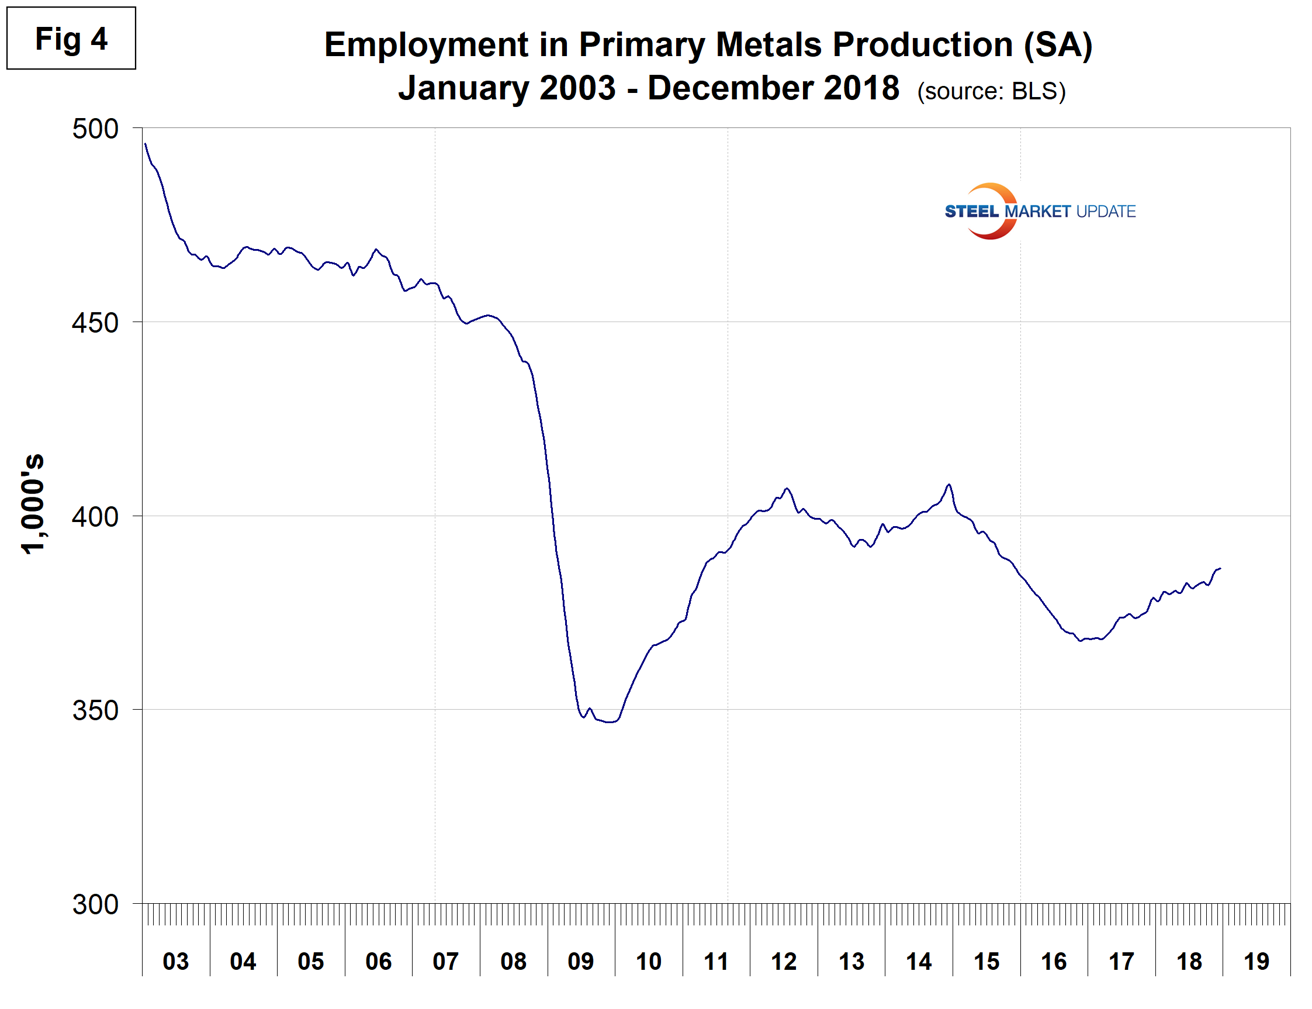
Table 1 shows that primary metals gained 1,000 jobs in December, and in the last 24 months, gains on a percentage basis were a little better than for total manufacturing. Figure 4 shows the history of primary metals employment since January 2003.
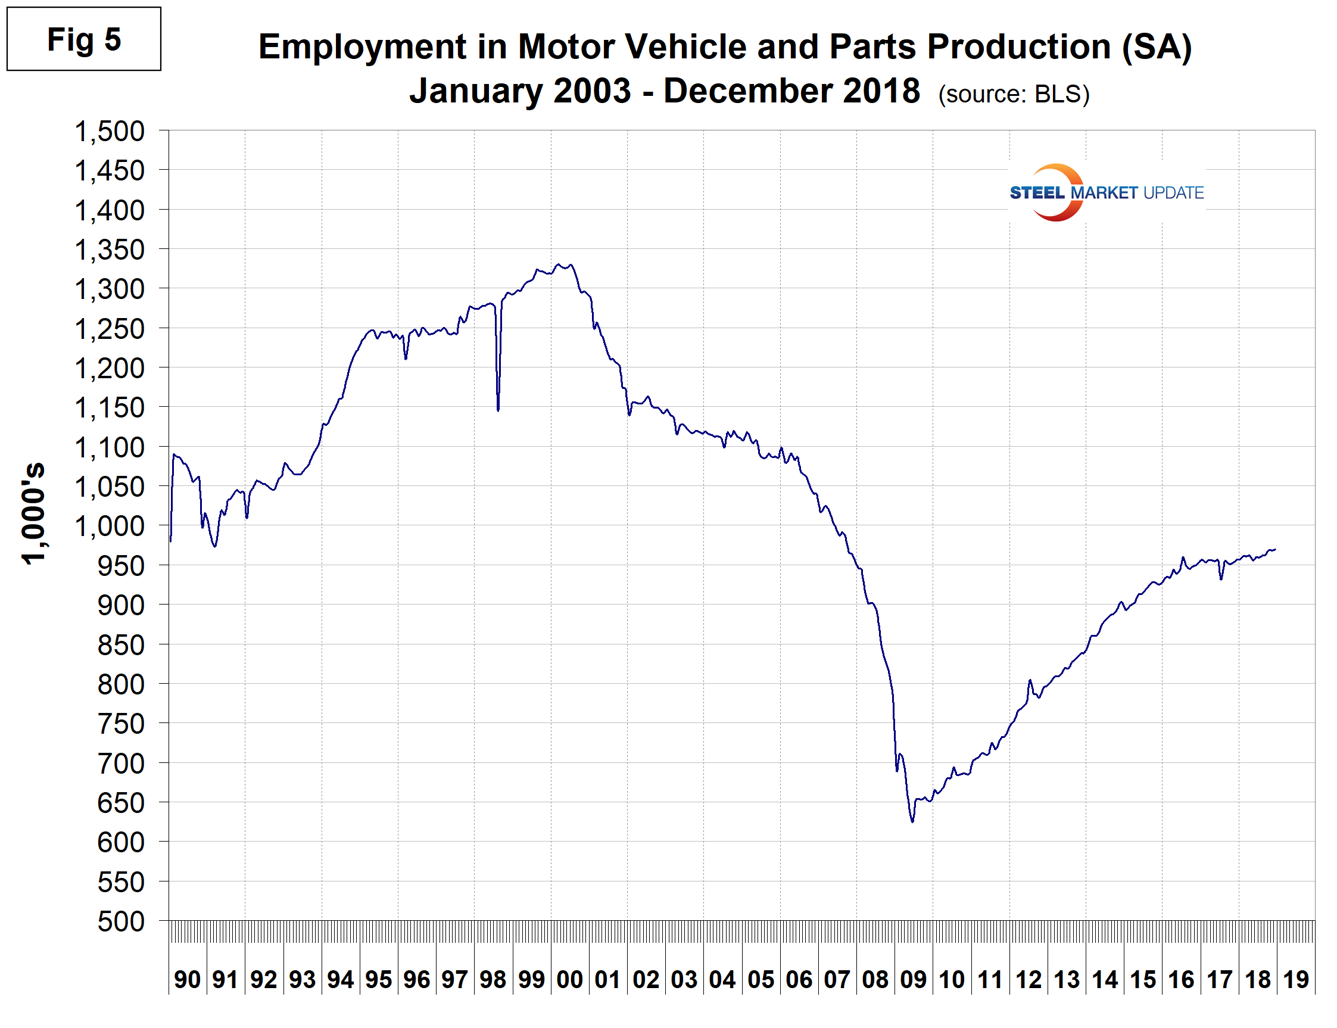
Motor vehicles and parts industries were reported to have gained 1,800 jobs in December after losing 1,400 in November. Figure 5 shows the history of motor vehicles and parts employment. The flattening in the last two years is a reflection of U.S. light vehicle sales.
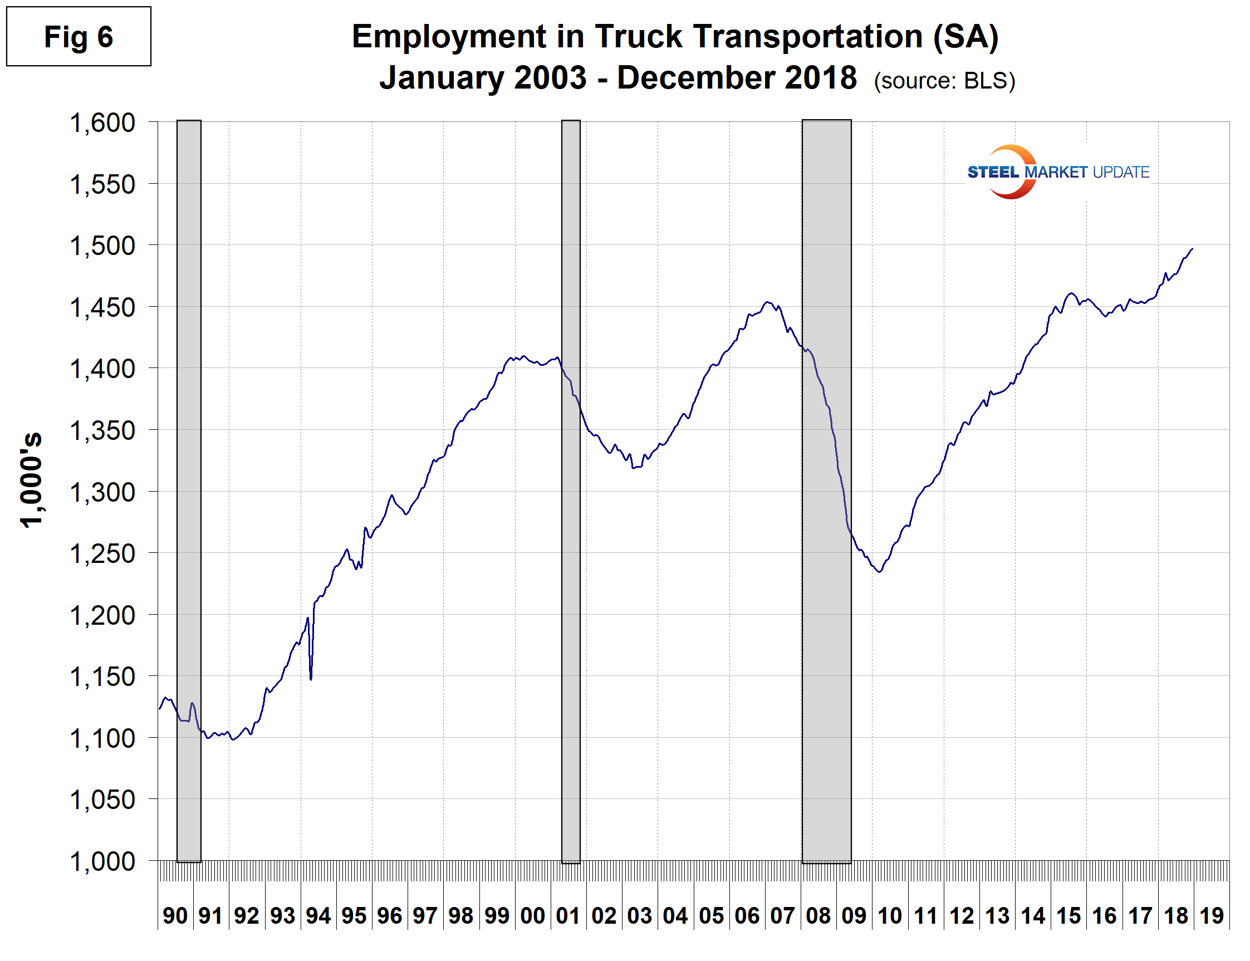
Trucking gained 2,900 jobs in December, for a total of 36,600 year to date. Employment in truck driving is one of SMU’s recession monitors and Figure 6 suggests that at the present time the economy is still on a roll.
SMU Comment: Manufacturing and construction had solid employment gains last year, which bodes well for steel consumption in at least the first few months of 2019.
Explanation: On the first Friday of each month, the Bureau of Labor Statistics releases the employment data for the previous month. Data is available at www.bls.gov. The BLS employment database is a reality check for other economic data streams such as manufacturing and construction. It is easy to drill down into the BLS database to obtain employment data for many subsectors of the economy. The important point about all these data streams is the direction in which they are headed.


