

Market Data

March 12, 2019
SMU Report: HR Imports by Product Detail Through December
Written by Peter Wright
Premium subscribers to Steel Market Update have reports available on our website that break out the import tonnage into district of entry and source nation for six sheet and plate categories. SMU has now developed reports that drill down the HRC and CRC into product detail both nationally and for each district.
Using U.S. International Trade Commission (USITC) data, SMU has taken the import tonnage of HRC and broken it down into sheet and strip, and whether it was in coil or leveled. Then it separates three gauge ranges, it identifies how much was P&O, how much was high strength and how much had patterns in relief.
Table 1 is a monthly summary and year-to-date 2018 for each of the above conditions.
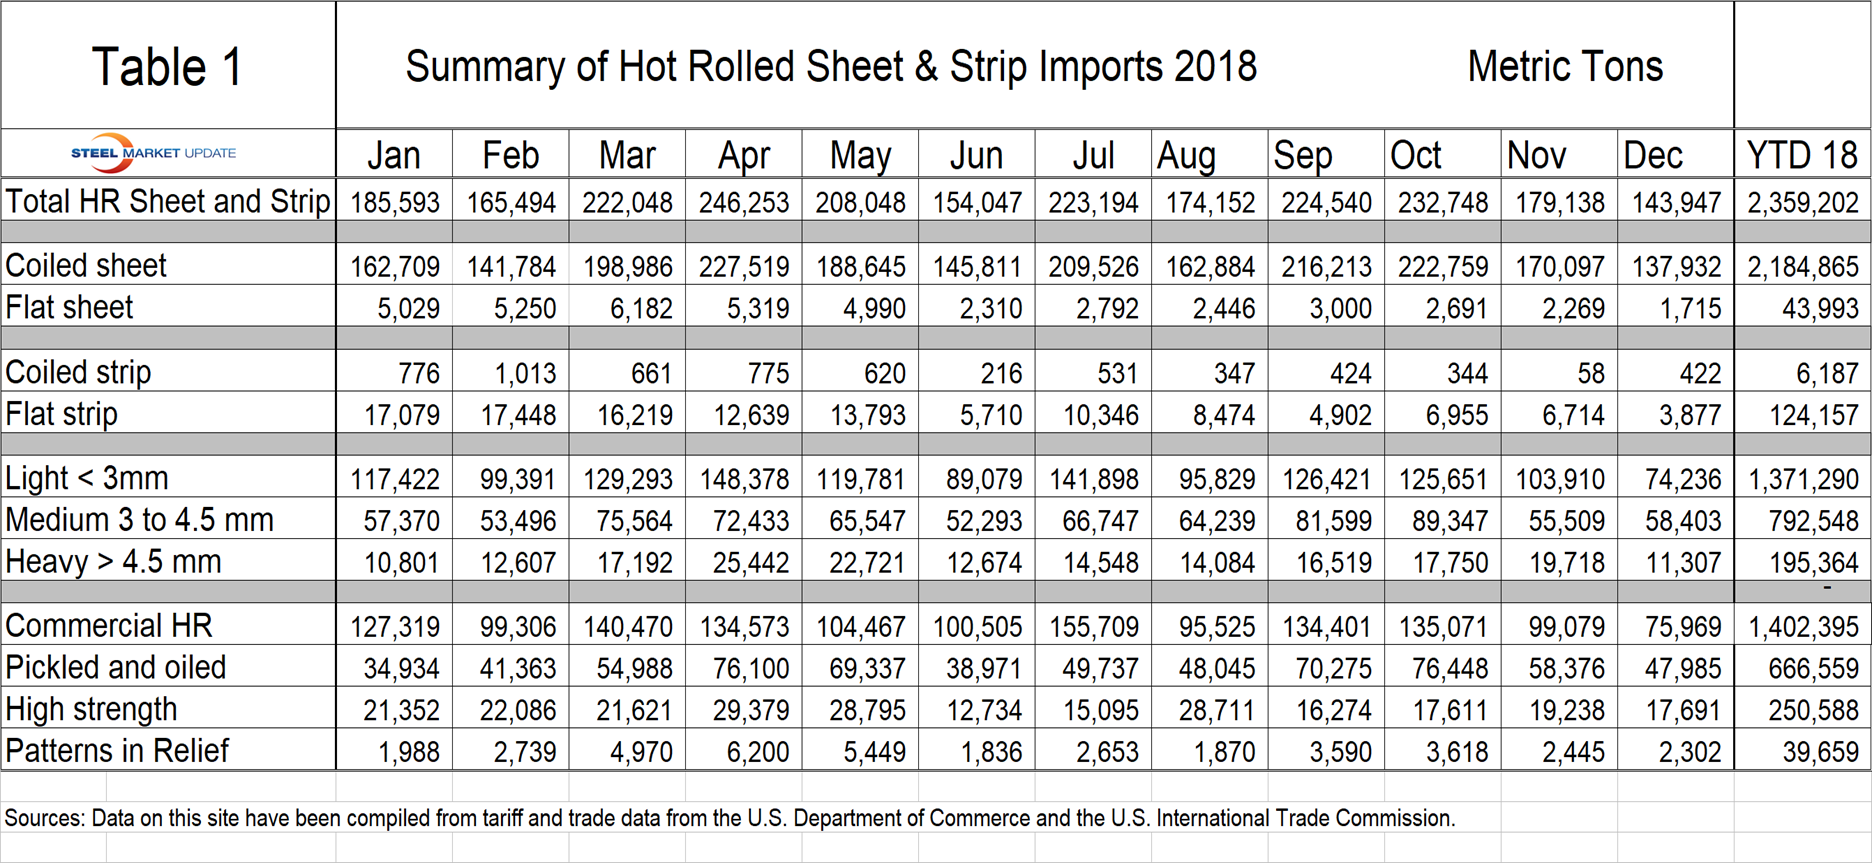
Figure 1 breaks the year-to-date tonnage down into commercial HR sheet, pickled and oiled, high strength and sheet with embossed patterns.
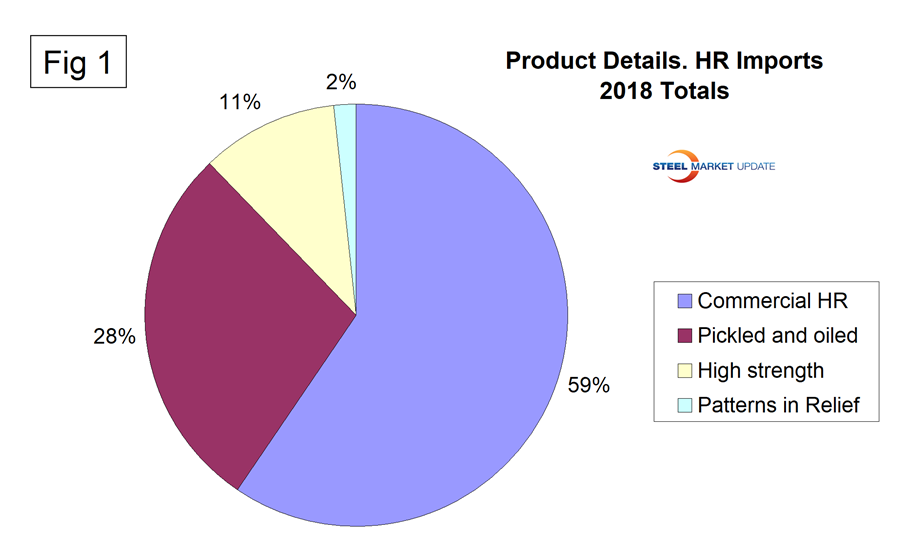
Figure 2 breaks the year-to-date tonnage down into three gauge ranges—light, medium and heavy.
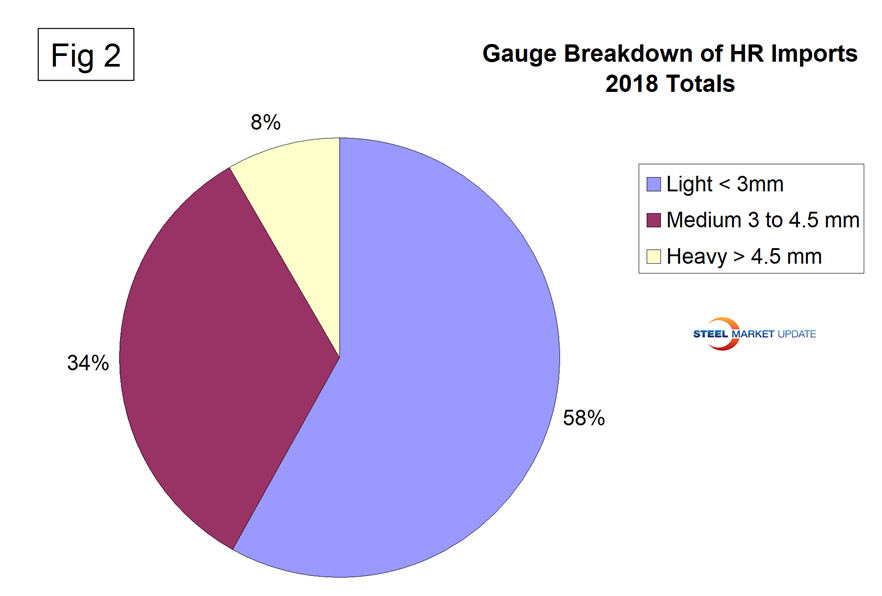
Figure 3 breaks hot rolled sheet imports into coiled and leveled tonnage.
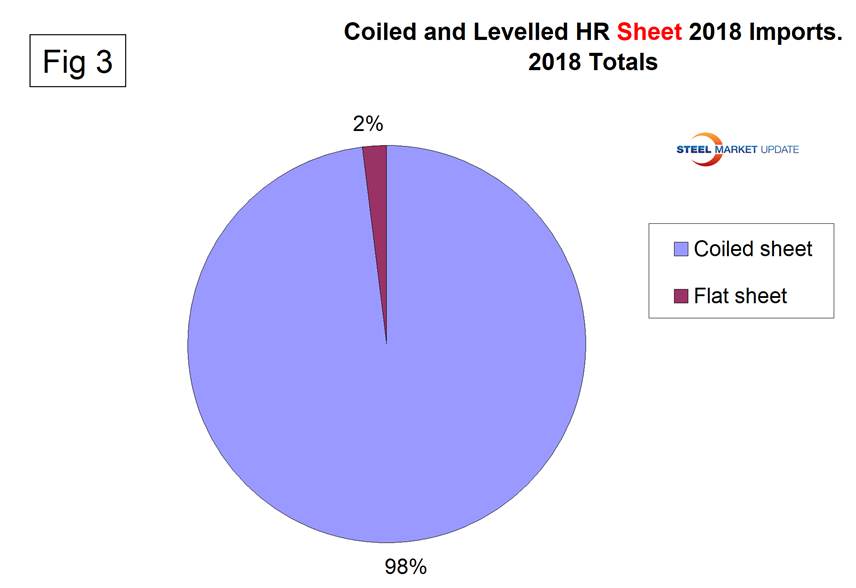
Figure 4 breaks hot rolled strip imports into coiled and leveled tonnage.
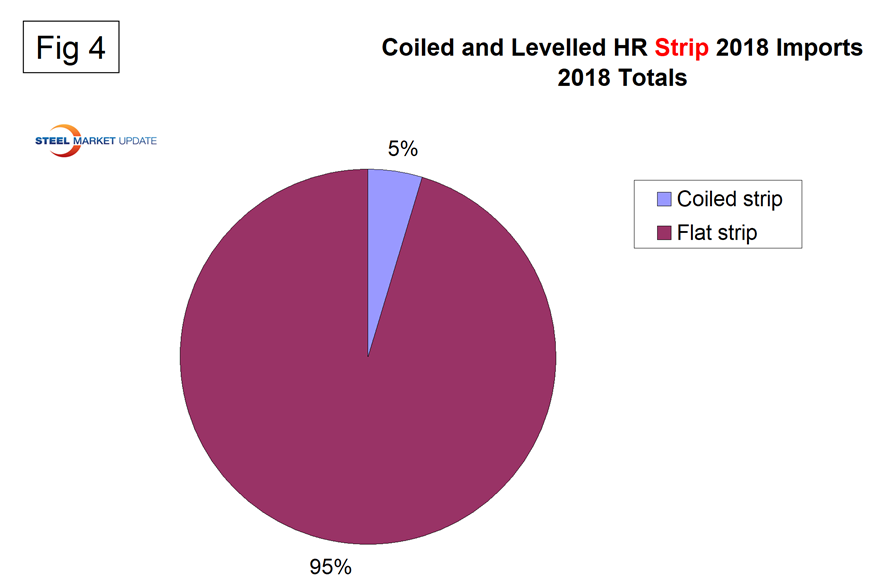
Table 2 is a small part of a sheet that shows detail for every region in the U.S. and is available here for download. It shows the product detail of hot rolled sheet and strip imports by district of entry. For example, almost half the tonnage entering Boston was light gauge, high-strength pickled and oiled. To cite another example, if a steel buyer wanted to know how much medium-gauge, high-strength, not pickled and oiled sheet had come into Buffalo year to date, the answer is 3,526 metric tons, and the volume of that product entered in August through December was zero.
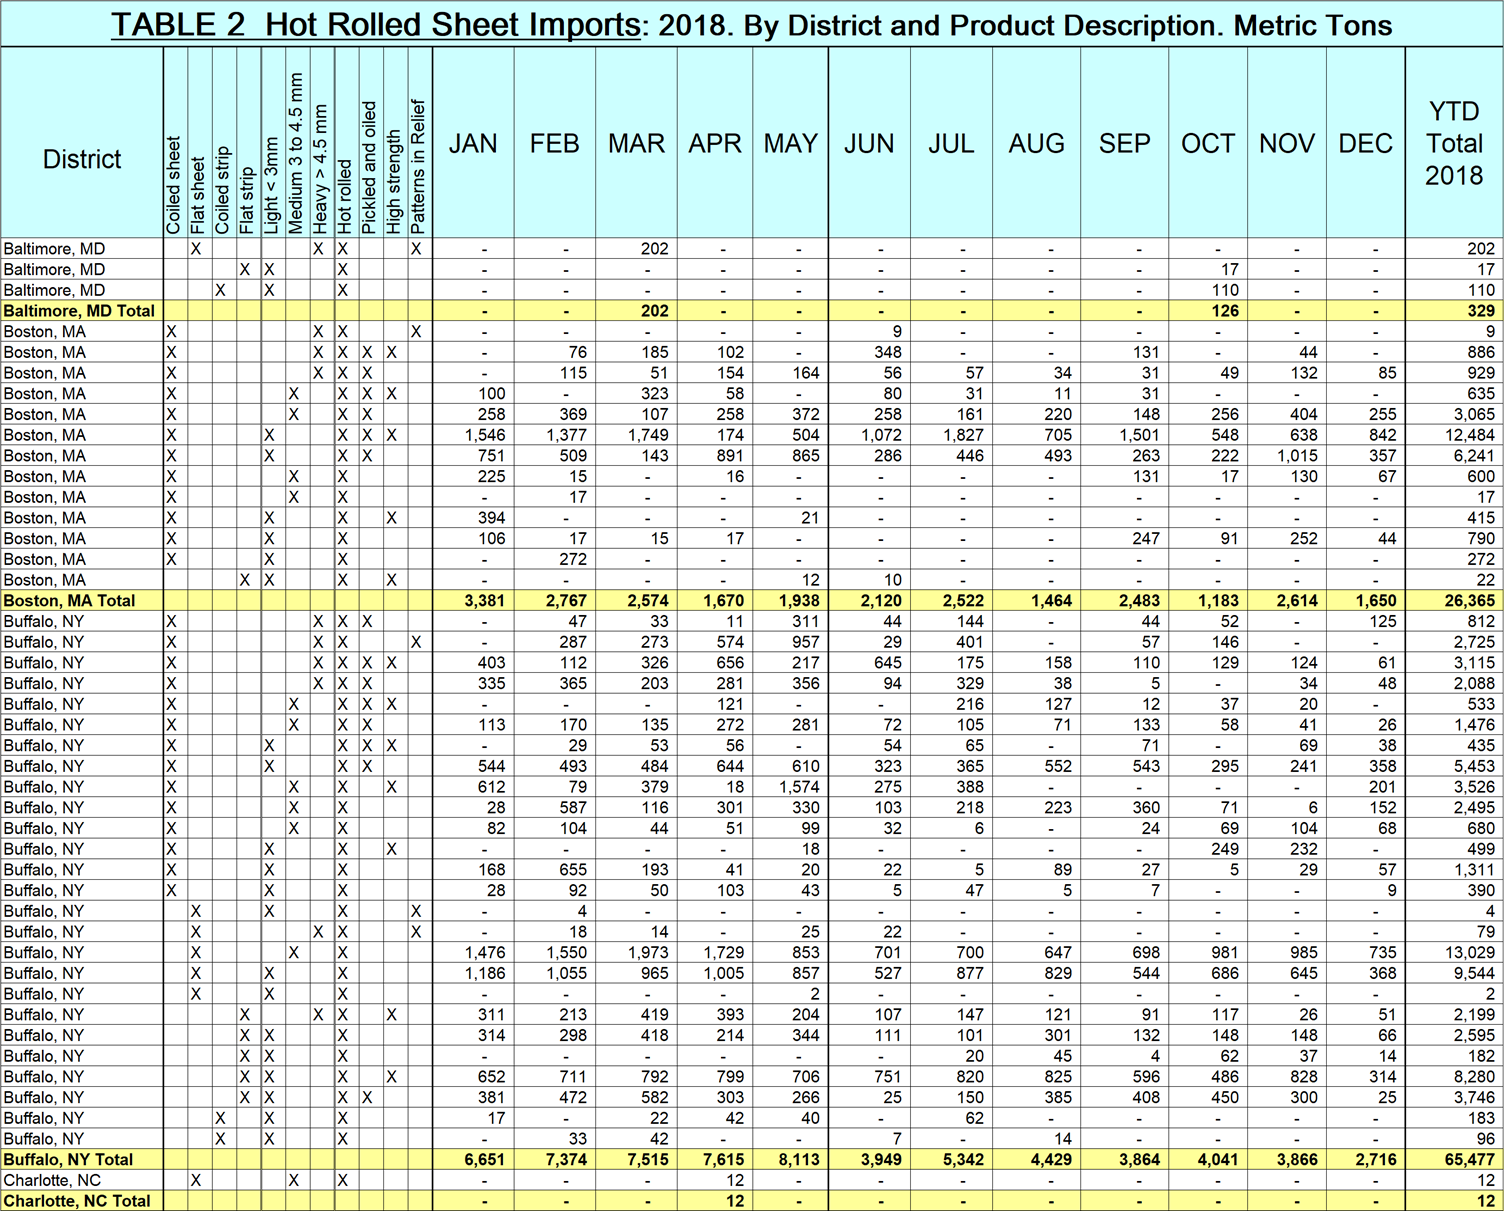
Using the combination of SMU import reports, steel buyers know exactly how much hot rolled came into their region, where it came from, the tonnage by gauge, how much was pickled and oiled, how much was high strength and how much had patterns in relief.
Note: This data was accessed through the USITC database. All steel traded globally is classified by the Harmonized Tariff System (HTS). The HTS code has 10 digits. The first six are globally universal. The last four are used at the discretion of the nations involved in a particular transaction and are the basis of this report. The way the U.S. uses the last four digits to define products may be different from other nations’ product classification.


