

Market Data

September 26, 2019
Steel Mill Lead Times: Still Shortening
Written by Tim Triplett
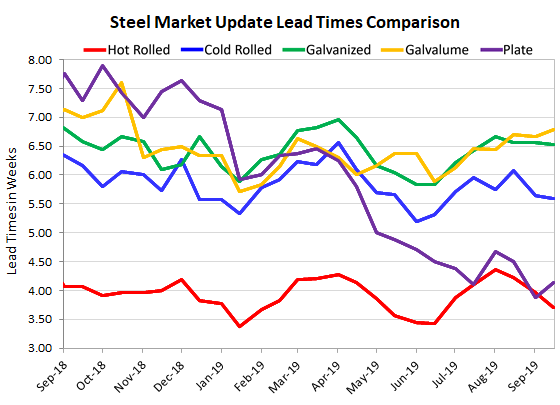
Mill lead times for most flat rolled steel products continue to see a slight shortening, according to the latest Steel Market Update data. Lead times for steel delivery are a measure of demand at the mill level. The shorter the lead time, the less busy the mills, and the more likely they are to discount prices.
The average lead time for hot rolled is now less than four weeks, cold rolled is about five and a half weeks and coated steels are around six and a half weeks. Plate lead times are now around four weeks. All are shorter than at this time last year.
Hot rolled lead times now average 3.71 weeks, shortened from 4.22 weeks at this time last month. The average cold rolled lead time has dipped slightly to 5.59 weeks from 6.07 weeks in mid-August. The average lead time for galvanized has dipped to 6.52 from 6.57 weeks, while the lead time for spot orders of Galvalume is up slightly at 6.78 weeks.
Lead times for spot orders of plate steel have also declined over the past month to an average of 4.13 from 4.50 weeks.
“Lead times are a mixed bag,” said one buyer. “SDI is longer, but most other mills are shorter. Go figure.” Added another executive, “HR is shorter, but coated is holding up fairly well, particularly for construction lines.”
Note: These lead times are based on the average from manufacturers and steel service centers who participated in this week’s SMU market trends analysis. Our lead times do not predict what any individual may get from any specific mill supplier. Look to your mill rep for actual lead times. Our lead times are meant only to identify trends and changes in the marketplace. To see an interactive history of our Steel Mill Lead Times data, visit our website here.


