

Market Data

October 23, 2019
Currency Update for Steel Trading Nations
Written by Peter Wright
The U.S. dollar has strengthened against 12 of the 16 steel trading nation currencies in the last three months and against eight in the last month.
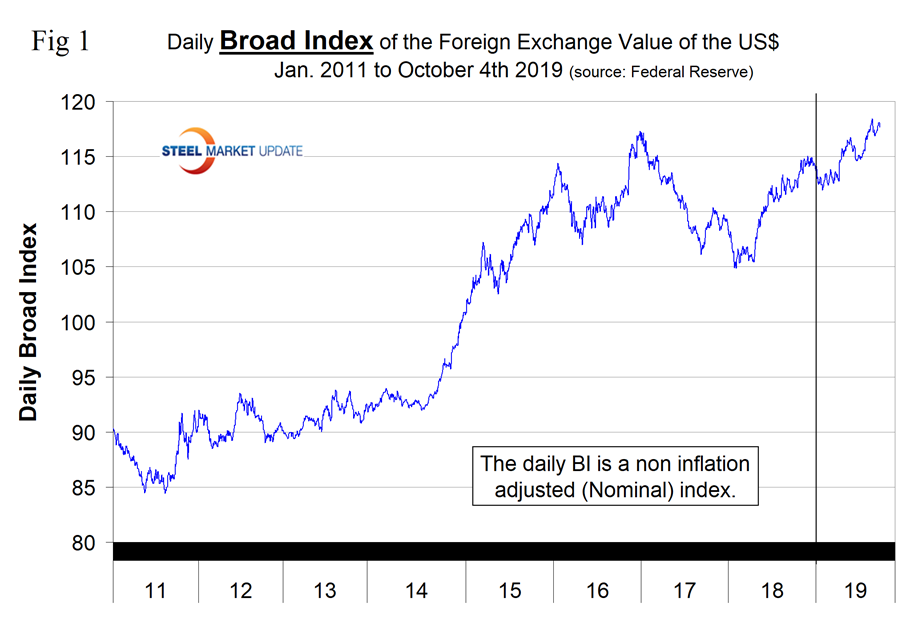
In this report we examine the change in currency values of the 16 preeminent global steel and iron ore trading nations. The currencies of these 16 don’t necessarily follow the Broad Index value of the U.S, dollar. In fact, at any given time, some are always moving in the opposite direction. The latest value of the Broad Index as published by the Federal Reserve was Oct. 4. In three months prior to that date, the dollar had strengthened by 2.1 percent and by 0.5 percent in the previous 30 days.
![]()
Figure 1 plots the daily Broad Index (BI) value of the U.S. dollar since 2011. After declining in January and February this year, the dollar resumed its upward trajectory through the latest data and has appreciated by 2.0 percent in the last three months and by 0.1 percent in the last month. The BI is now higher than its recent peak of Dec. 28, 2016.
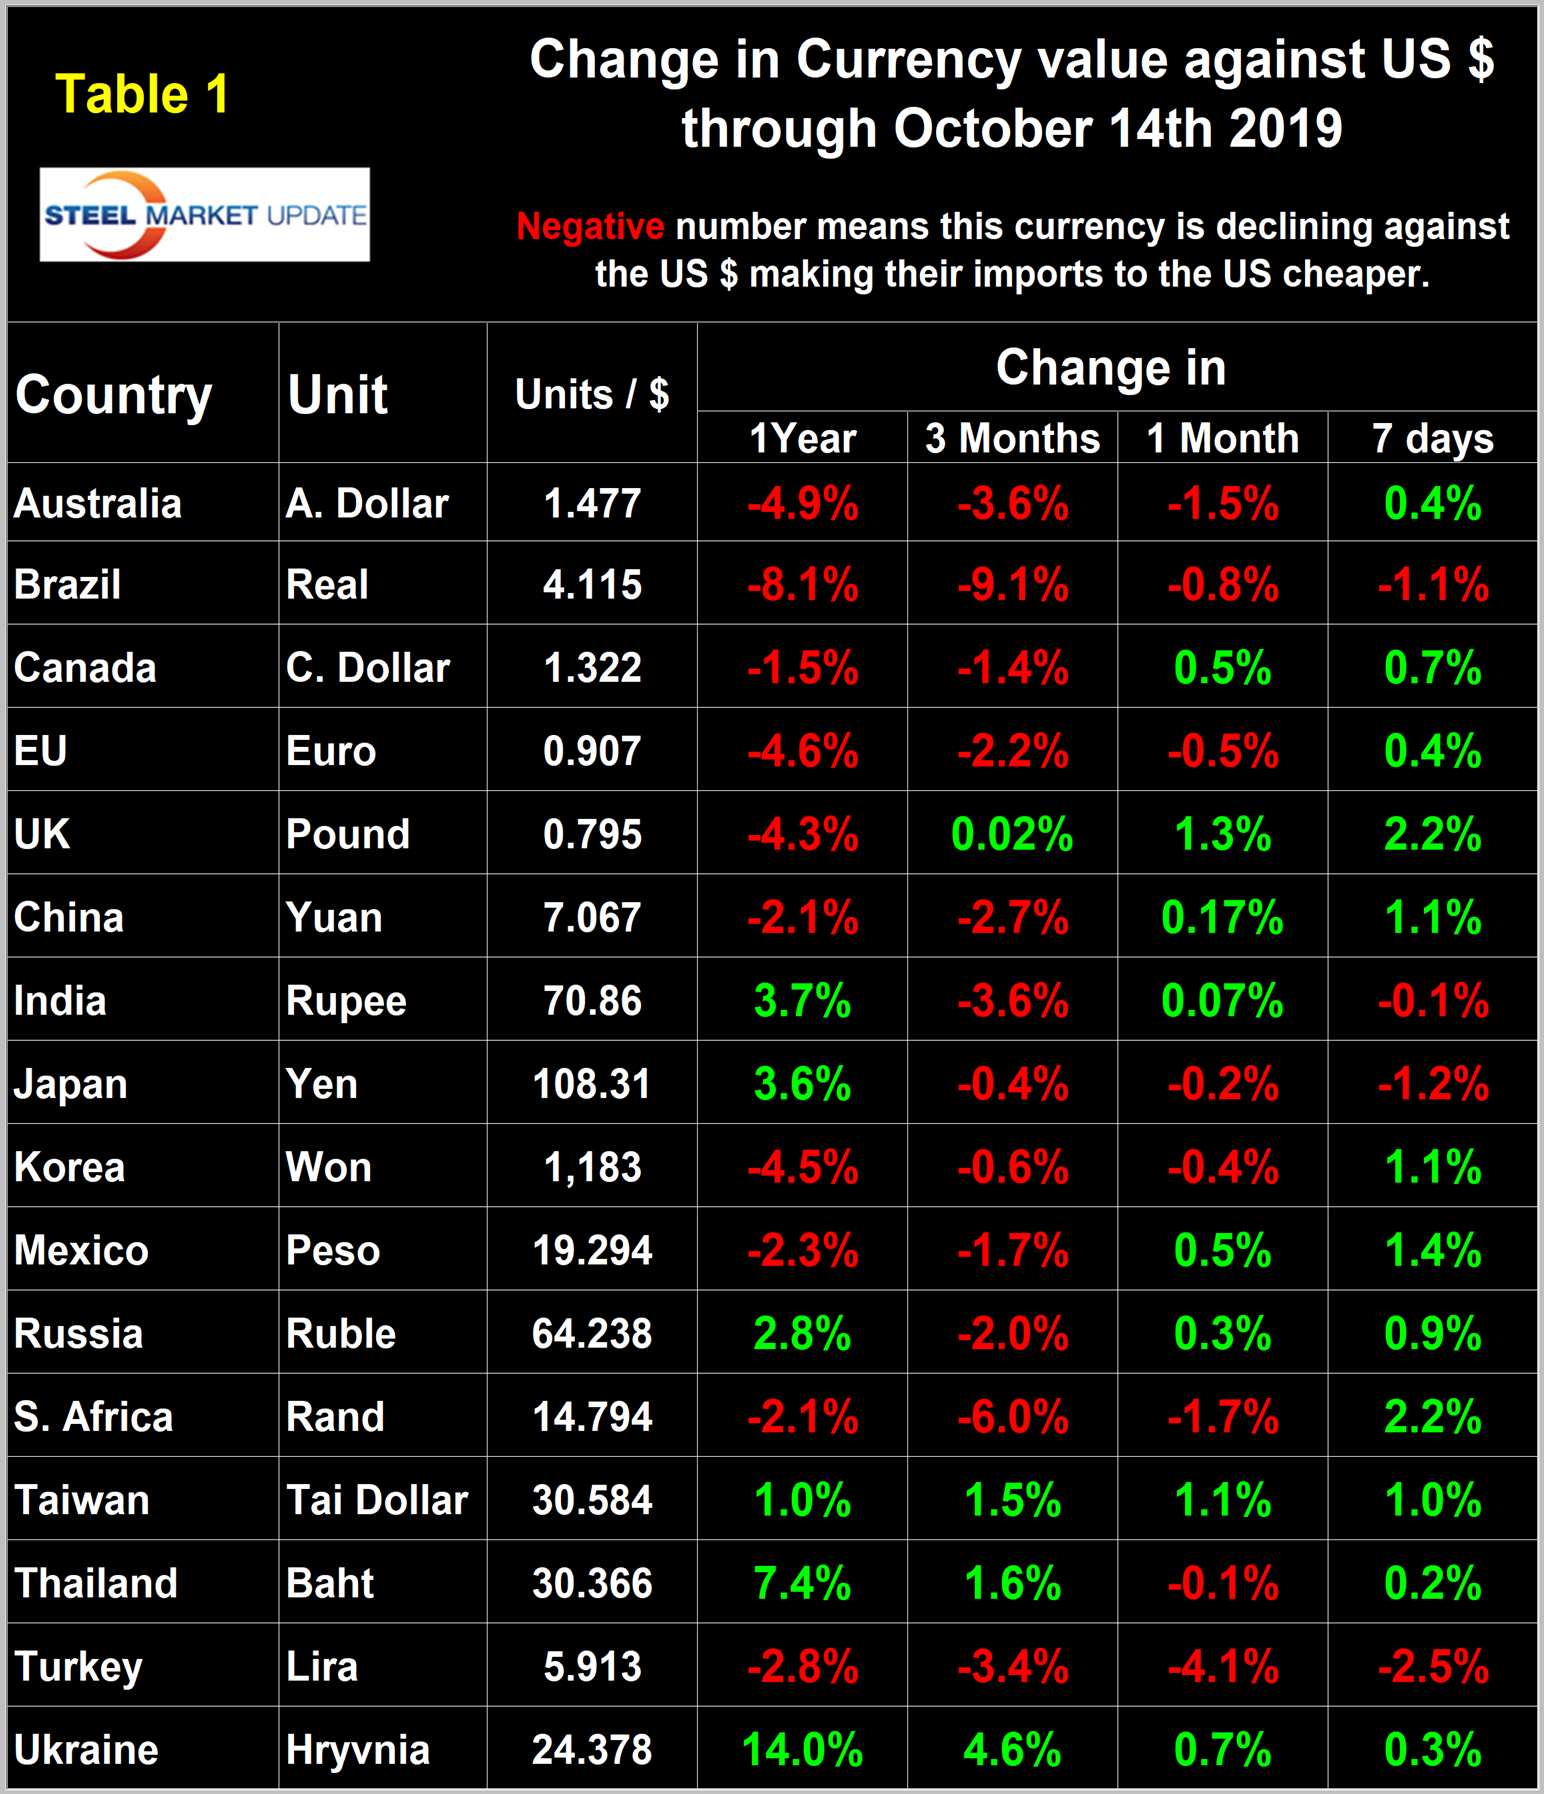
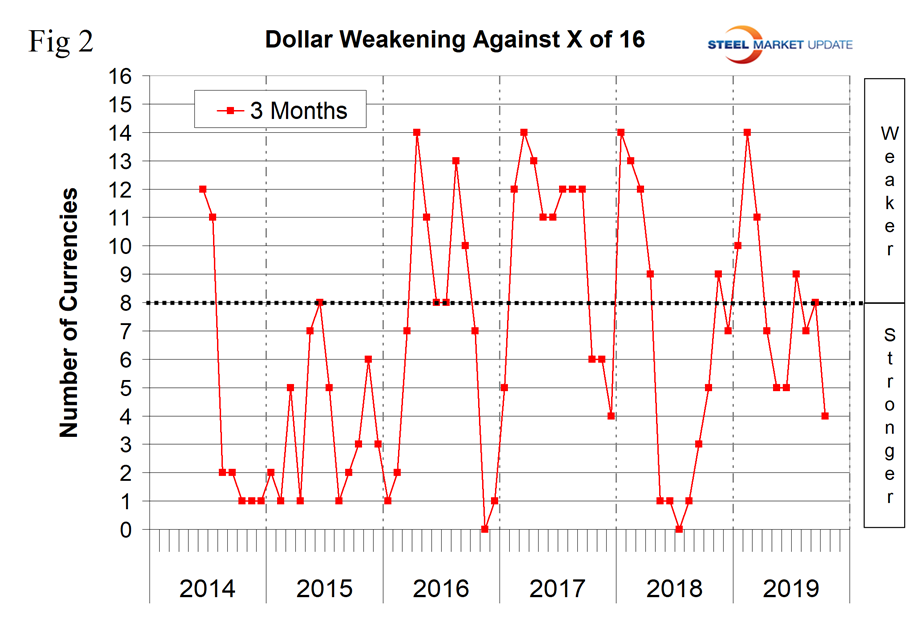
Steel Market Update tracks the currencies of 16 steel trading nations. Table 1 shows the number of currency units that it takes to buy one U.S. dollar and the percentage change in the last year, three months, one month and seven days. The overall picture for the steel trading nations is that in the last year the U.S. dollar has strengthened against 10 of the 16. In the last three months, the dollar has strengthened against 12. In the last month, the dollar has strengthened against eight of the 16 and weakened against the other eight. Table 1 is color coded to indicate weakening of the dollar in green and strengthening in red. We regard strengthening of the U.S. dollar as negative and weakening as positive because of the effect on net imports. Figure 2 shows the extreme gyrations that have occurred at the three-month levels in the last four years.
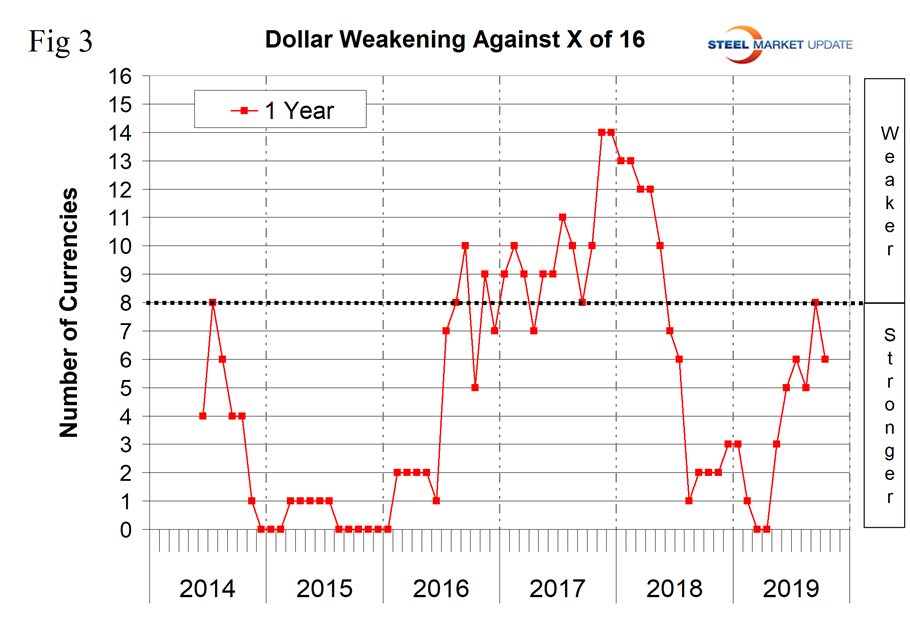
To try to get a less volatile look at the changes in value of the 16 currencies under examination here, we have developed Figure 3. This shows the number of currencies against which the dollar was weakening on a year-over-year basis. In March and April, the dollar was strengthening against all 16; by October it was only strengthening against 10. This is a different picture from that of the Broad Index described above and illustrates the value of this SMU report. It is clear that to accept the Broad Index at face value does not accurately characterize the steel story.
Big movers in the last three months have been Australia, down 3.6 percent; Brazil, down by 9.1 percent; China, down 2.7 percent; India, down 3.8 percent; and South Africa, down 6.0 percent. We present long-term charts of the value of these five currencies against the dollar below. (See the end of this report for details of data sources.)
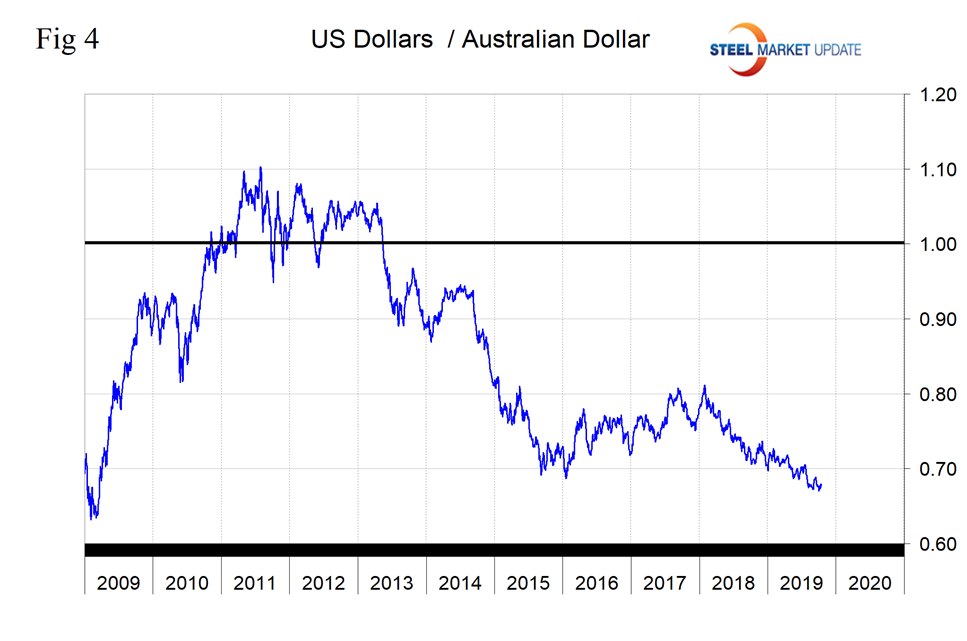
The Australian Dollar
Australia’s dollar has declined by 3.6 percent in the last three months and by 1.5 percent in the last month. The Australian dollar is now worth 68 U.S. cents.
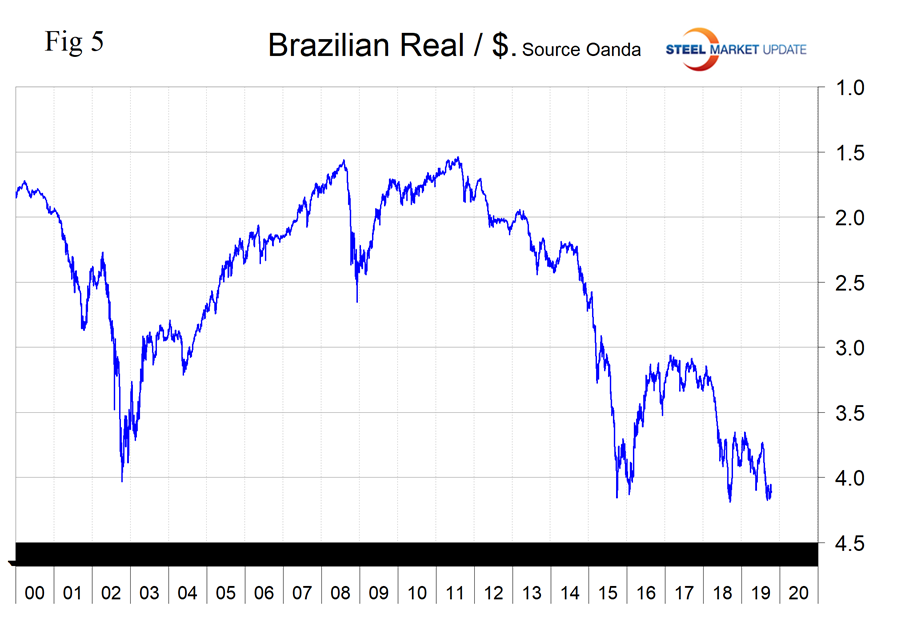
The Brazilian Real
Brazil’s real has declined by 9.1 percent in the last three months and has been relatively stable in the last month. The U.S. dollar is now worth 4.12 real.
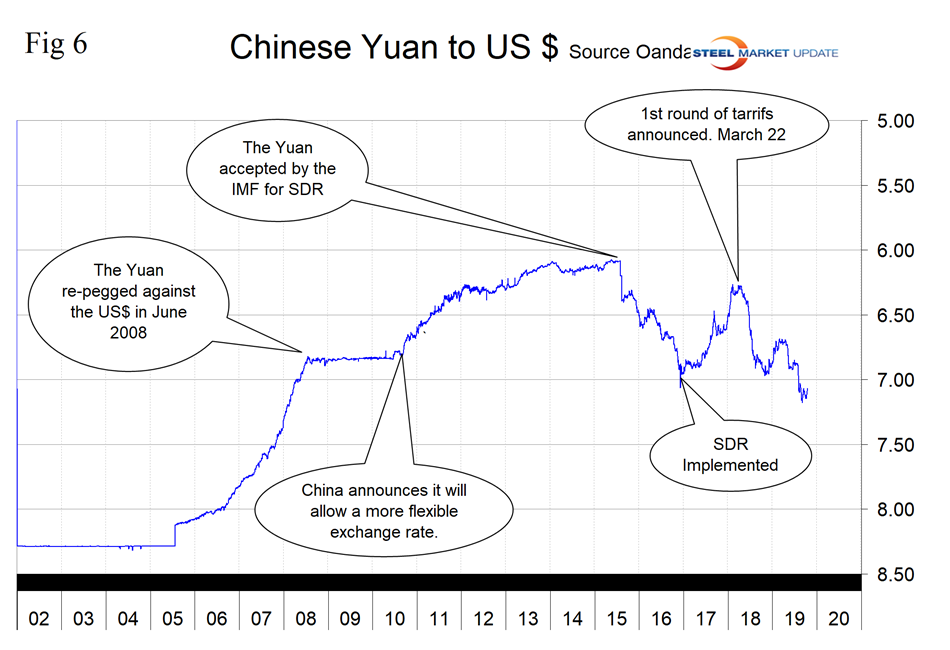
The Chinese Yuan
China’s yuan has declined by 2.7 percent in the last three months and has also been stable in the last month. The U.S. dollar is now worth 7.08 yuan. The yuan has declined by 10.1 percent since the first round of tariffs were announced on March 22 last year.
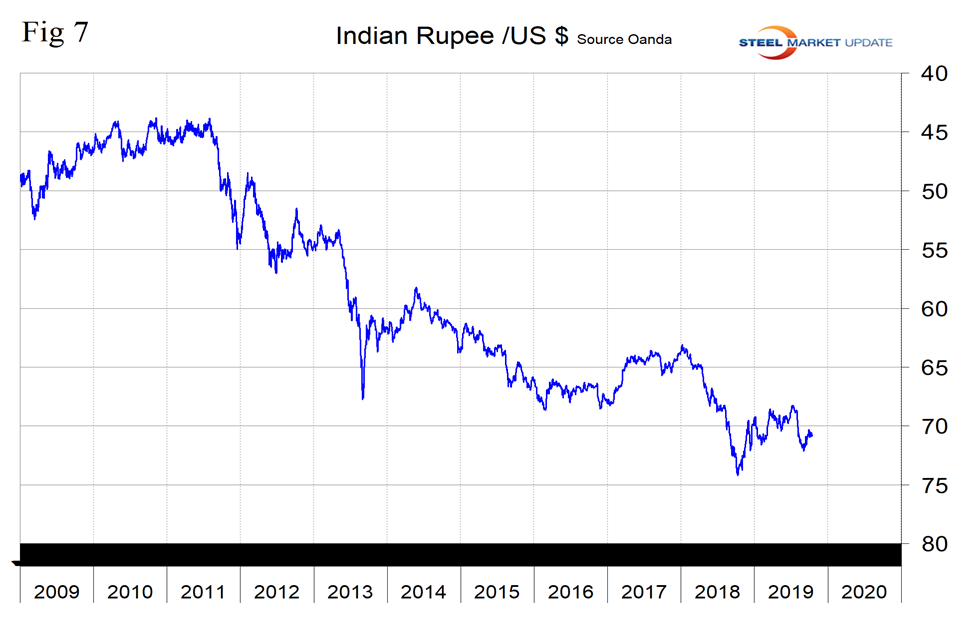
The Indian Rupee
India’s rupee has declined by 3.6 percent in the last three months and has been stable in the last month. The U.S. dollar is now worth 70.86 rupees.
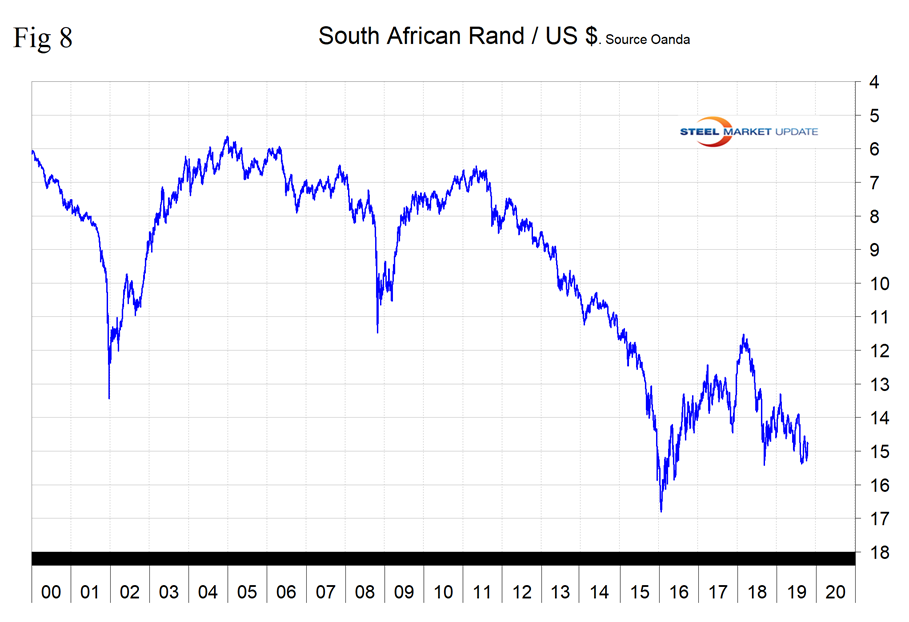
The South African Rand
South Africa’s rand has declined by 6.0 percent in the last three months and by 1.7 percent in the last month. The U.S. dollar is now worth 14.79 rand.
In this monthly analysis we show the trends we think have the most immediate significance, but all 16 steel trading nation graphs are available on request.
Explanation of Data Sources: The Broad Index is published by the Federal Reserve on both a daily and monthly basis. It is a weighted average of the foreign exchange values of the U.S. dollar against the currencies of a large group of major U.S. trading partners. The index weights, which change over time, are derived from U.S. export shares and from U.S. and foreign import shares. The data are noon buying rates in New York for cable transfers payable in the listed currencies. At SMU we use the historical exchange rates published in the Oanda Forex trading platform to track the currency value of the U.S. dollar against that of 16 steel trading nations. Oanda operates within the guidelines of six major regulatory authorities around the world and provides access to over 70 currency pairs. Approximately $4 trillion U.S. dollars are traded every day on foreign exchange markets.


