

Market Data
December 23, 2019
SMU Steel Buyers Sentiment Index: Market Pauses
Written by Tim Triplett
Steel buyers sentiment has seen little change in the past several weeks as the market pauses to digest the latest price increases and looks ahead to the beginning of the new year.
The goal of the index is to measure how buyers and sellers of steel feel about their company’s ability to be successful today (Current Sentiment Index), as well as three to six months into the future (Future Sentiment Index). Results from SMU’s market trends questionnaire this week are posted as both single data points and as three-month moving averages (3MMAs) to smooth out the trend.
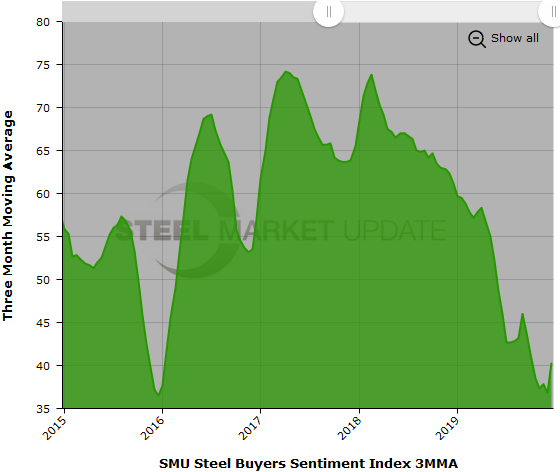
As a single data point the Current Sentiment reading of +50 is up four points from two weeks ago, and 24 points higher than in early October when the index hit its lowest point since June 2013. Measured as a 3MMA, Current Sentiment is at +40.33, an improvement from the recent four-year low of +38.50, but still well below the +61.17 3MMA at this time in 2018.
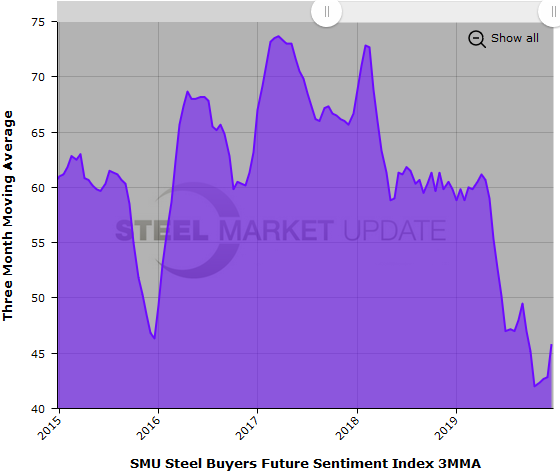
Future Sentiment
Future Sentiment as a single data point registered +49 in the latest data, down three points in the past two weeks. The Future Sentiment 3MMA is +45.83, showing a small improvement since early December, but still well below the 3MMA of +59.83 in December 2018.
All the current readings are above zero and on the optimistic half of SMU’s scale, therefore more positive than negative, but they have a way to go to return to the levels of optimism achieved last year.
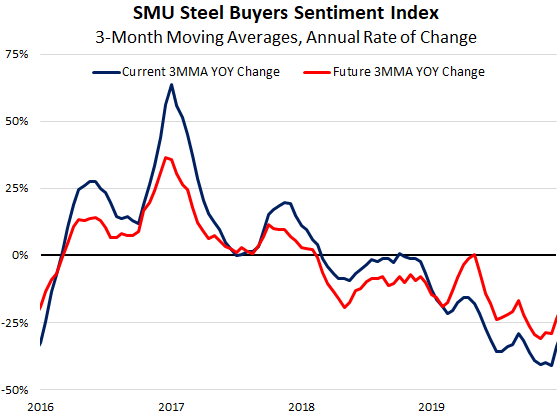
Except for the modest upturn in recent months, steel buyers sentiment has been trending downhill since 2017, as shown by the chart below tracking the annual rate of change in the three-month moving averages.
What Respondents Had to Say
“We’re very concerned that selling prices will never get above replacement cost before prices sink again.” Service Center
“We will deal with the price roller coaster, but the fundamentals are being skewed by artificial tariffs on imports of steel and aluminum driving up U.S. manufacturing costs, which will hurt all in the end.” Trading Company
About the SMU Steel Buyers Sentiment Index
SMU Steel Buyers Sentiment Index is a measurement of the current attitude of buyers and sellers of flat rolled steel products in North America regarding how they feel about their company’s opportunity for success in today’s market. It is a proprietary product developed by Steel Market Update for the North American steel industry.
Positive readings will run from +10 to +100 and the arrow will point to the righthand side of the meter located on the Home Page of our website indicating a positive or optimistic sentiment. Negative readings will run from -10 to -100 and the arrow will point to the lefthand side of the meter on our website indicating negative or pessimistic sentiment. A reading of “0” (+/- 10) indicates a neutral sentiment (or slightly optimistic or pessimistic), which is most likely an indicator of a shift occurring in the marketplace.
Readings are developed through Steel Market Update market surveys that are conducted twice per month. We display the index reading on a meter on the Home Page of our website for all to see. Currently, we send invitations to participate in our survey to more than 500 North American companies. Our normal response rate is approximately 110-150 companies. Of those responding to this week’s survey, 39 percent were manufacturers and 42 percent were service centers/distributors. The balance was made up of steel mills, trading companies and toll processors involved in the steel business. Click here to view an interactive graphic of the SMU Steel Buyers Sentiment Index or the SMU Future Steel Buyers Sentiment Index.


