

Market Data
January 13, 2020
SMU Recession Monitor: Indicators Remain Positive
Written by Peter Wright
Indicators of economic activity through Jan. 10 data do not predict an imminent U.S. recession.
In this report, we have identified eight indicators that have some predictive ability about the short-term likelihood of a recession (definition below). Viewed individually, these don’t offer much insight into the future, but viewed collectively they give subscribers a better idea of present and future business activity. While one indicator may fail, the probability of a majority of these sectors providing a false signal is significantly diminished. Our recommendation is that readers examine Figures 3-11 and look for signs of a turnover in recent results. If the majority is heading south, we should be concerned. Since World War II, most recessions have been preceded by an overheated economy as indicated by low unemployment, tighter monetary policy and rising long-term interest rates.
Figure 1 is what we describe as a heat map that summarizes the present state of the eight indicators tracked in this analysis. Details are described below. Color codes show the degree of distress of each item. Red (of which there are none today) would indicate a cause for concern. All except the yield spread are reported as changes to the three-month moving average (3MMA). The yield spread is shown as the actual value of the 10-year minus 2 -year Treasury interest rates.
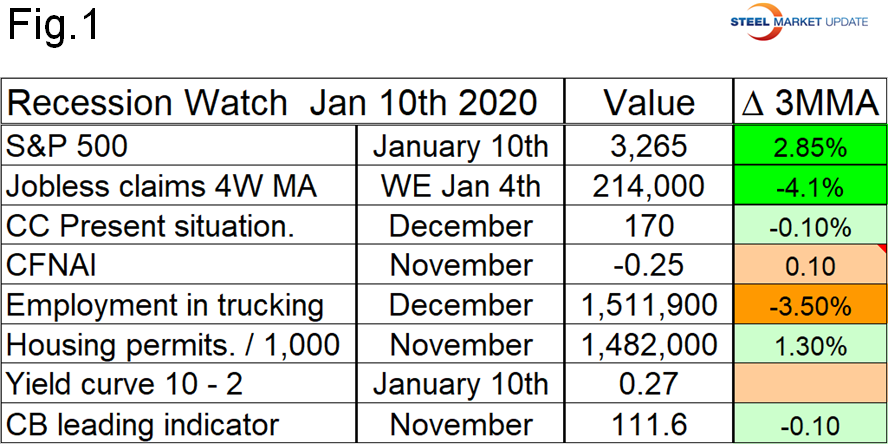
Figure 2 provides a history of U.S. recessions since 1970. Recessions occurred in 1974, 1980, 1981, 1990, 2001 and 2008. In its third estimate of the growth of U.S. GDP for Q3 2019, the BEA reported the growth of GDP to be 2.1 percent. This is a quarter-on-quarter result. On a trailing 12-month basis GDP grew 2.44 percent in the third quarter. Congressional Budget Office economists expect economic growth to decline in upcoming quarters but not to become negative through 2020.
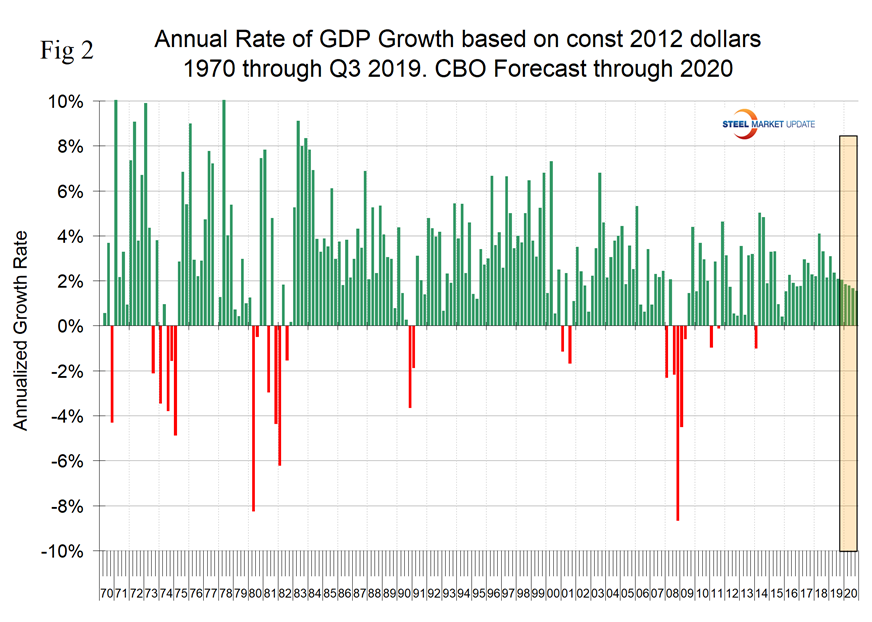
Figure 3 shows the three-month moving average of the S&P 500 early each month from January 1990 through Jan. 10, 2020. The stock market did predict the recession of 2001, but failed in 2008. Since then there have been several blips that proved to be of no significance. The tendency is that stock prices decline as investors anticipate a weakening economy and flagging corporate earnings. Fed tightening has also been a factor in the recent past.
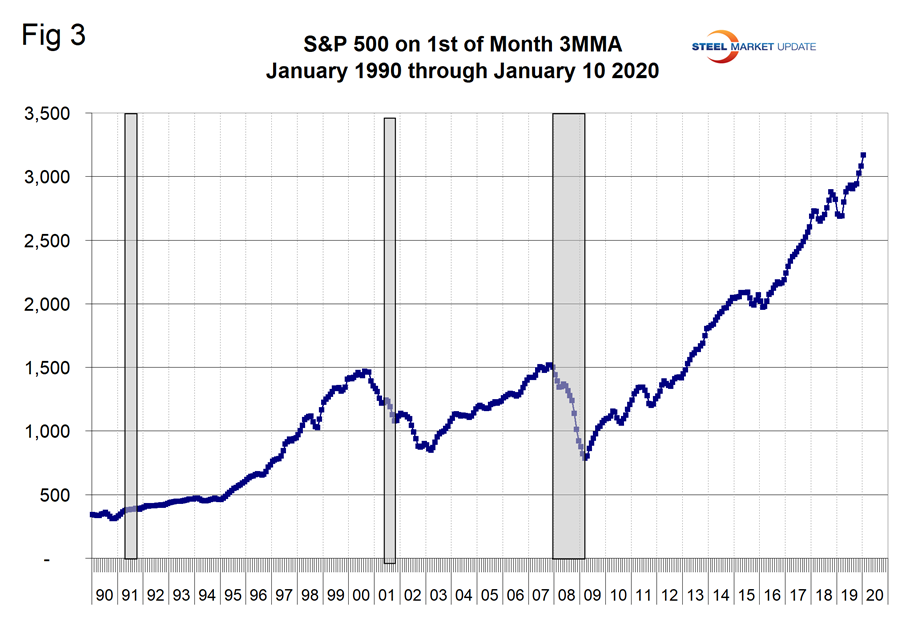
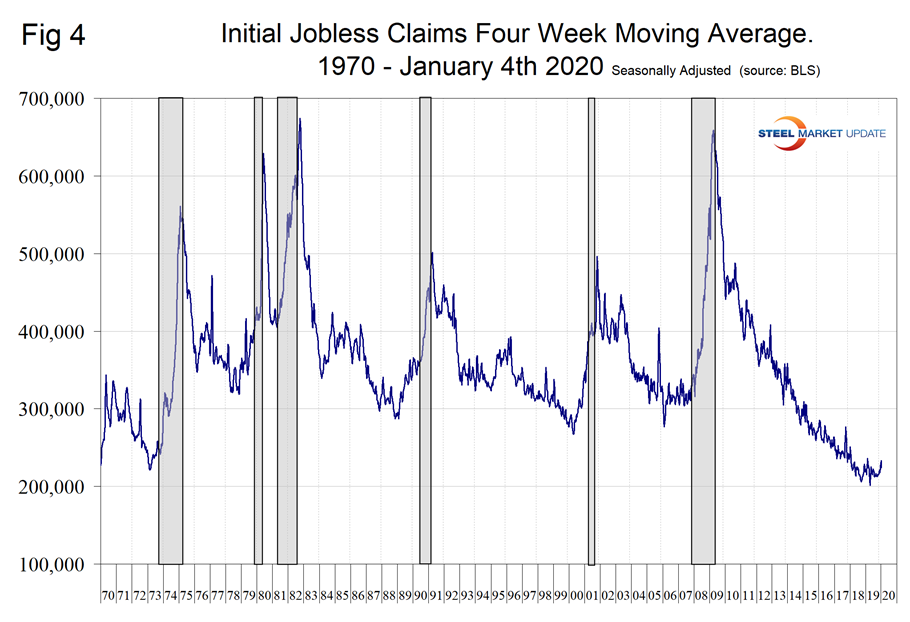
Figure 4 records new weekly claims for unemployment compensation. This indicator failed to predict the 1981 and 2008 recessions. It had a lead of over a year on the other four. Initial claims for unemployment insurance, reported weekly, are a sensitive measure of layoffs. Initial claims have been hovering around a 50-year low all this year and are not hinting at an imminent problem.
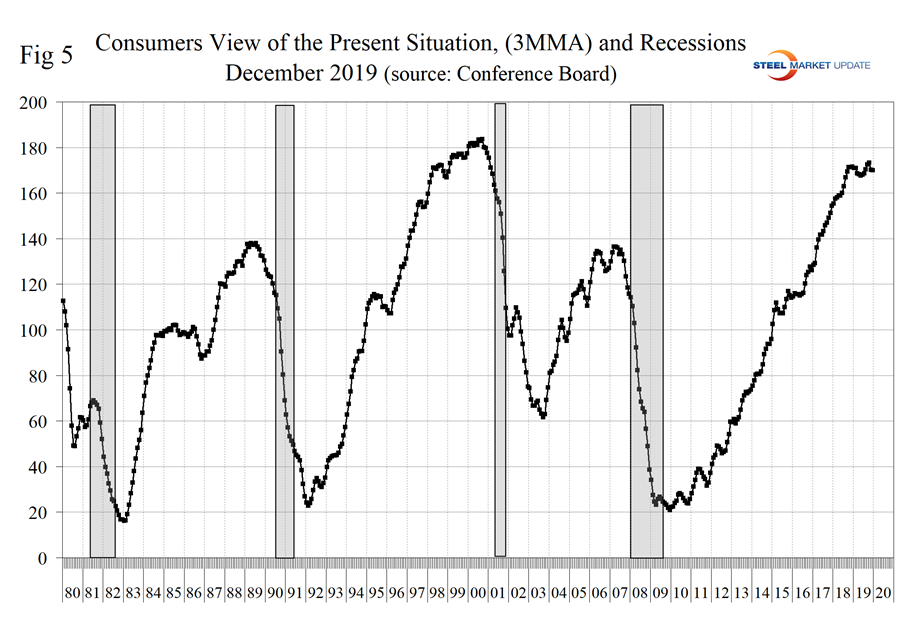
Consumer Confidence: When consumers, businesses and investors lose confidence it sets up a downward self-reinforcing spiral of reduced spending and investment, causing even higher unemployment and further depressing confidence. Consumer confidence is reported as sentiment indexes of the present situation and expectations, and a composite of the two. It appears that the consumer’s view of the present situation is the best predictor of future recessions and this is shown in Figure 5. The present conditions sub-index shows a hesitation but no sign of a sustained decrease. The 3MMA of that component of the index declined by 0.1 percent in December.
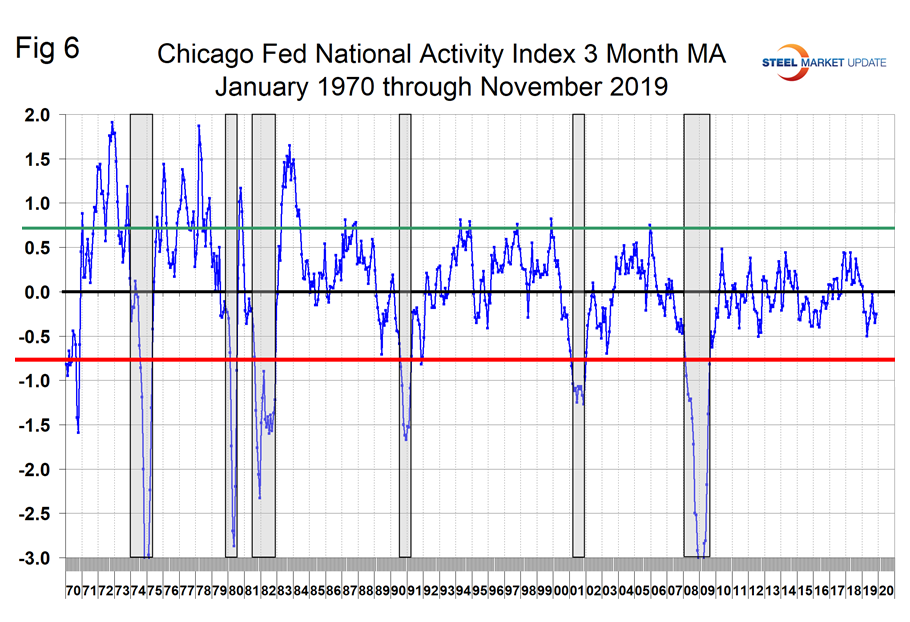
Chicago Fed National Activity Index: This index is a weighted average of 85 indicators of national economic activity drawn from four broad categories of data: 1) production and income; 2) employment, unemployment, and hours; 3) personal consumption and housing; and 4) sales, orders, and inventories. A zero value for the index indicates that the national economy is expanding at its historical trend rate of growth; negative values indicate below-average growth; and positive values indicate above-average growth. When the CFNAI-MA3 (three-month moving average) value moves below -0.70 following a period of economic expansion, there is an increasing likelihood that a recession has begun. Conversely, when the CFNAI-MA3 value moves above -0.70 following a period of economic contraction, there is an increasing likelihood that a recession has ended.
Since our data stream began in January 1970, the CFNAI has predicted every recession, but in between there have been stumbles and false alarms (Figure 6). The CFNAI has been in negative territory since January 2019 but improved every month in the four months May through August, then declined in September and October before recovering slightly in November to negative 0.25. This is not in the danger zone of negativity >-0.7
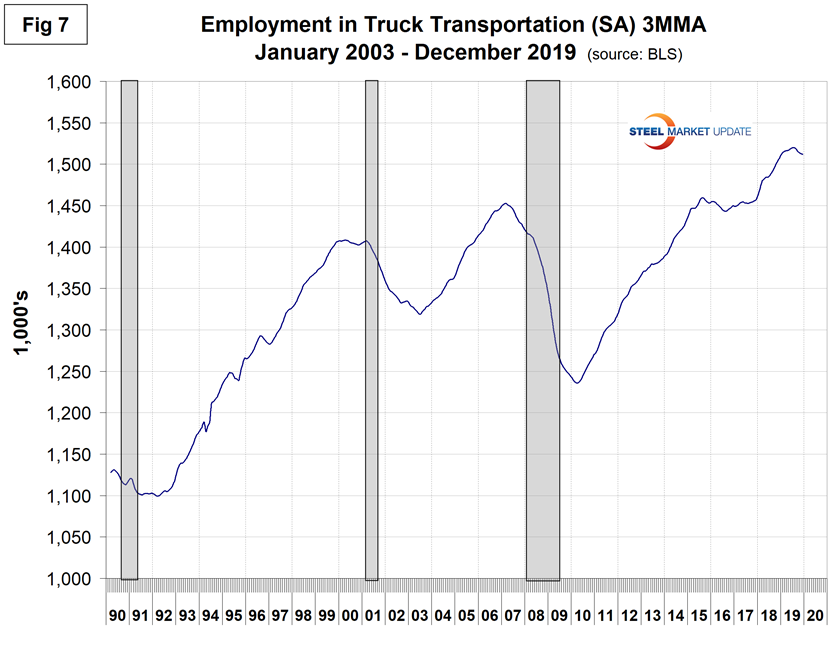
Employment in Trucking: Figure 7 shows total truck driver employment as reported monthly by the BEA. As a measure of economic activity this indicator has predicted the last three recessions. Trucking employment is the indicator of greatest concern in this analysis and declined in five out of six months through December.
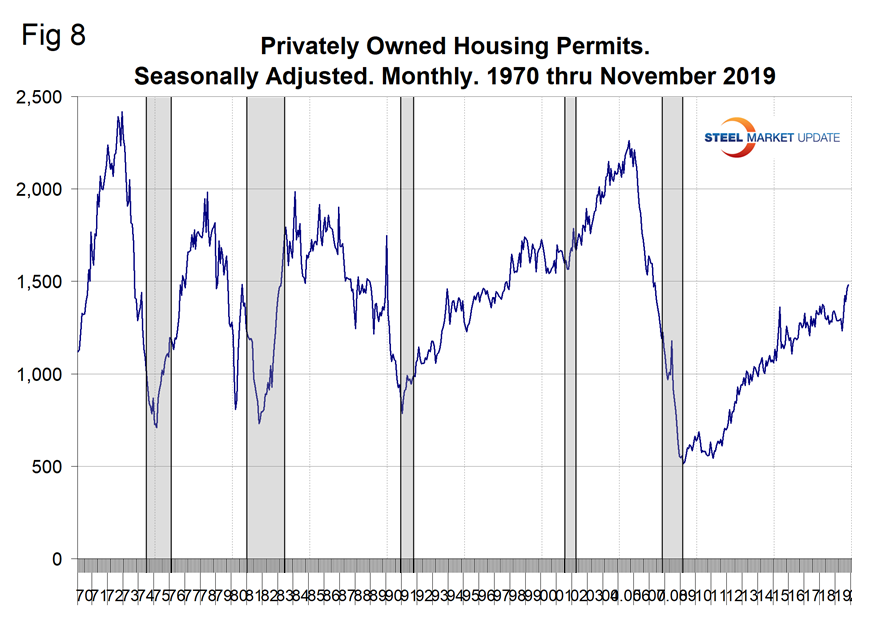
A decline in housing permits has led every recession since 1970. This seems to be a very prescient indicator. Permits have increased in four out of five months July through November, which on a 3MMA basis was 11.0 percent higher than a year ago (Figure 8). This indicator is very encouraging.
Historically, the most accurate recession predictor has been the bond market, because this massive capital market determines government and business borrowing rates. This is why the famous yield curve has been able to predict every recession since the mid 1960s with a six- to 24-month lead time (and just one false positive). Or to put it another way, no recession has occurred in the absence of a prior yield-curve inversion. If the 10-2 yield curve inverts, there’s a 90 percent historical probability that a recession is coming in the next two years.
The Treasury spread is developed by subtracting a shorter-term from a longer-term Treasury yield. Ten-year interest rates minus two-year interest rates, for example, as shown in Figure 9. There was a lot written about negative yield spreads in 2019. Some analysts use different time frames, for example, 10 year minus 3 months. For our purpose here we are sticking with the 10-2, which seems to be the most widely recognized by analysts. A spread that is increasing is a sign of higher growth and inflation as bank lending becomes more profitable (borrow short and lend long) and loan growth is expected to accelerate. A declining or contracting yield spread foreshadows lower growth and inflation due to contractions in bank loan growth due to reduced profitability. The 10-2 spread went slightly negative for three days at the end of August before recovering to positive 0.27 on Jan. 10. We have blown up Figure 10 to show the last 25 months in detail. At present we are dodging this bullet as the decline in the spread has reversed since Aug. 27.
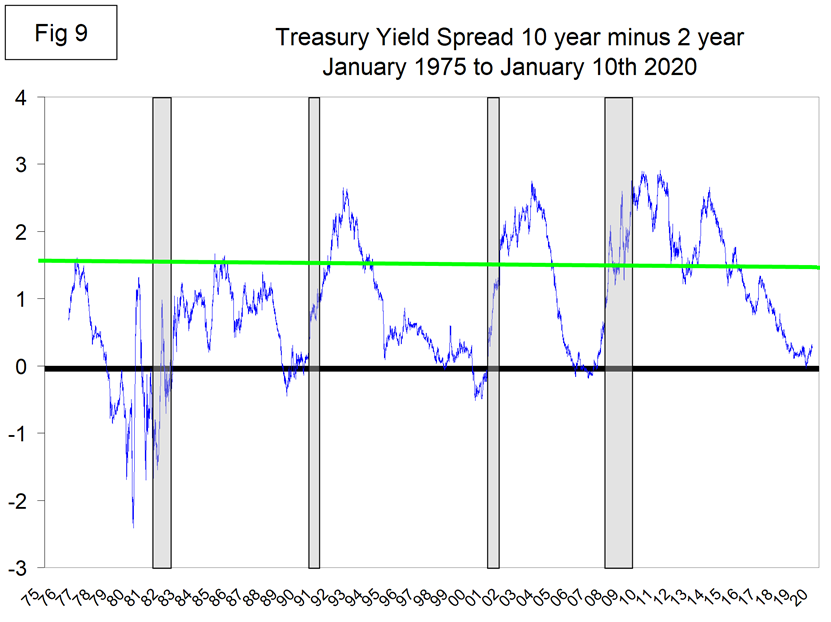
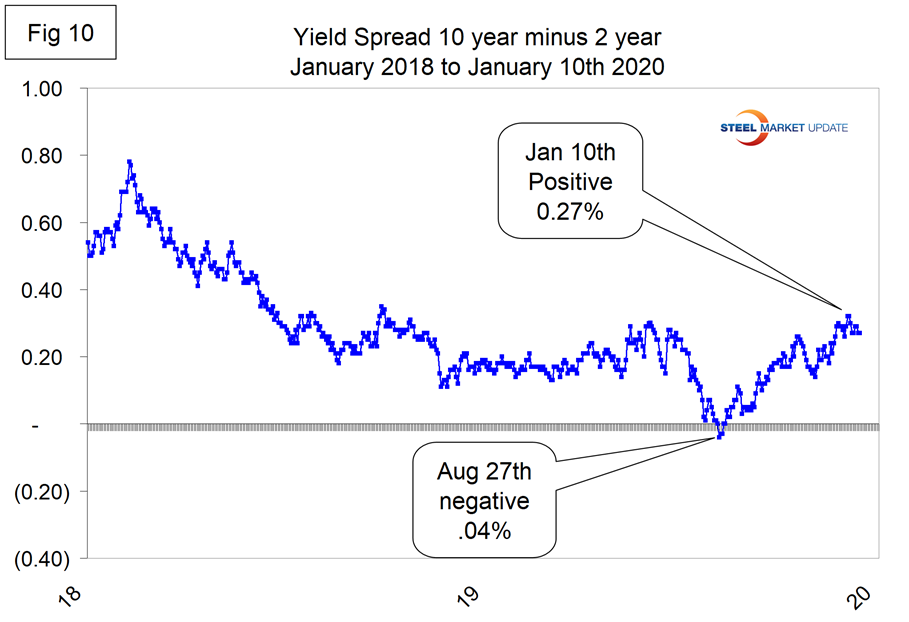
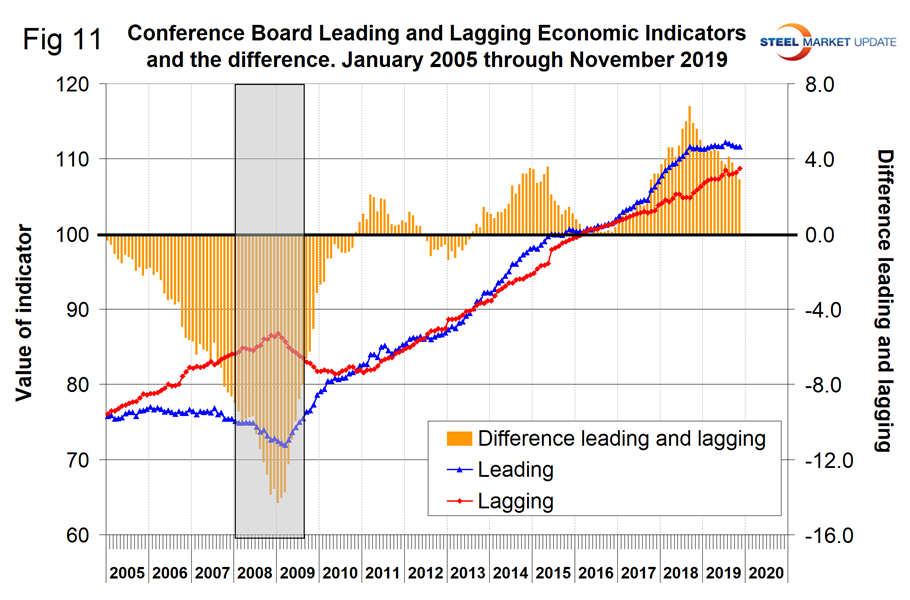
Figure 11 is the chart we like the best, though we have no history before 2008. This is The Conference Board leading and lagging economic index. The “LEI” is a composite of 10 individual data points including the average workweek, jobless claims, new orders, and the yield curve. We have subtracted the lag from the lead components in the rationale that if the lead is better than the lag, the situation is improving, or vice versa. The lead minus lag inverted three years in advance of the 2008 recession; certainly by 18 months before the big event it was clear something was happening. The spread has narrowed in 2019 as the leading component has stalled but is still 2.9 points, which is historically high.
SMU Comment: Of the eight indicators summarized in Figure 1, none are flashing red and only truck driver employment gives us cause for concern. Taken as a whole, our eight indicators don’t signal a recession in at least the next six months.
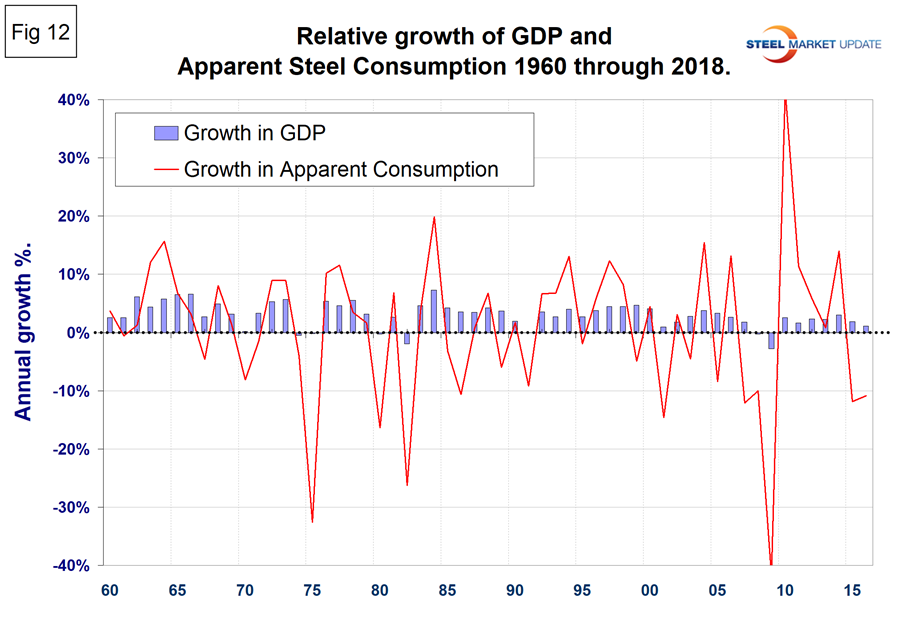
Note: Steel demand is related to GDP but is vastly more volatile both on the downside during recessions and on the upside at times of economic growth. Figure 12 compares the change in GDP and in apparent steel consumption over a period of 58 years. Steel consumption routinely varies by plus or minus 10 percent or more and this will happen again. This means that corporate managers whose business is related to steel must be ready with preemptive financial measures when the thunder clouds form. This Steel Market Update analysis attempts to provide guidance on the likelihood of a recession in the next six months.
Recessions are defined by the National Bureau of Economic Research (NBER), the organization tasked with identifying when a recession starts and ends. A rule of thumb is that a recession is defined as back-to-back quarters of negative economic growth. The problem with this definition is that it is about six weeks after the second quarter of negative growth before we know we are (or were) in a recession. The official definition of a recession from the NBER is: “A recession is a significant decline in economic activity spread across the economy, lasting more than a few months, normally visible in real GDP, real income, employment, industrial production and wholesale-retail sales.”


