

Market Data
February 27, 2020
Consumer Confidence Resists Virus...So Far
Written by Peter Wright
Steel Market Update is pleased to share this Premium content with Executive members. For more information on upgrading to a Premium-level subscription, email Info@SteelMarketUpdate.com.
The Conference Board report of consumer confidence through mid-February does not reveal undue concern about the coronavirus, but that will change rapidly if the news continues to worsen.
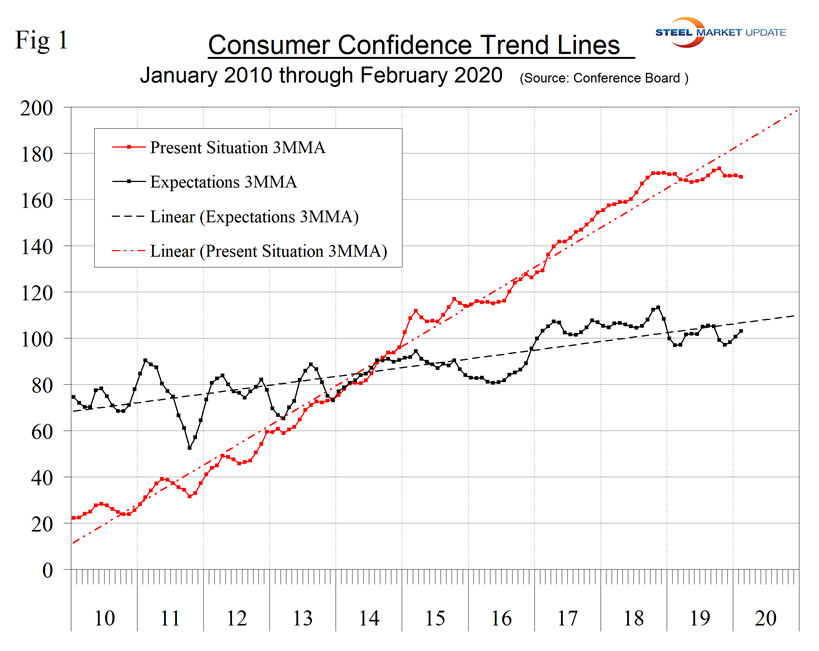
The composite value of consumer confidence in February, reported by The Conference Board, was 130.7 with a three-month moving average (3MMA) of 129.8. The 3MMA decreased from 132.1 in September. This indicator is quite volatile; therefore, we prefer to use a moving average to reduce monthly variability.
The composite index is made up of two sub-indexes: the consumer’s view of the present situation and his or her expectations for the future. In February, the consumers view of the present situation dropped by 8.8 points and expectations increased by 6.4 points. It’s not unusual for these components to move strongly in opposite directions in any given month. Both subcomponents were below the 10-year trend line, especially for the present situation, but there doesn’t appear to be a sharp move in response to the coronavirus situation. Both are at a sustained high level and have changed little in 12 months (Figure 1).
Moody’s Analytics summarized as follows: “U.S. consumer confidence failed to improve as much as we expected in February, but sentiment remains strong. Consumers’ assessment of present conditions dropped, but that is likely attributed more to fewer job openings than COVID-19.”
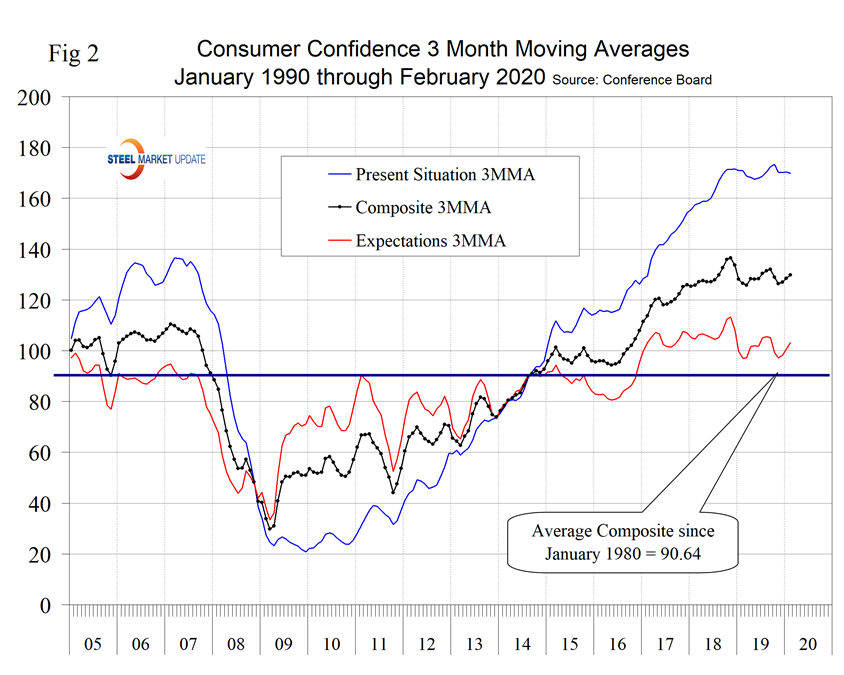
The consumer’s view of the present situation in August 2019 at 176.0 was the highest since November 2000. The February value was 165.1, which was almost the same as November. The 3MMA in February decreased from 170.3 to 169.8. The 3MMA of expectations in February was 103.1, up from 100.6 in January but down from 105.5 in August. The historical pattern of the 3MMA of the composite, the view of the present situation and expectations since January 2005 are shown in Figure 2.
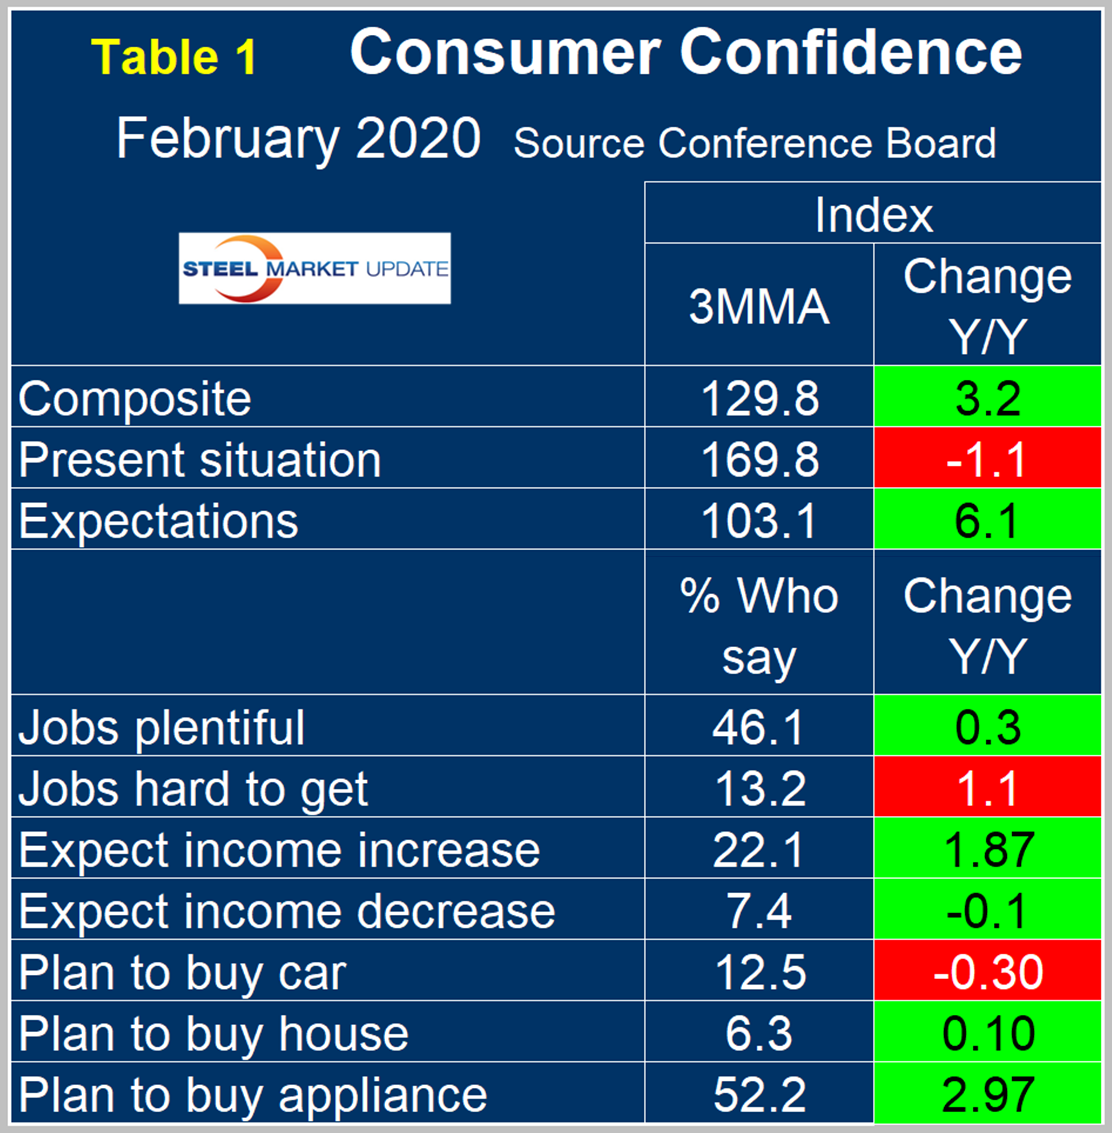
On a 3MMA basis comparing February 2020 with February 2019, the present situation was down by 1.1 points and expectations were up by 6.1 points (Table 1). The color codes show improvement or deterioration of the individual components in Table 1. In July and August 2019, the table was all green for the first time since January 2018. Changes in Table 1 since our January update were that plans to buy a car and a house both became positive and those finding jobs hard to get increased.
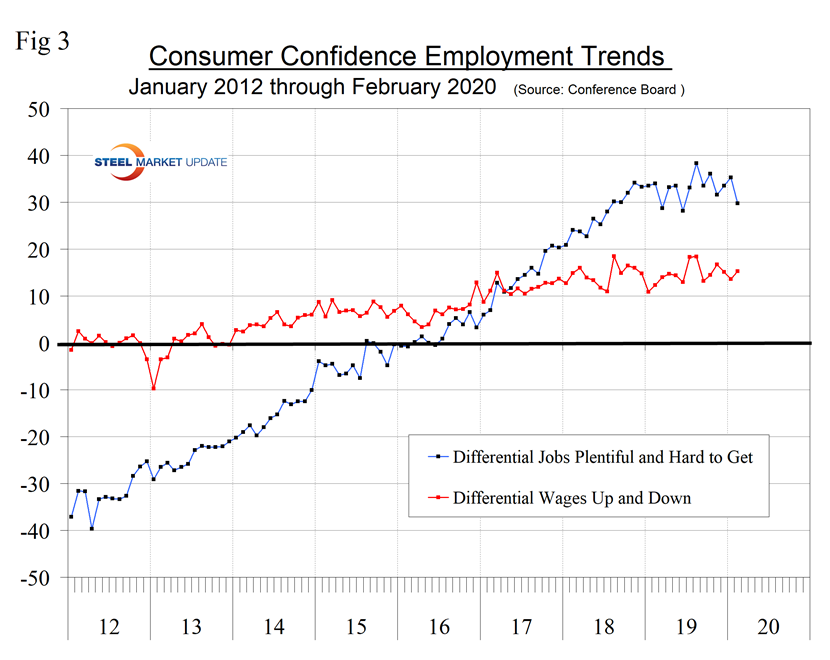
The consumer confidence report includes employment data that continues to be encouraging as 44.6 percent of respondents reported jobs to be plentiful. However, the differential between plentiful and hard to get decreased to the lowest level since June last year. Expectations for wage increases were also positive, with 22.0 percent expecting an increase and 6.7 percent expecting a decrease. Figure 3 shows the differential between the positive and negative statistics for employment and wages.
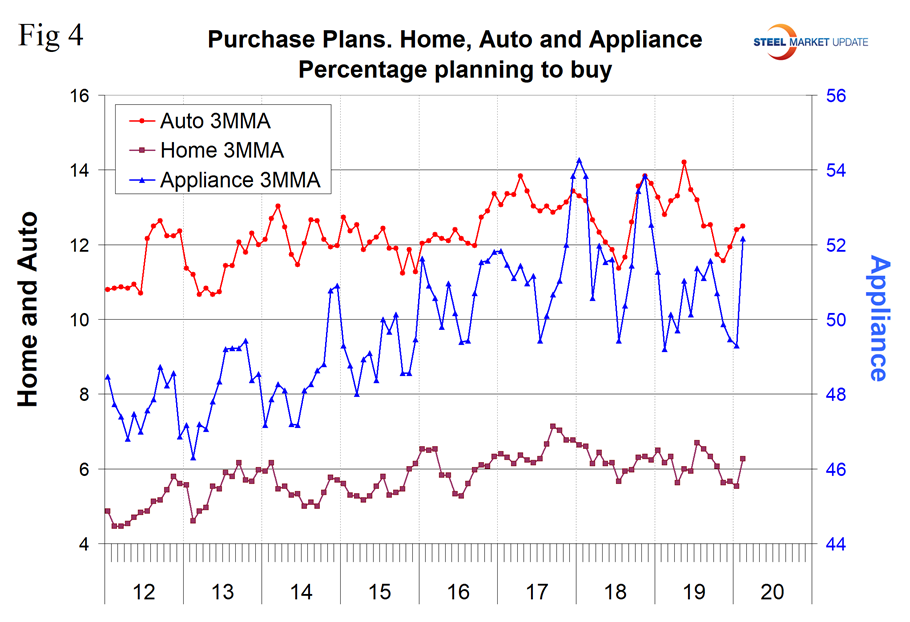
Consumer spending attitudes in February indicated that plans to buy a car, a house or an appliance on a 3MMA basis all increased month over month and plans for a house and an appliance were up year over year (Figure 4).
SMU Comment: Both components of the composite Conference Board Consumer Confidence Index are relatively stable at a historically high level, but this is likely to change as news of global coronavirus infections becomes more dire. If infection begins to be prevalent in the U.S., consumers will retreat, spending will decline and steel demand will suffer. Steel demand is dependent on the growth of GDP, which in turn is strongly influenced by consumer confidence, disposable income and a willingness to spend. Therefore, this is a report that should factor into corporate planning.
About The Conference Board: The Conference Board is a global, independent business membership and research association working in the public interest. The monthly Consumer Confidence Survey®, based on a probability-design random sample, is conducted for The Conference Board by Nielsen. The index is based on 1985 = 100. The composite value of consumer confidence combines the view of the present situation and of expectations for the next six months.


