Long Products

March 8, 2020
Import Market Share for Sheet, Plate, Longs, Tubulars Through August
Written by Peter Wright
This report examines the import share of sheet, plate, long and tubular products and 16 subcategories.
Since January 2020, imports’ share of the total sheet products has been 14.5 percent, down from 21.4 percent in 2015. The import share of HRC has been below 10 percent since January 2019. The most striking finding in this analysis is the result for imports’ share of other metallic coated sheet, which has declined by more than half in the past two years, not just because imports were down but also because domestic shipments have increased steadily since 2014.
Table 1 shows total supply to the market in three months through August and in 12 months through August for the four product groups and the 16 subcategories. Supply to the market is the total of domestic mill shipments to domestic locations plus imports. It shows imports on the same three- and 12-month basis and then calculates import market share for the two time periods for 16 products. Finally, it subtracts the 12-month share from the three-month share and color codes the result green or red. If the result of the subtraction is positive, it means that import share is increasing and the code is red. The big picture is that import market share rose in three months compared to twelve months for total sheet, tubular and long products and declined for total plate products.
There is a huge difference in import market share between products with each of the tubular products and coiled plate being the worst cases. See note below about tubular products.
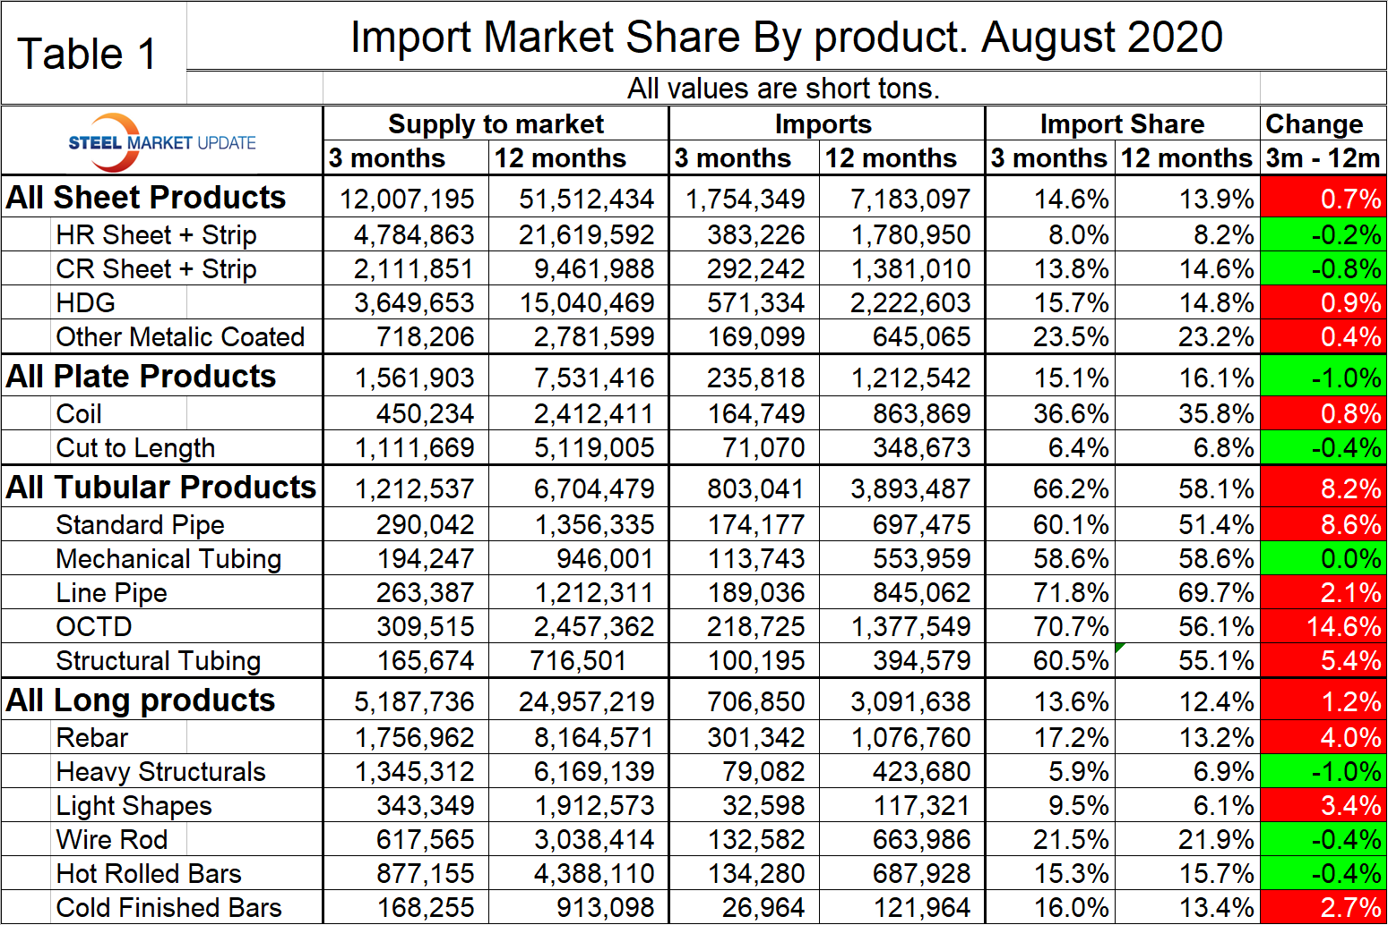
Figure 1 shows the historical import market share of plate and total sheet products. The import share of plate has been decreasing erratically since February 2015. There has been a downward drift of sheet product import share in the same timeframe.
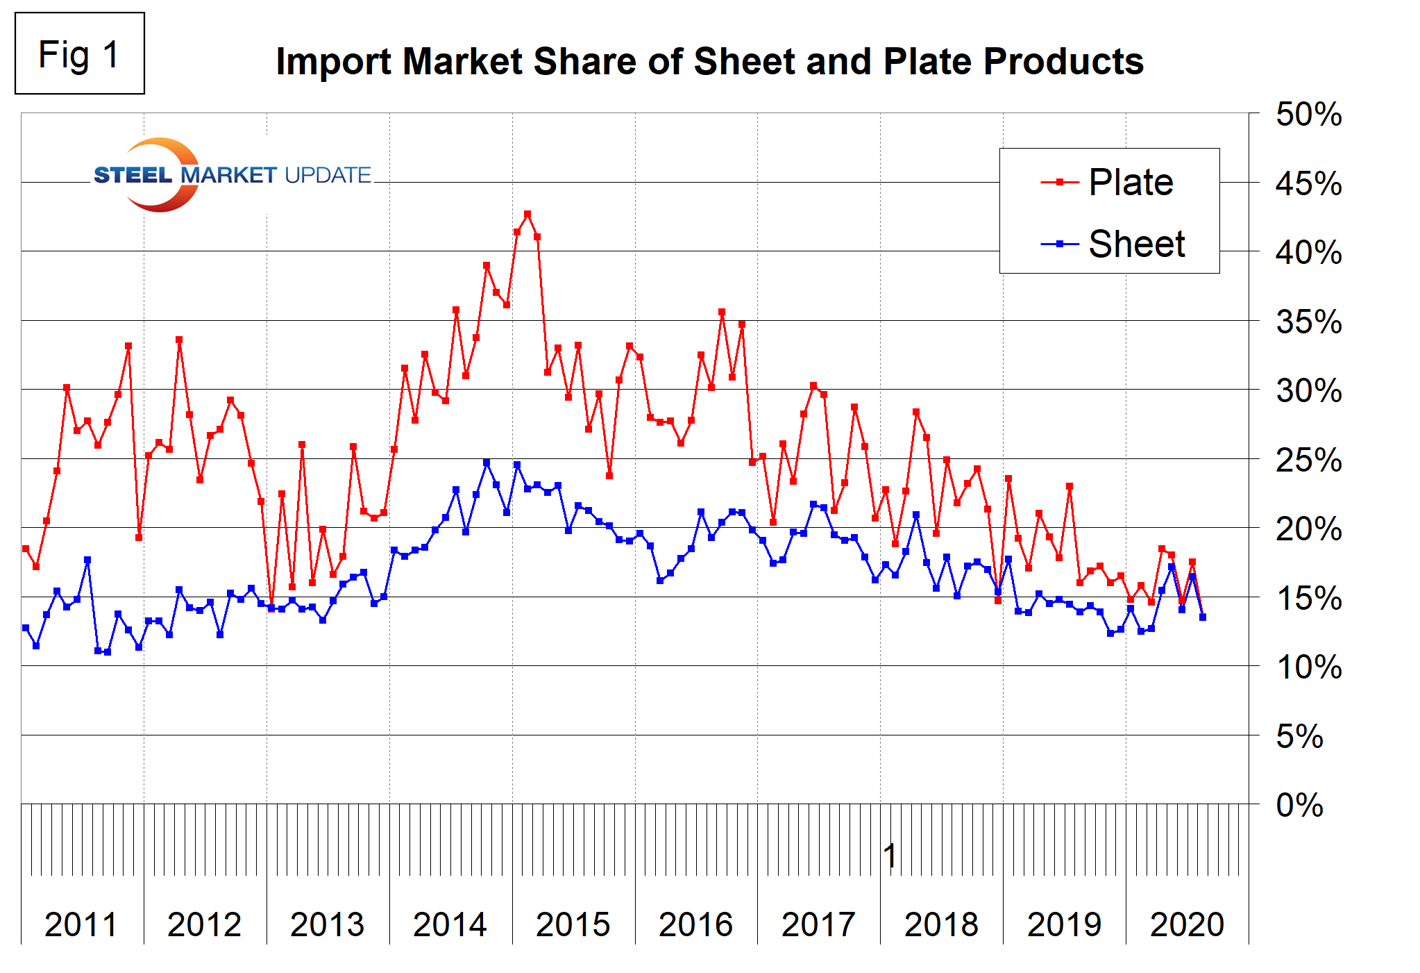
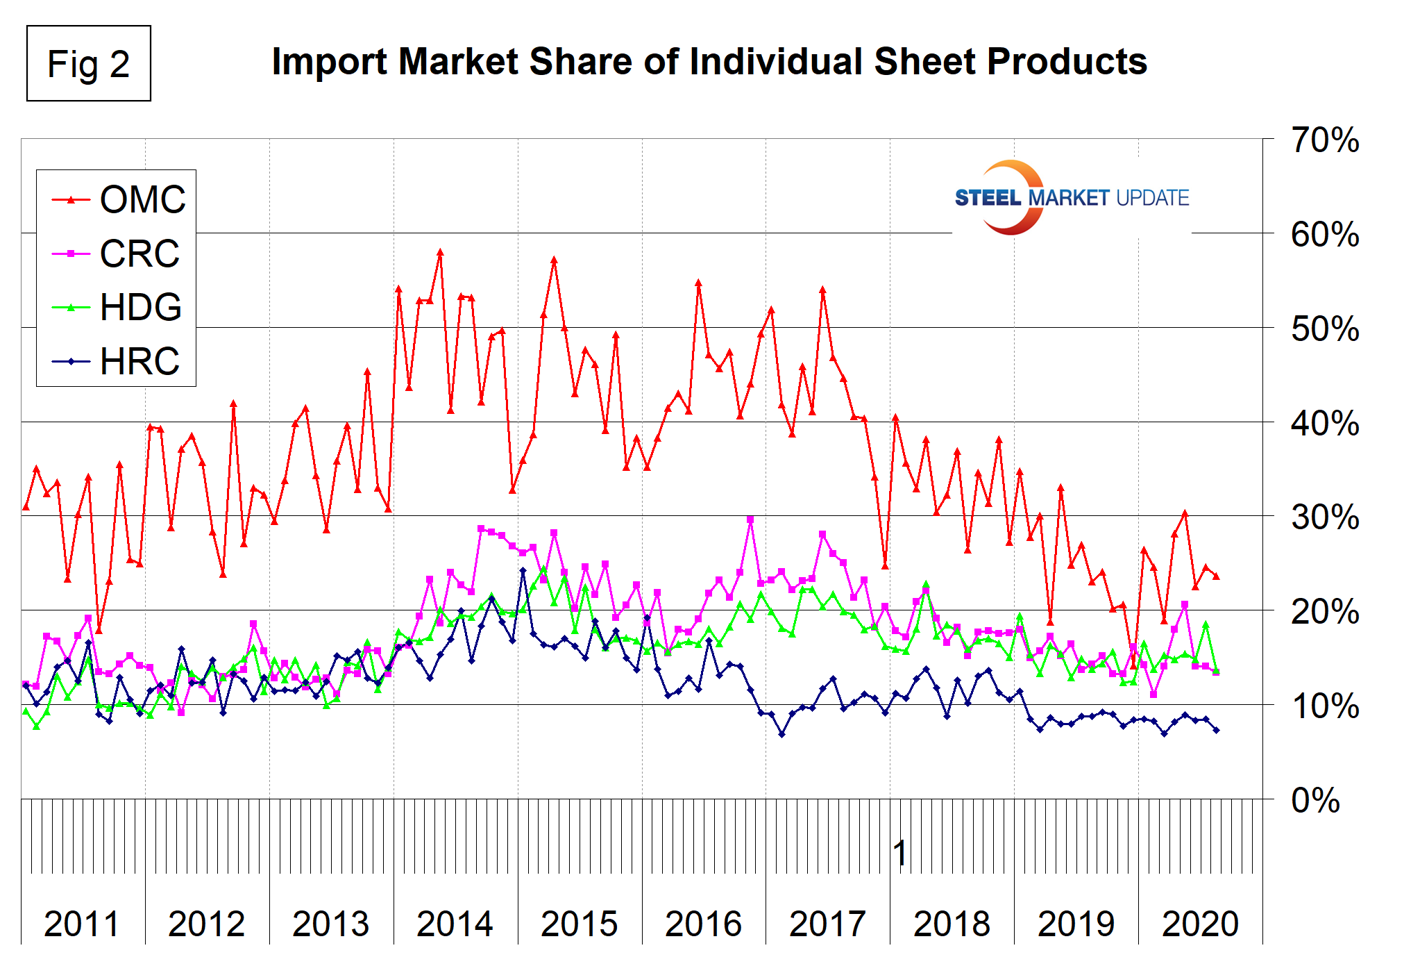
Figure 2 shows the import market share of the four major sheet products. Other metallic coated (mainly Galvalume) has traditionally had by far the highest import market share, but the gap has closed since late 2017. For the last four years, hot rolled coil has had the lowest import market share of the major sheet products.
Figures 3 through 6 show the domestic shipments, imports and import market share of the four major sheet sectors. The biggest change has been that domestic shipments of OMC have more than doubled since 2014 with a corresponding decrease in import market share. The import market share of cold rolled has declined by half since 2017. The import market shares of hot rolled and HDG have drifted down since 2015 but less dramatically.
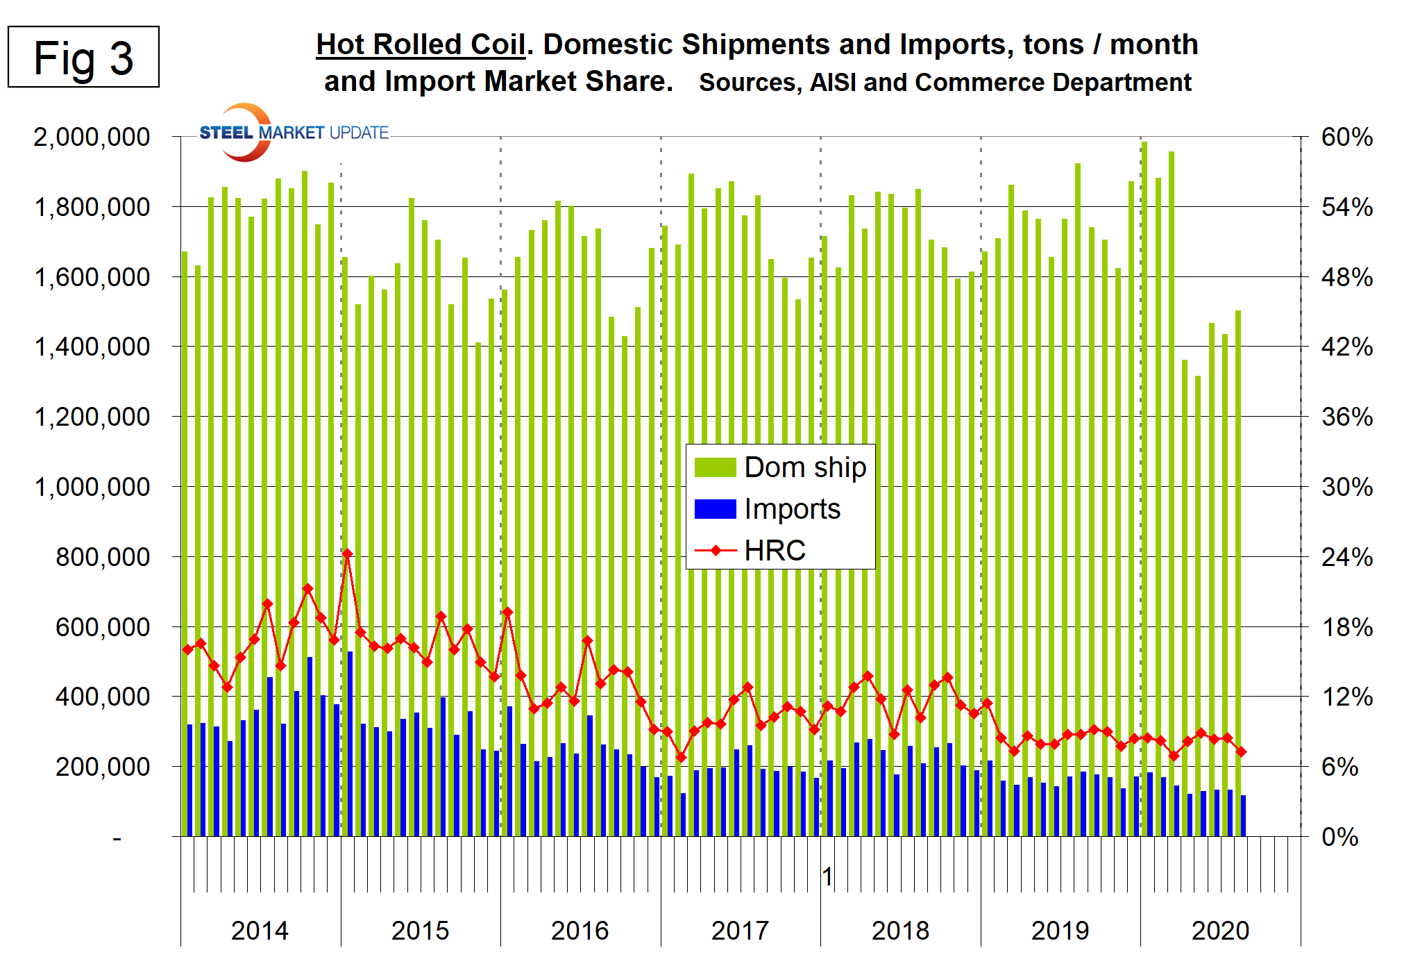
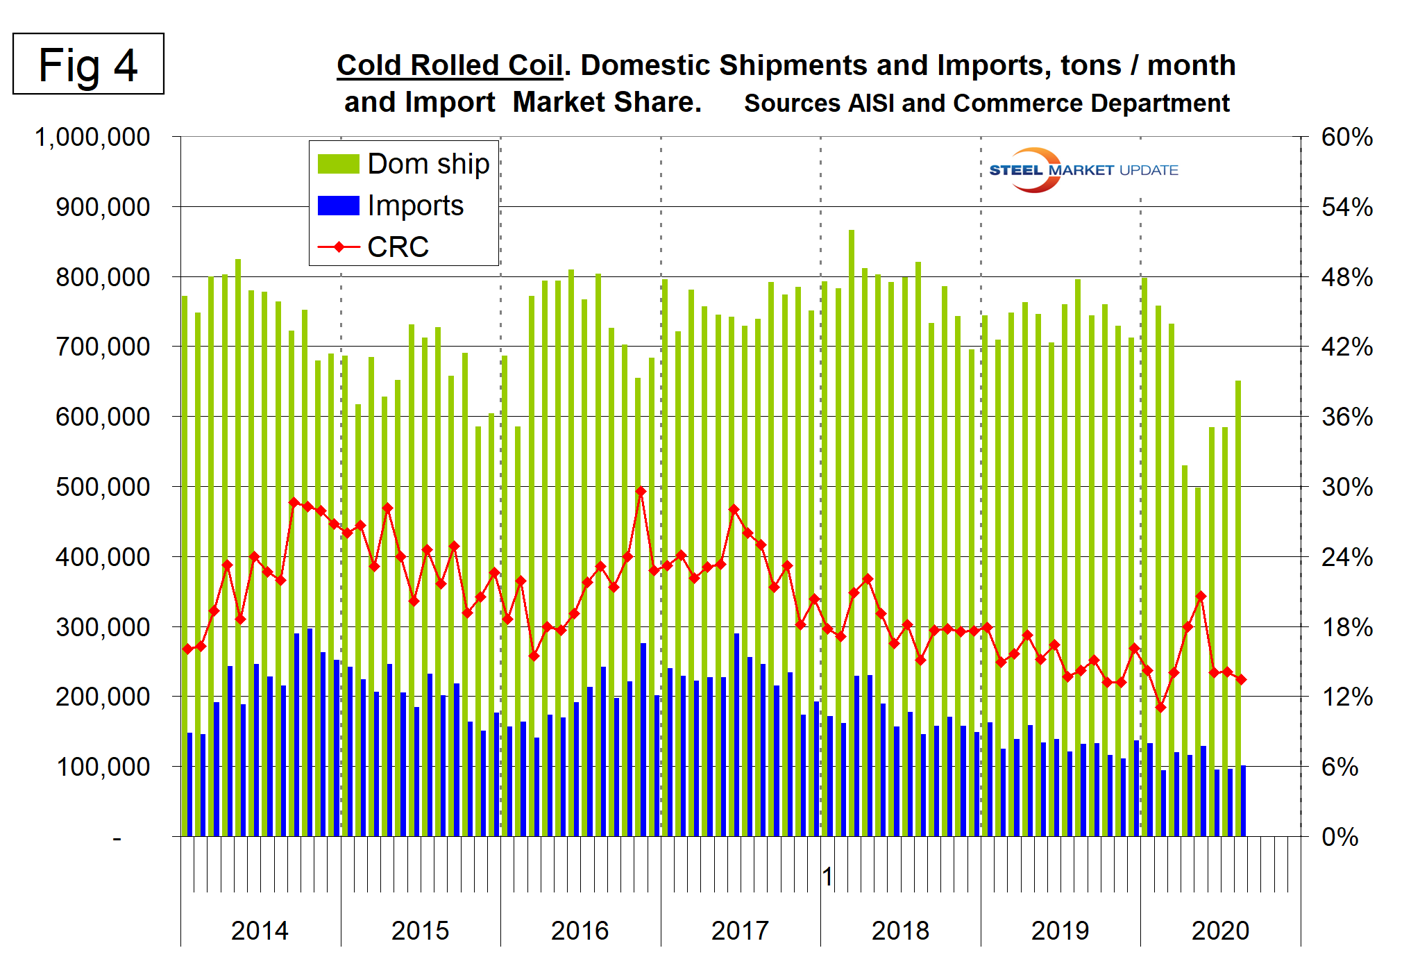
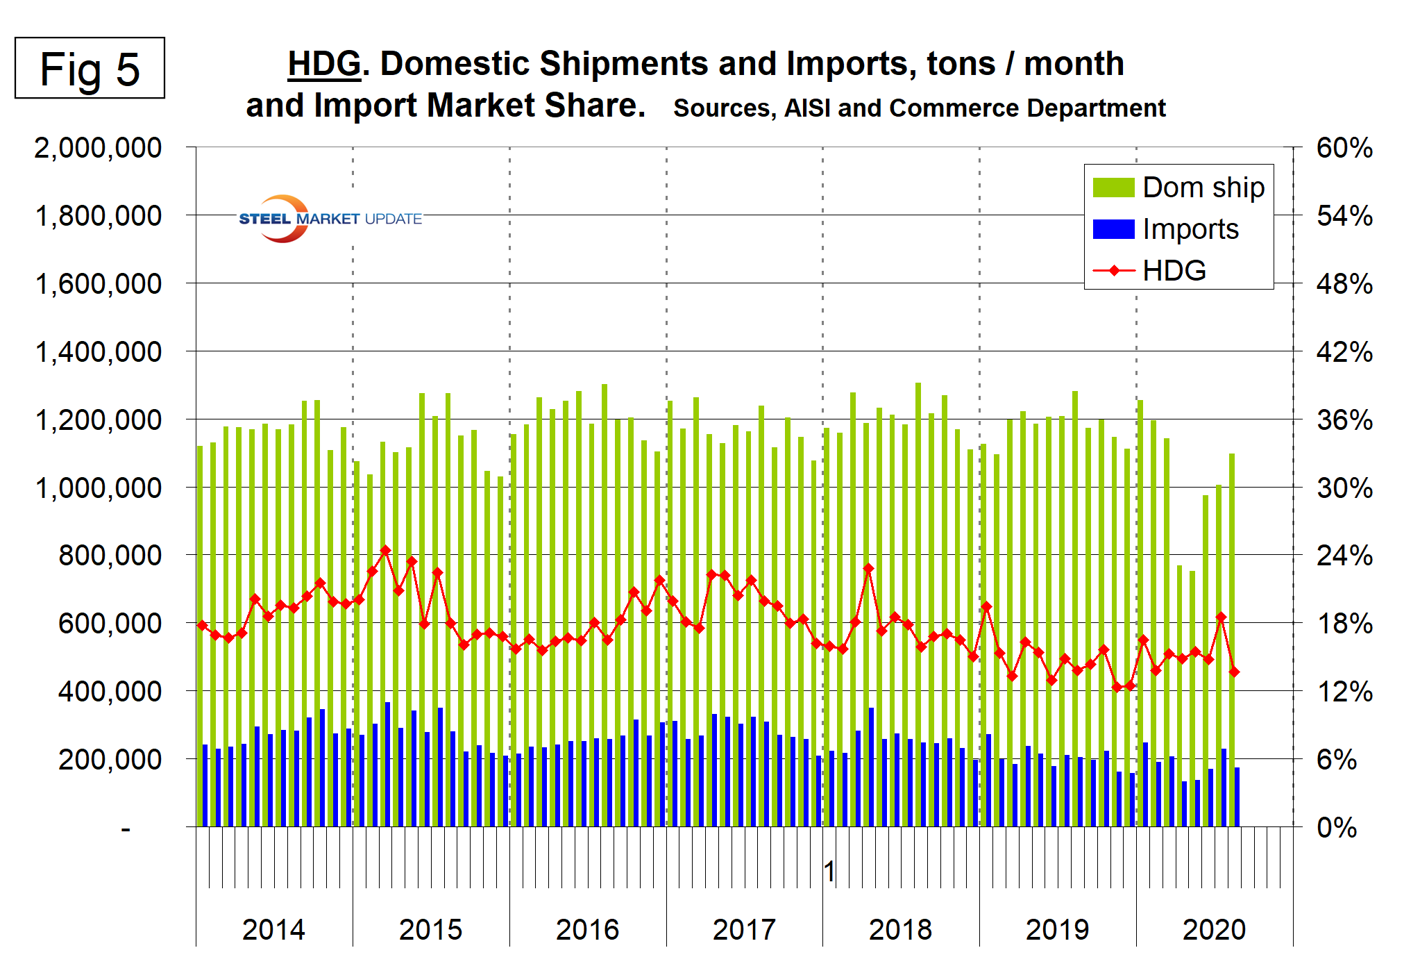
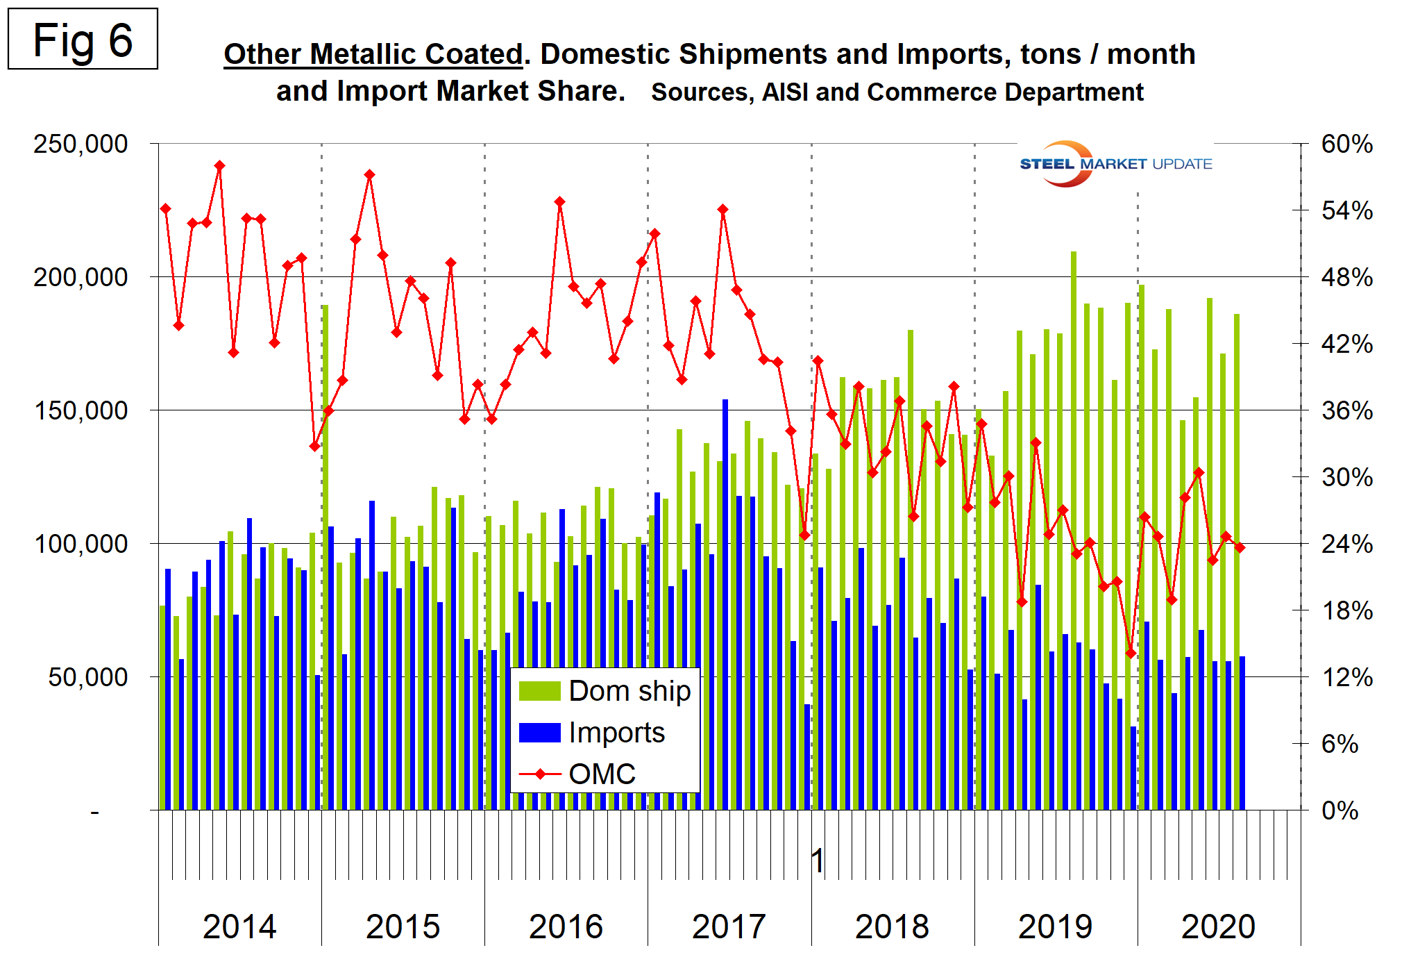
Figure 7 breaks out coiled and discrete plate from the flat rolled total and shows that in 2020 through August, coil imports had more than five times the market share of CTL imports.
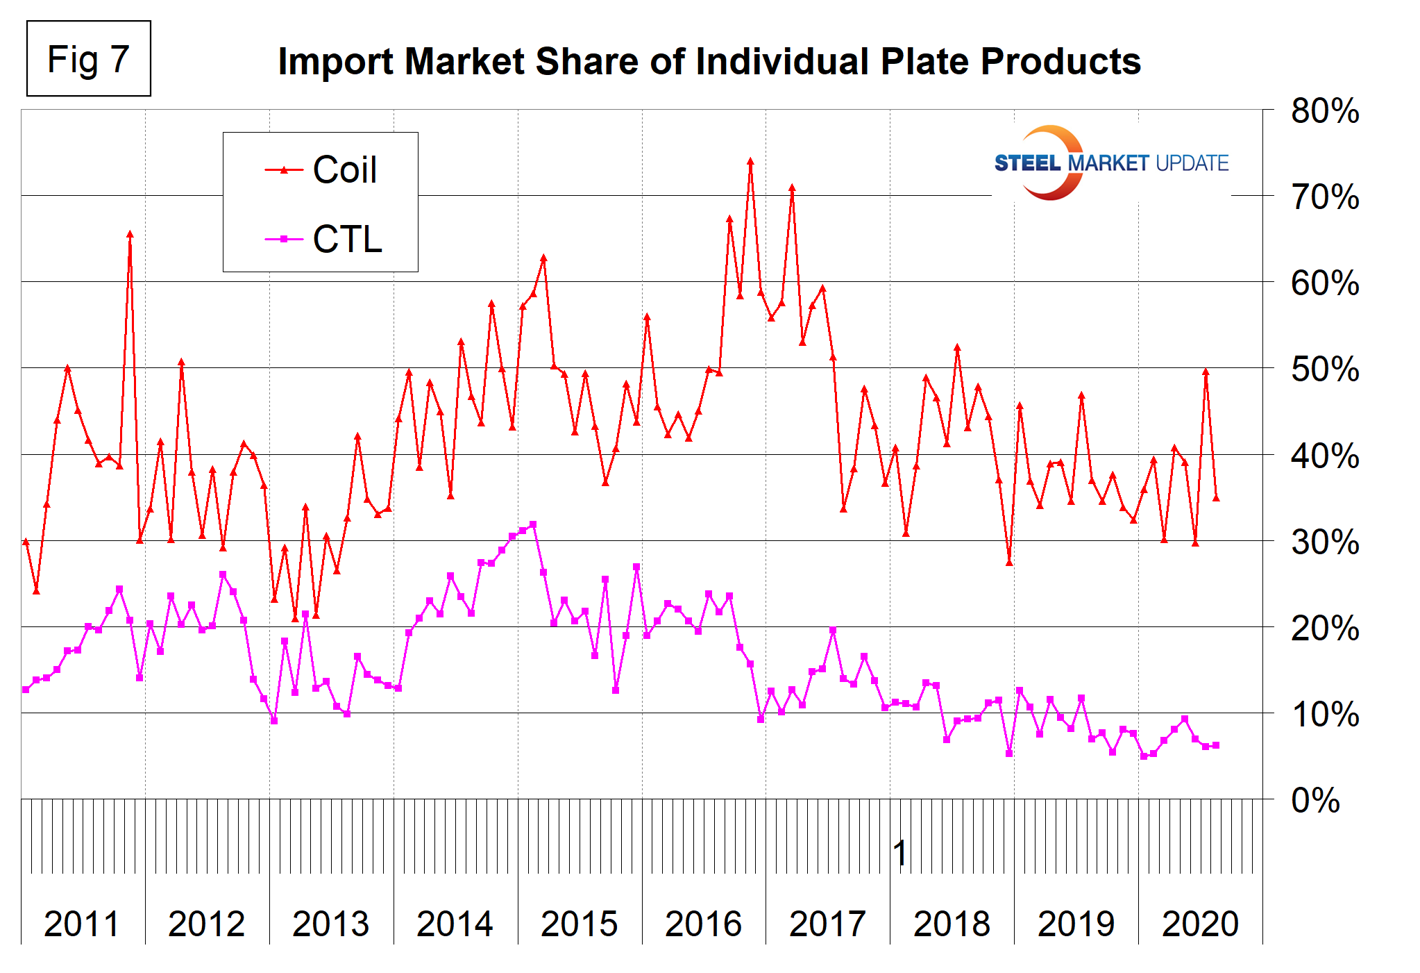
Figure 8 describes the total import share of tubular goods and long products. It is evident as we work the numbers that data for the domestic production of tubulars is greatly understated. This is probably because of a more fragmented supply chain and the independent tubers not reporting to the extent that the steel mills do for other products. This has the result of increasing the apparent import market share. Even though we don’t believe these numbers for tubulars, we are including them here in the belief that trends should still have some validity. Since 2016, the import market share of long products has declined by about 50 percent.
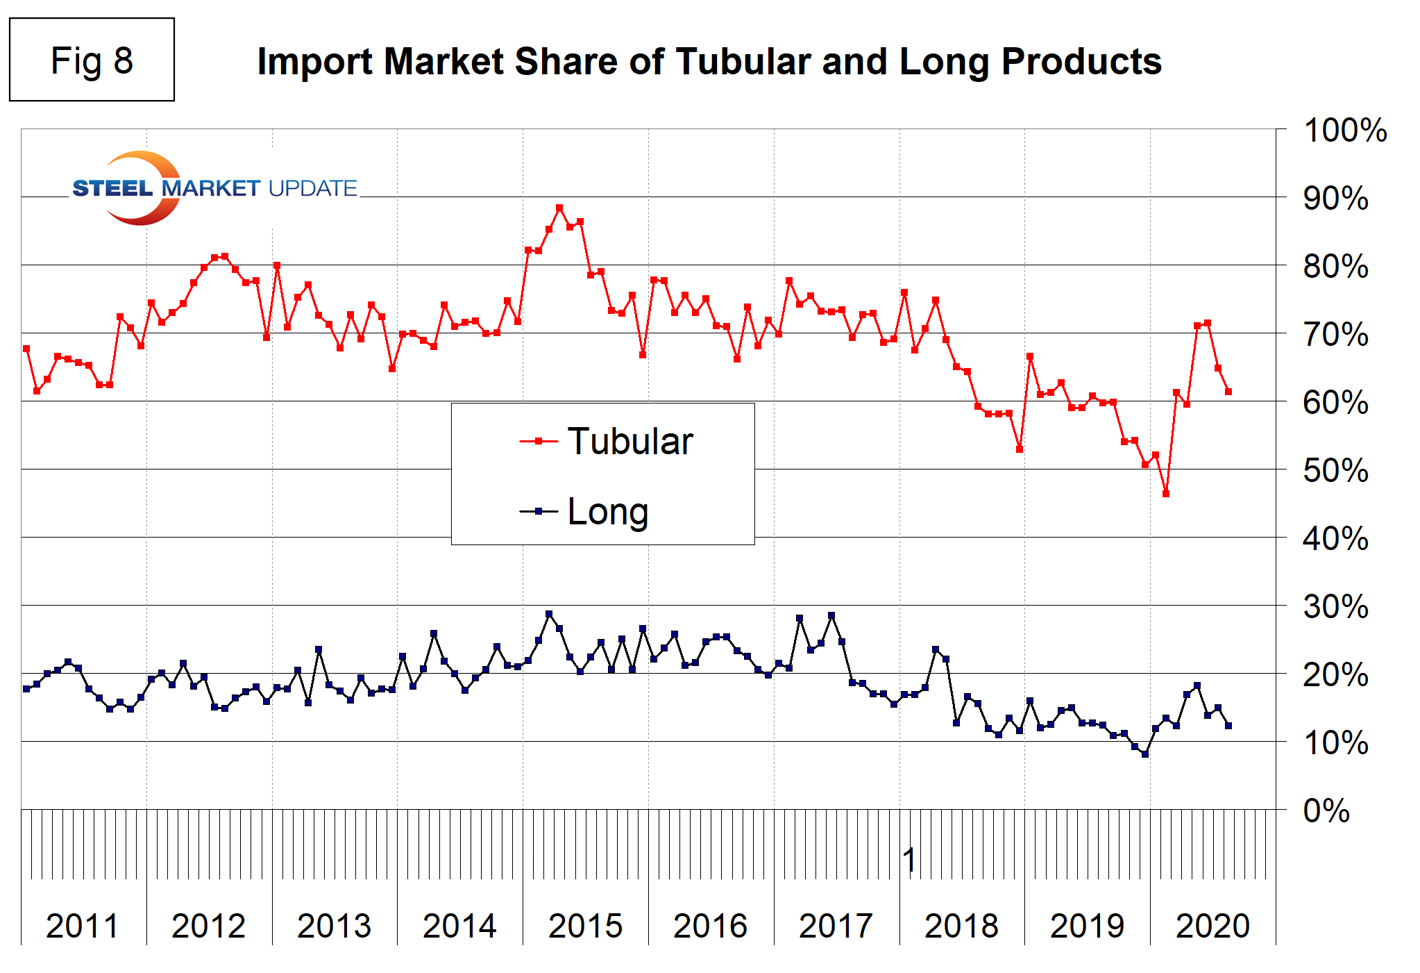
Figure 9 shows the import market share of the individual tubular products. Based on the available information, all are very high compared to other steel product groups. Line pipe is the highest, but declined dramatically in 2019. Domestic production of OCTG dropped dramatically in May and June with the result that import market share skyrocketed. We hope that the errors in the tubular data are consistent and the shape of the curves in Figure 9 are useful to industry professionals.
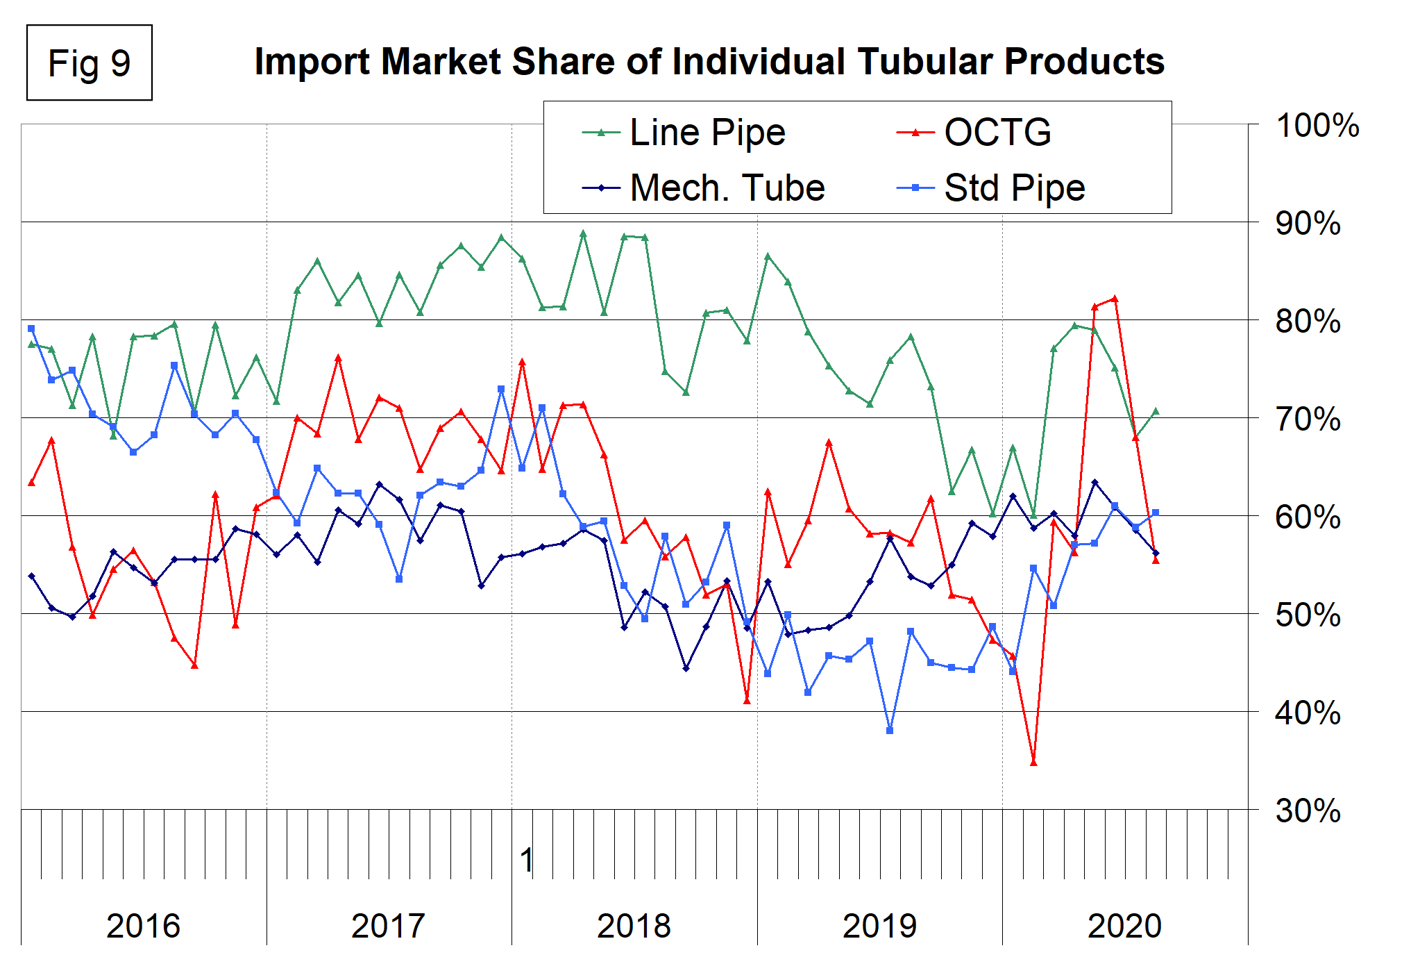
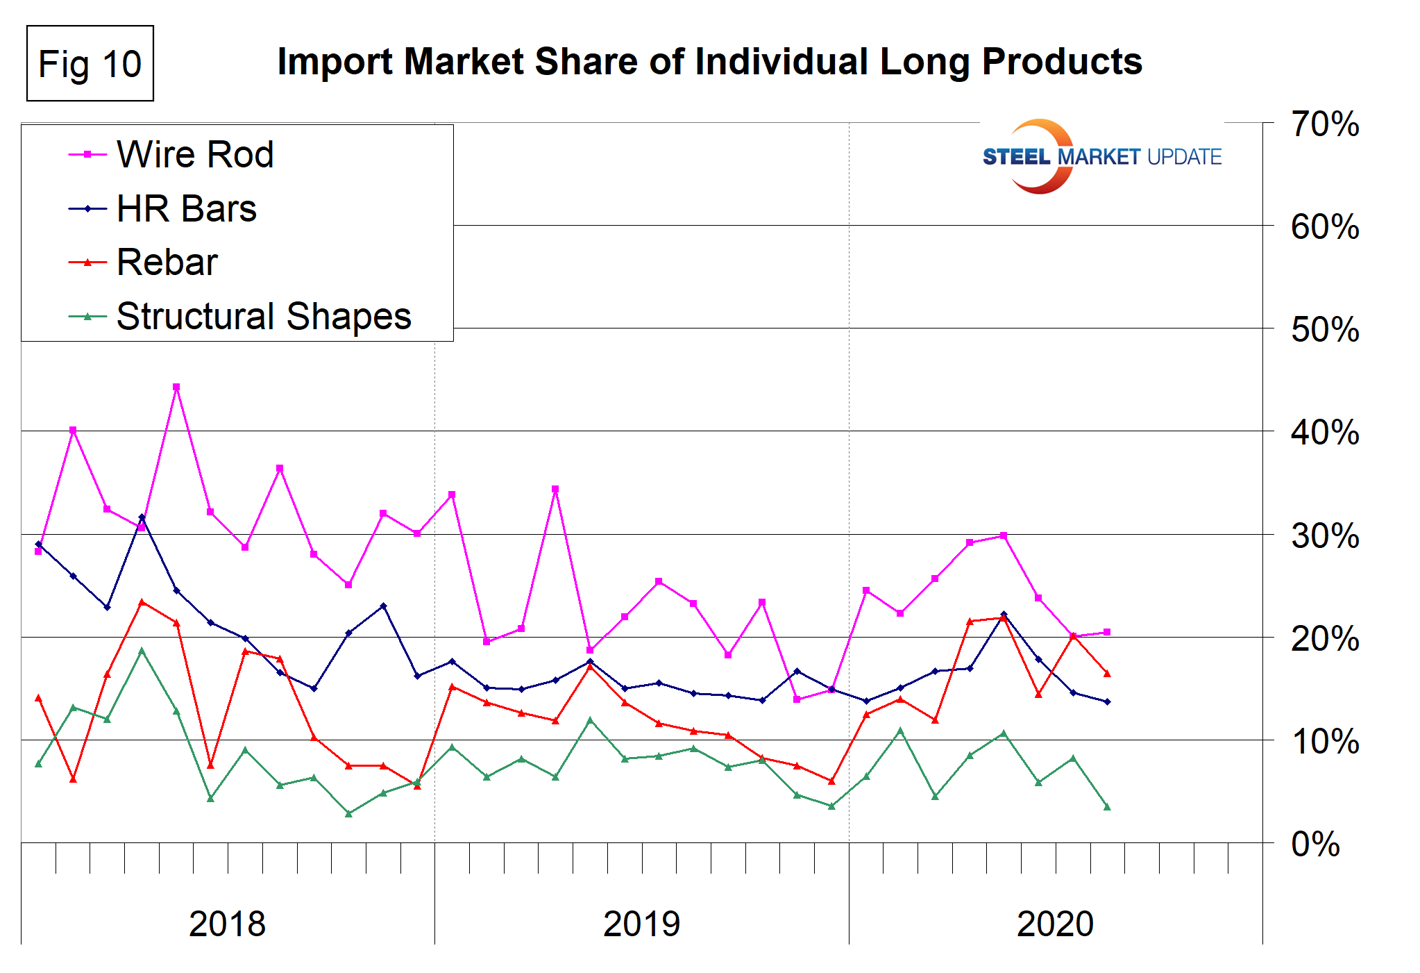
Figure 10 shows the detail for the four major sectors of the long products group since January 2018. The most significant change in this sector was for wire rod, which in the years 2014 through most of 2017 had double the import market share of the other long products. In the second half of 2017 the gap began to narrow to the point that in November 2019 the import share of wire rod fell below that of hot rolled bars. Rebar has been very erratic, but the import share fell to a historically low level in December 2019 before returning to a more normal level in 2020.