Prices

March 13, 2020
Regional Imports Through December: Hot Rolled Coil
Written by Peter Wright
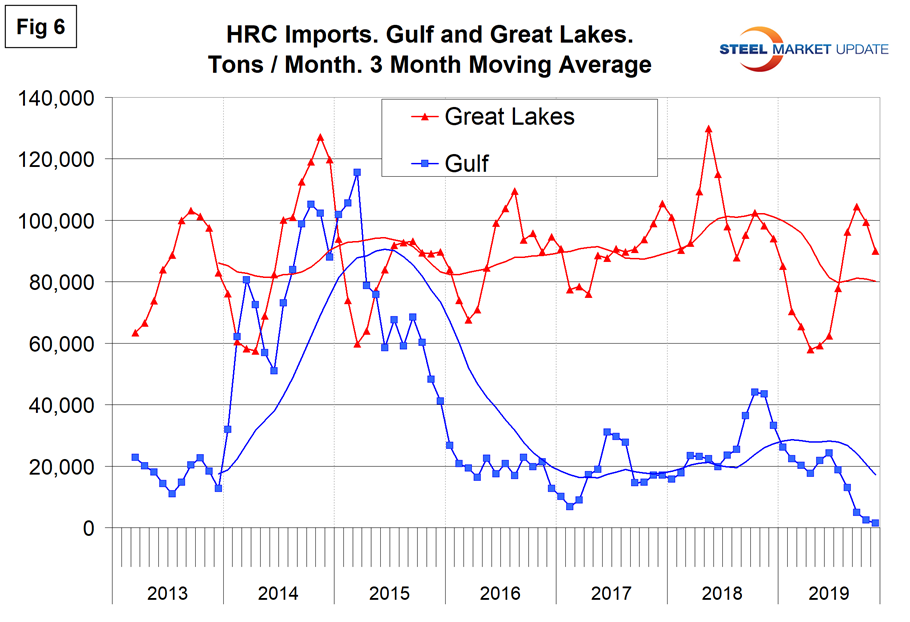
In the course of 2019, imports of hot rolled coil into the Gulf had declined to almost zero by December.
![]()
SMU presents a comprehensive series of import reports ranging from the first look at licensed data to the detailed look at volume by district of entry and source nation. The report you are reading now is designed to plug the gap between these two. National level import reports do a good job of measuring the overall market pressure caused by the imports of individual products. The downside is that there are huge regional differences. This series of reports breaks total YTD import tonnage of six flat rolled products into seven regions and the growth/contraction for each product and region. Then it graphs the regional history of each product since 2013. We will report regional import data for each of six flat rolled products every other month. This month, we are reporting through December.
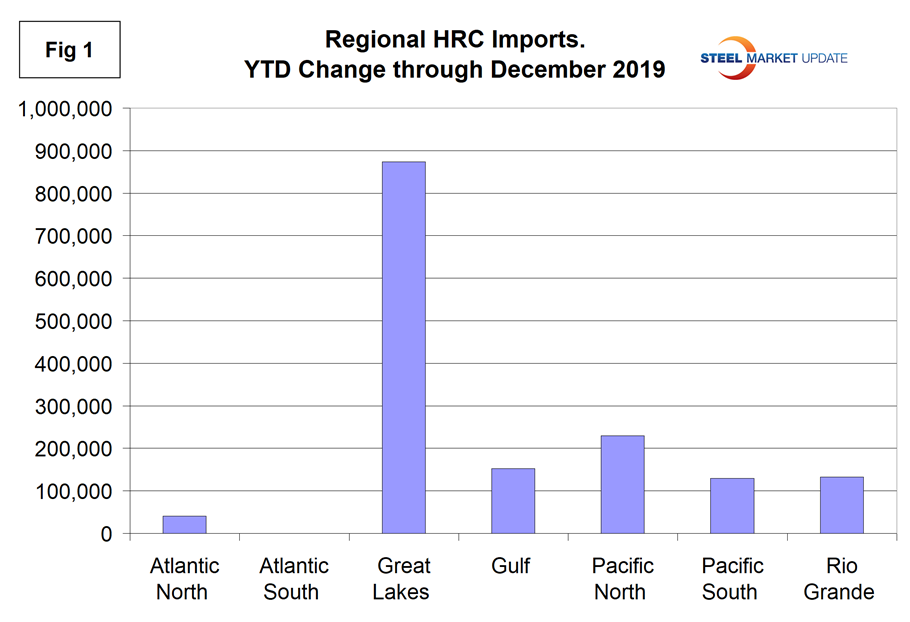
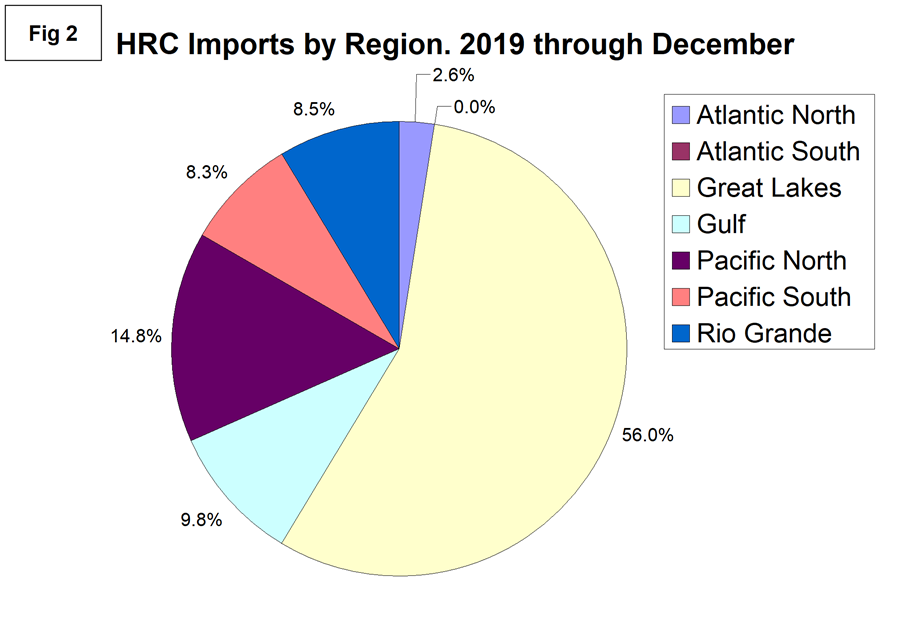
These six reports are intended to be reference documents with very few specific comments. The charts tell the whole story. Our intent is to provide buyers and sellers with an understanding of what is going on in their region of operation. Figure 1 shows the YTD tonnage of cold rolled sheet into each region and the huge variation between them. Figure 2 presents the same data as a pie chart. By far the highest volume region in 2019, YTD December, was the Great Lakes, which accounted for 56.0 percent of the total. The only other region to have a double-digit percentage of the total was the Pacific North.
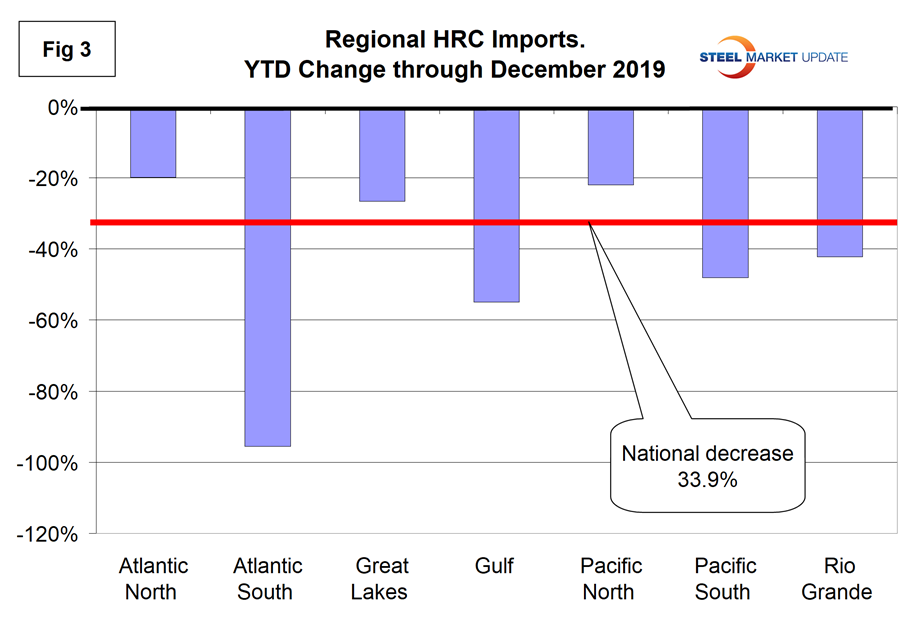
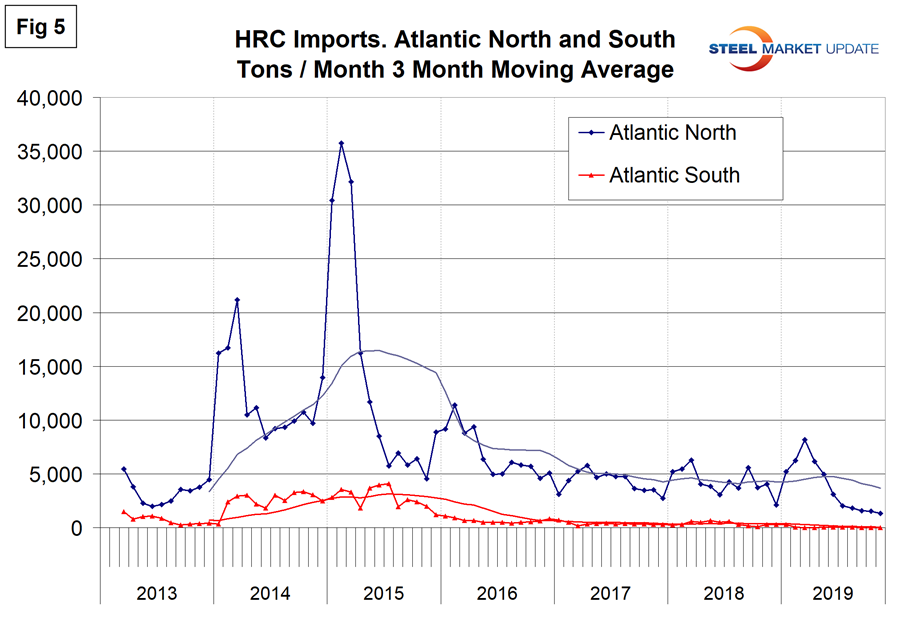
Total hot rolled coil imports, YTD December, were down by 33.9 percent and decreased in all regions, but by widely different percentages. The Atlantic South was down by 95.5 percent and, at the other extreme, the Atlantic North was down by 19.9 percent.
Figure 3 shows the YTD change for each of seven regions and the change at the national level
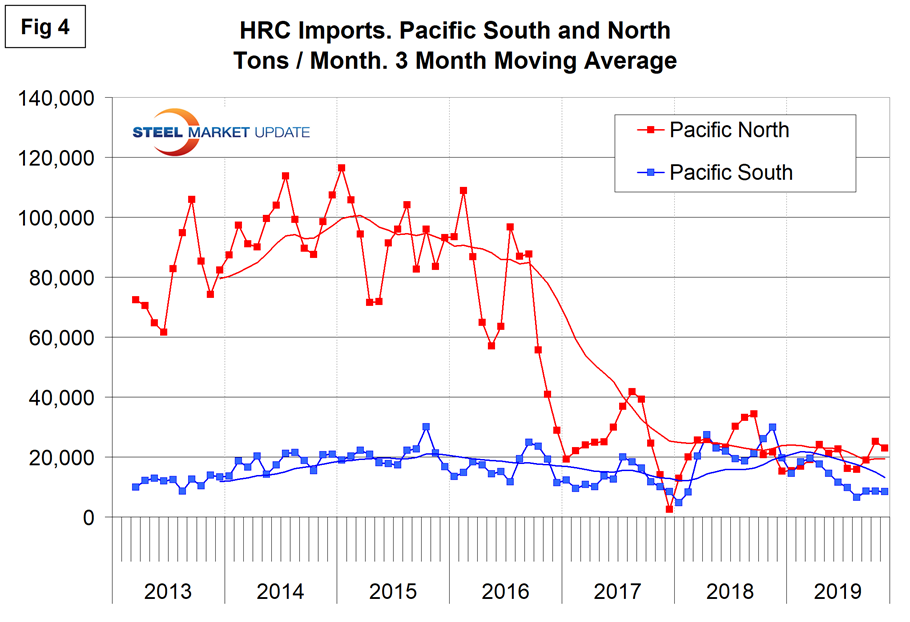
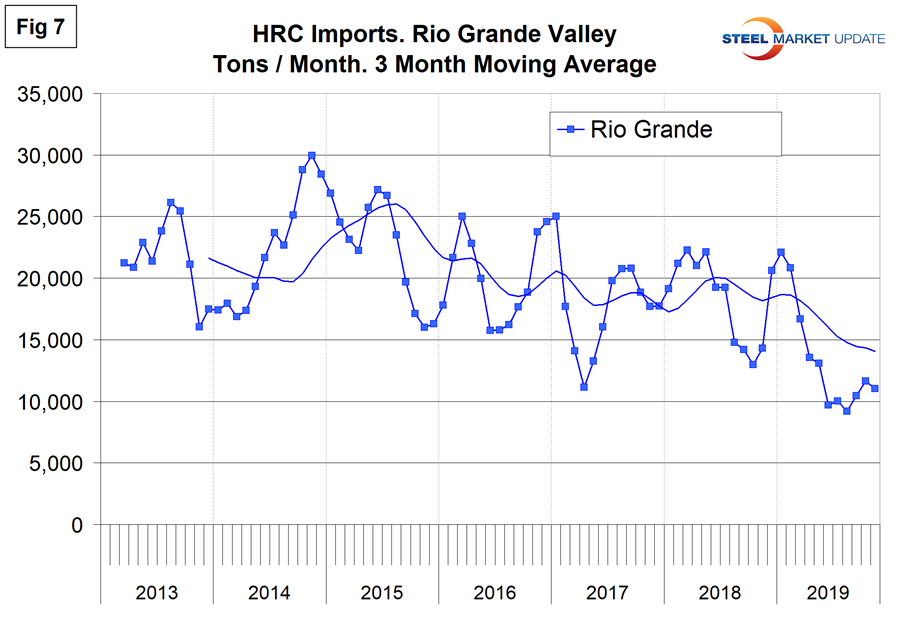
Figures 4, 5, 6 and 7 show the history of hot rolled coil imports by region since March 2013 on a three-month moving average basis. Note, the Y axis scales are not the same.
Regions are compiled from the following districts (we will report on tonnage by district and source nation next month):
Atlantic North: Baltimore, Boston, New York, Ogdensburg, Philadelphia, Portland, St. Albans and Washington, DC.
Atlantic South: Charleston, Charlotte, Miami, Norfolk and Savannah.
Great Lakes: Buffalo, Chicago, Cleveland, Detroit, Duluth, Great Falls, Milwaukee, Minneapolis and Pembina.
Gulf: Houston, New Orleans, Mobile, San Juan, St. Louis and Tampa.
Pacific North: Anchorage, Columbia Snake, San Francisco and Seattle.
Pacific South: Los Angeles and San Diego.
Rio Grande Valley: Laredo and El Paso.