
Prices

June 29, 2020
Flat Rolled Imports by District of Entry and Source Nation Through April 2020
Written by Peter Wright
This analysis breaks down the imported tonnage of six flat rolled products into the district of entry and the source nation, describing in detail what is going on in a company’s immediate neighborhood, thus providing a negotiating advantage in purchasing decisions for Premium subscibers.
Premium members will find reports on our website that break down the import tonnage in 2020 through April into the port of entry and country of origin in metric tons. Products analyzed in this way are HRC, CRC, HDG sheet, OMC sheet, CTL plate and coiled plate.
![]()
This data set is large, therefore we will make no attempt to provide a commentary. Each reader’s interest will be different and he or she simply needs to select one of the six products, then find the nearest port or ports of entry to see how much came into their locality each month and from where. Monthly data is provided back to January 2018. It is clear from these reports and our reports by region that the change in tonnage entering a particular district in most cases is completely different from the change in volume at the national level.
Here are some examples to illustrate why this information can be actionable: hot rolled imports nationally were down by 12 percent year over year through April, but Detroit was up by 38 percent and Houston was down by 82 percent. Cold rolled was down by 27 percent, but within that product group Detroit was up by 38 percent and Buffalo was up by 131 percent. CTL plate was down 52 percent in 2020 through April compared to the same period last year, but Houston was down 84 percent and Detroit was up 21 percent.
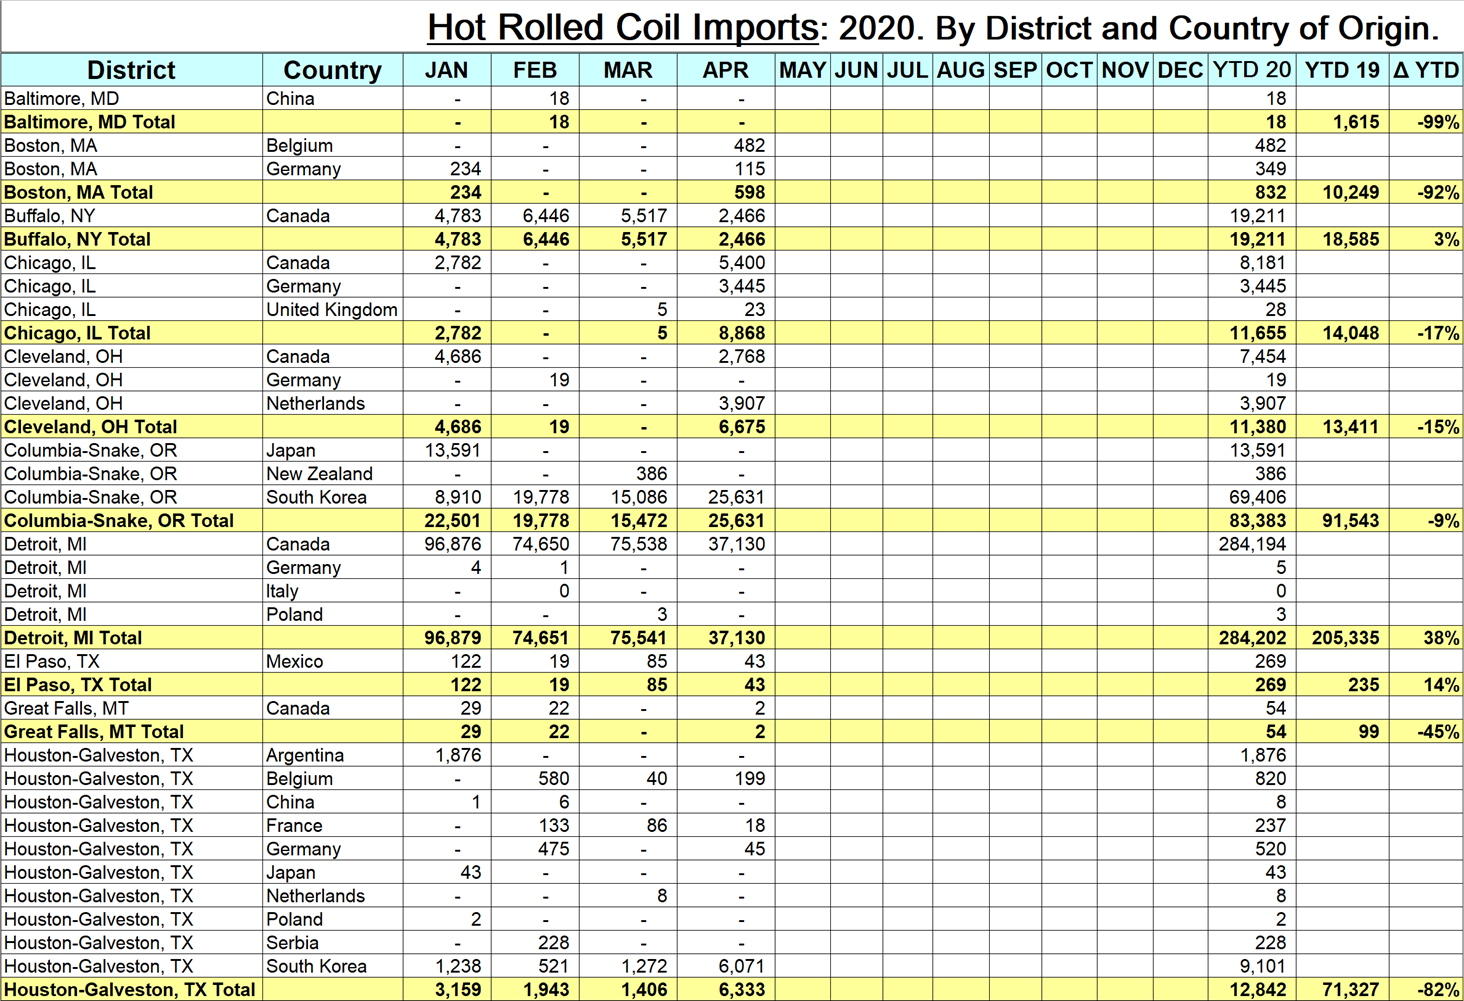
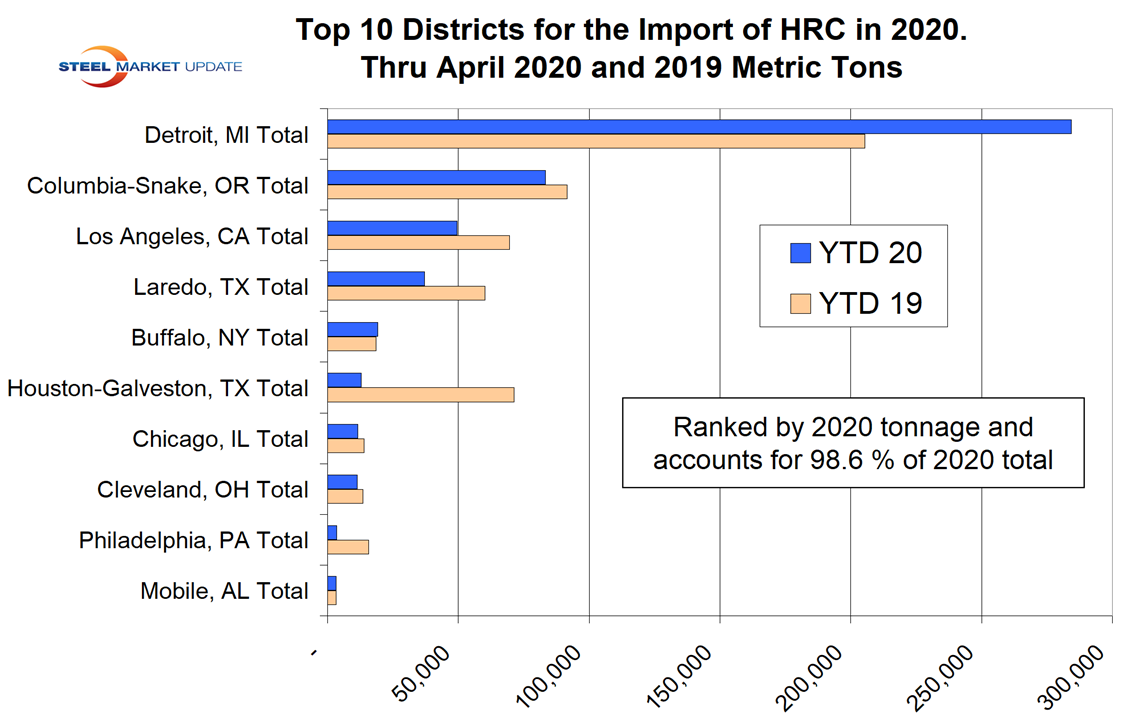
The table included here is a small part of the detailed analysis of the hot rolled sheet tonnage by district of entry and source nation available on our website. The bar graph shows the tonnage of hot rolled sheet that entered the top 10 districts through April year to date for 2019 and 2020 ranked by 2020 tonnage. These 10 districts accounted for 98.6 percent of the total hot rolled sheet tonnage in 2020 through April.
The data in these reports is compiled from tariff and trade data published by the U.S. Department of Commerce and the U.S. International Trade Commission. Our national level import reports are sourced from U.S. Department of Commerce, Enforcement and Compliance, aka the Steel Import Monitoring System. In the development of these reports by district and source country, we have discovered that the SIMA data for HRC and CRC contains some high-alloy steels, such as stainless and tool steel, that have been misclassified at the ports. These alloy steels are not included in our detailed reports, which results in a small discrepancy between the two data sets, for CRC in particular and for HRC to a lesser degree.