

Market Data

June 29, 2020
SMU Energy Analysis for June
Written by Brett Linton
The U.S. Energy Information Administration (EIA) reports that recent declines in demand for petroleum products have led commercial crude oil inventories in the United States to reach an all-time high of 541 million barrels as of the week ending June 19, which is 5 million barrels more than the previous record set in late March 2017.
Spot Prices
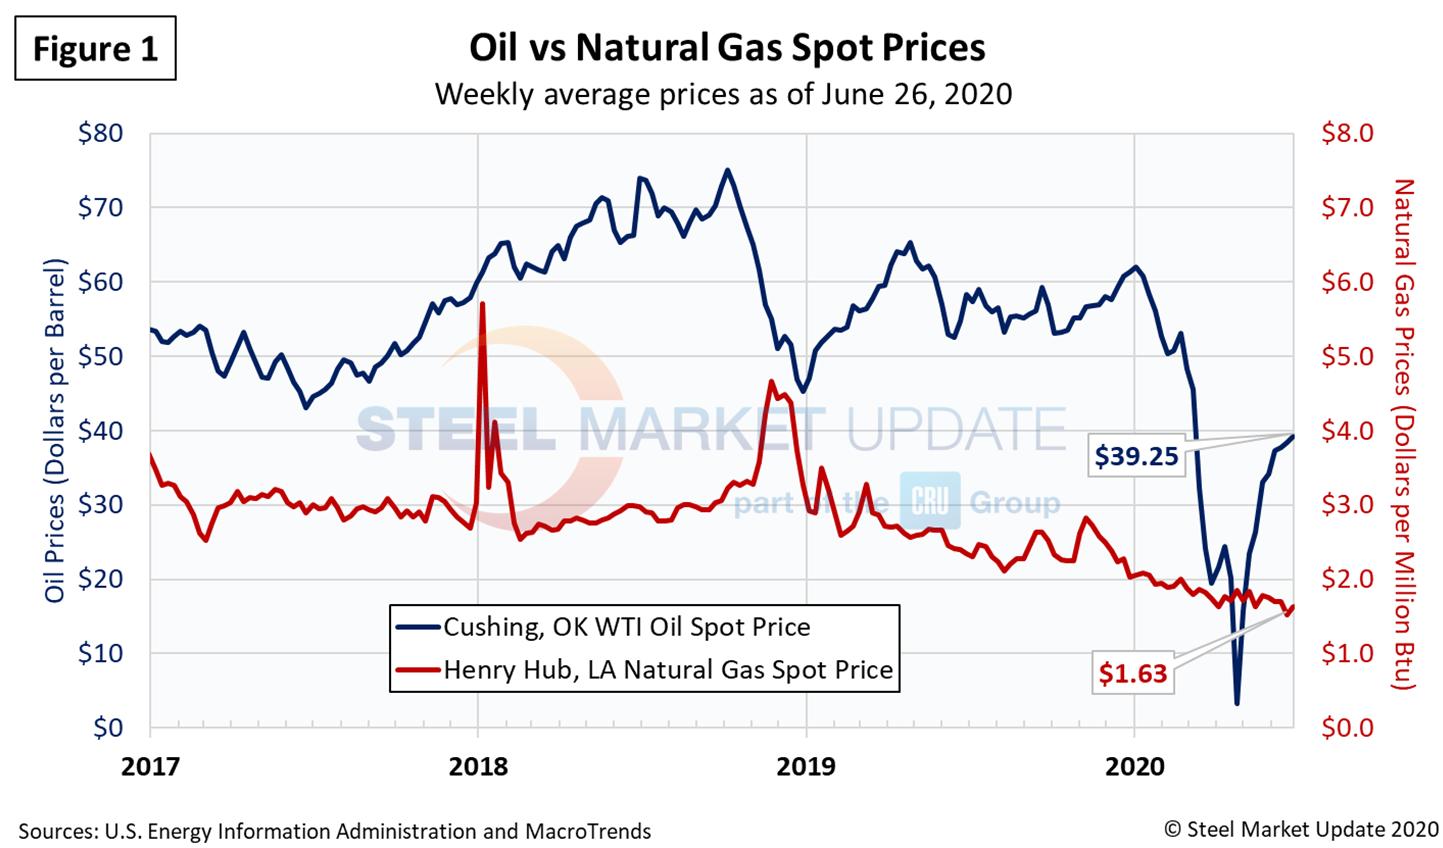
The spot market price for West Texas Intermediate (WTI) has risen steadily since plunging to less than $4 per barrel in late April after the cornonavirus shutdowns to $39.25 per barrel as of June 26. The oil price still has a long way to go to recover to its high for the year at just over $62 per barrel in January (Figure 1). Natural gas at the Henry Hub in Oklahoma was priced at $1.63 per MMBTU (million British Thermal Units) as of June 23, down from just over $2.00 at the beginning of the year. Analysts say the supply overhang, and weakened demand due to the pandemic, are likely to keep downward pressure on oil and gas prices for some time.
Rig Counts
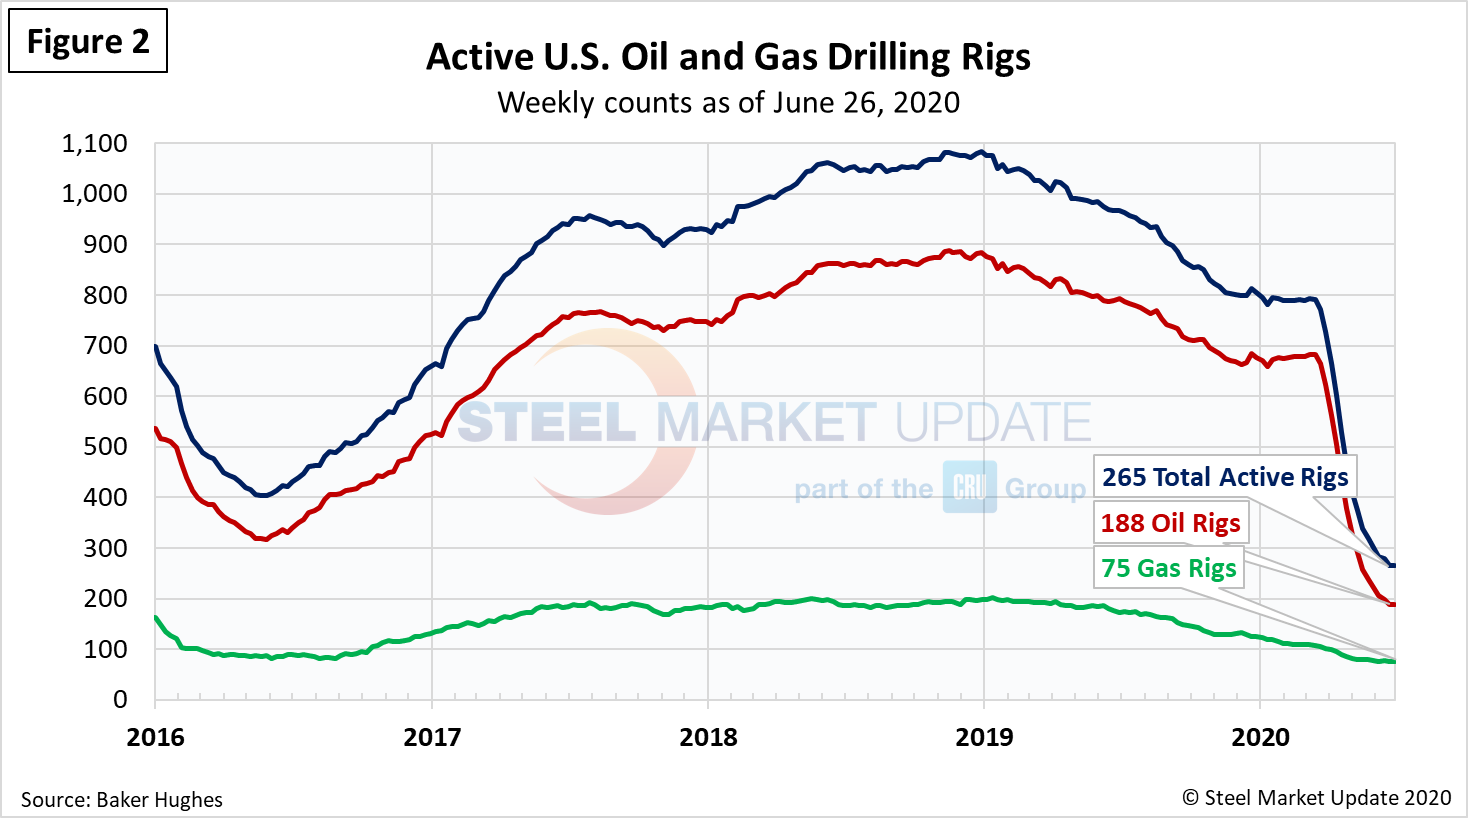
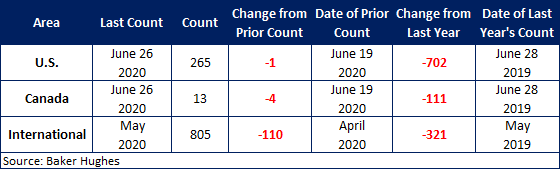
The number of active U.S. rigs drilling for oil and gas fell for the 17th week in a row last week to 265 rigs, including 188 oil rigs, 75 gas rigs and 2 miscellaneous, according to the latest data from Baker Hughes (Figure 2). That’s a decline of nearly 67 percent from the 793 rigs in production in March prior to the coronavirus shutdowns. The table below compares the current U.S., Canada and International rig counts to this time last year.
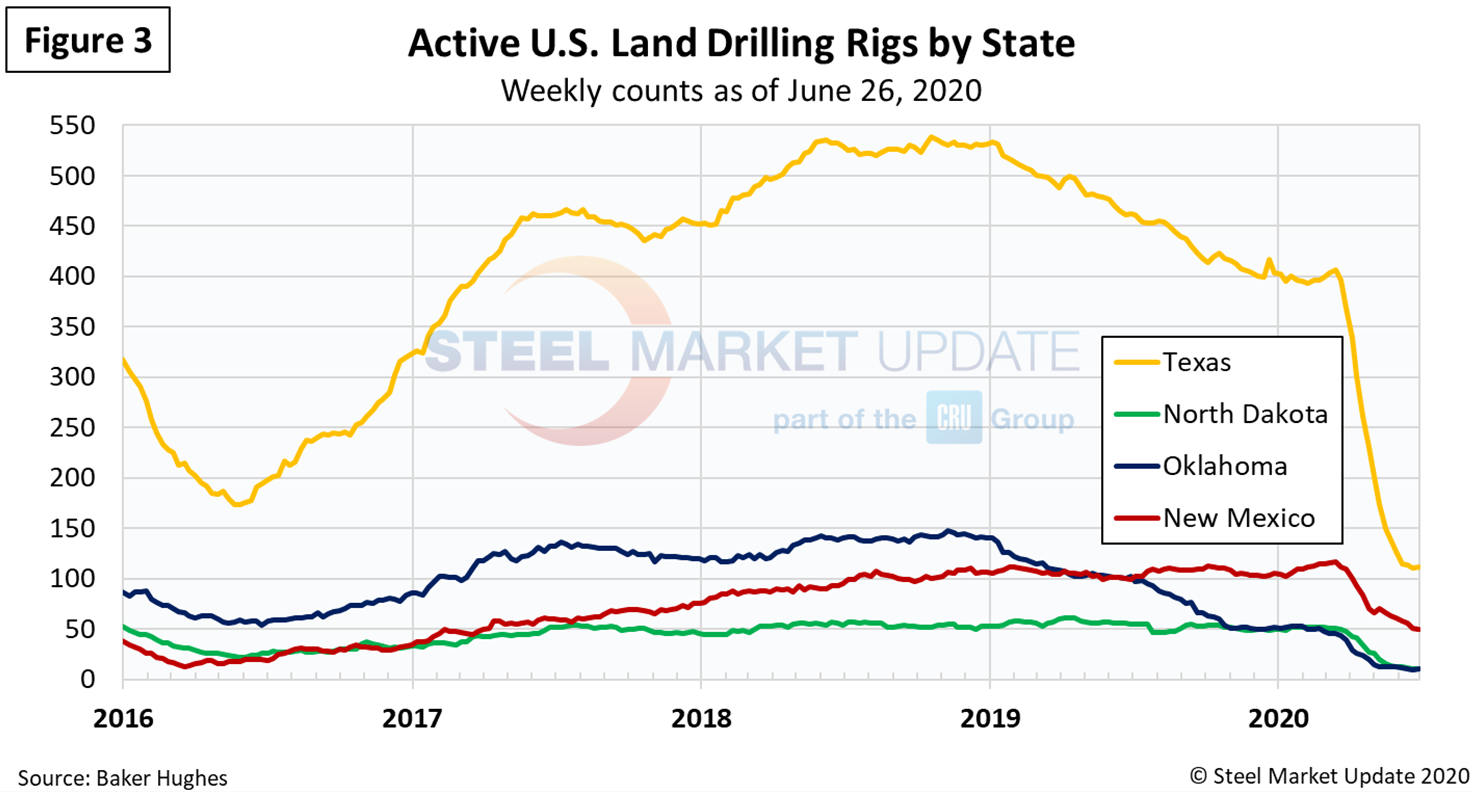
U.S. oil and gas production are heavily concentrated in Texas, Oklahoma, North Dakota and New Mexico, which have all seen declines of more than 70 percent in active drill rigs since mid-March. The rig count in Texas plummeted from 407 in mid-March to 112 on June 26 (Figure 3).
Stock Levels
Total crude oil stocks in the U.S. have been on the rise since the beginning of the year, even before the coronavirus crisis, hitting 1.194 billion barrels as of June 19, up from just over 1 billion barrels at the beginning of the year (Figure 4).
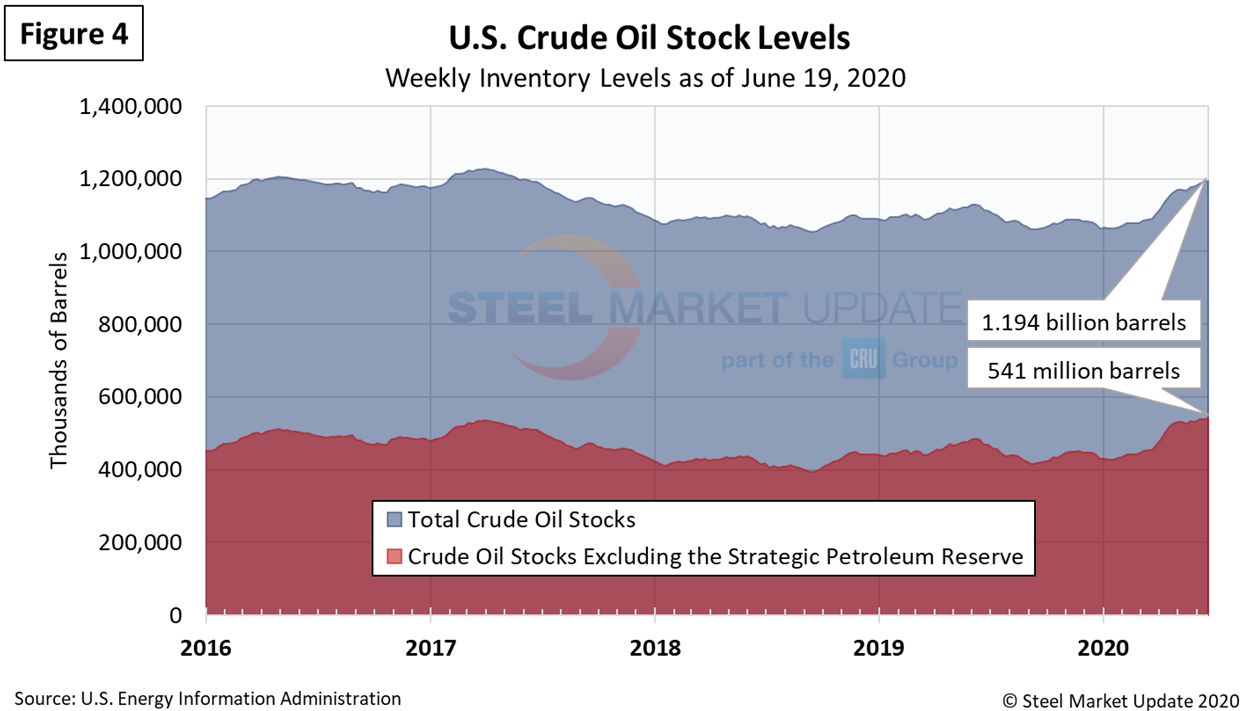
As of June 19, U.S. net commercial crude oil inventories were at 62 percent of total available storage capacity, reports the EIA. The majority of capacity and inventories are located in the Gulf Coast, a region which is also home to the majority of U.S. refining capacity and a key area for exporting crude oil. Commercial Gulf Coast crude oil inventories have increased by 63 million barrels since March 13 and are now at an all-time record of 249 million barrels. Crude oil storage capacity utilization in Cushing, Okla., had increased to 83 percent of capacity as of the week ending May 1, but it declined to 58 percent on June 19. Storage considerations were among the reasons that West Texas Intermediate (WTI) crude oil prices—which are based on physical delivery of WTI crude oil at Cushing, briefly dropped below zero on April 20-21.


