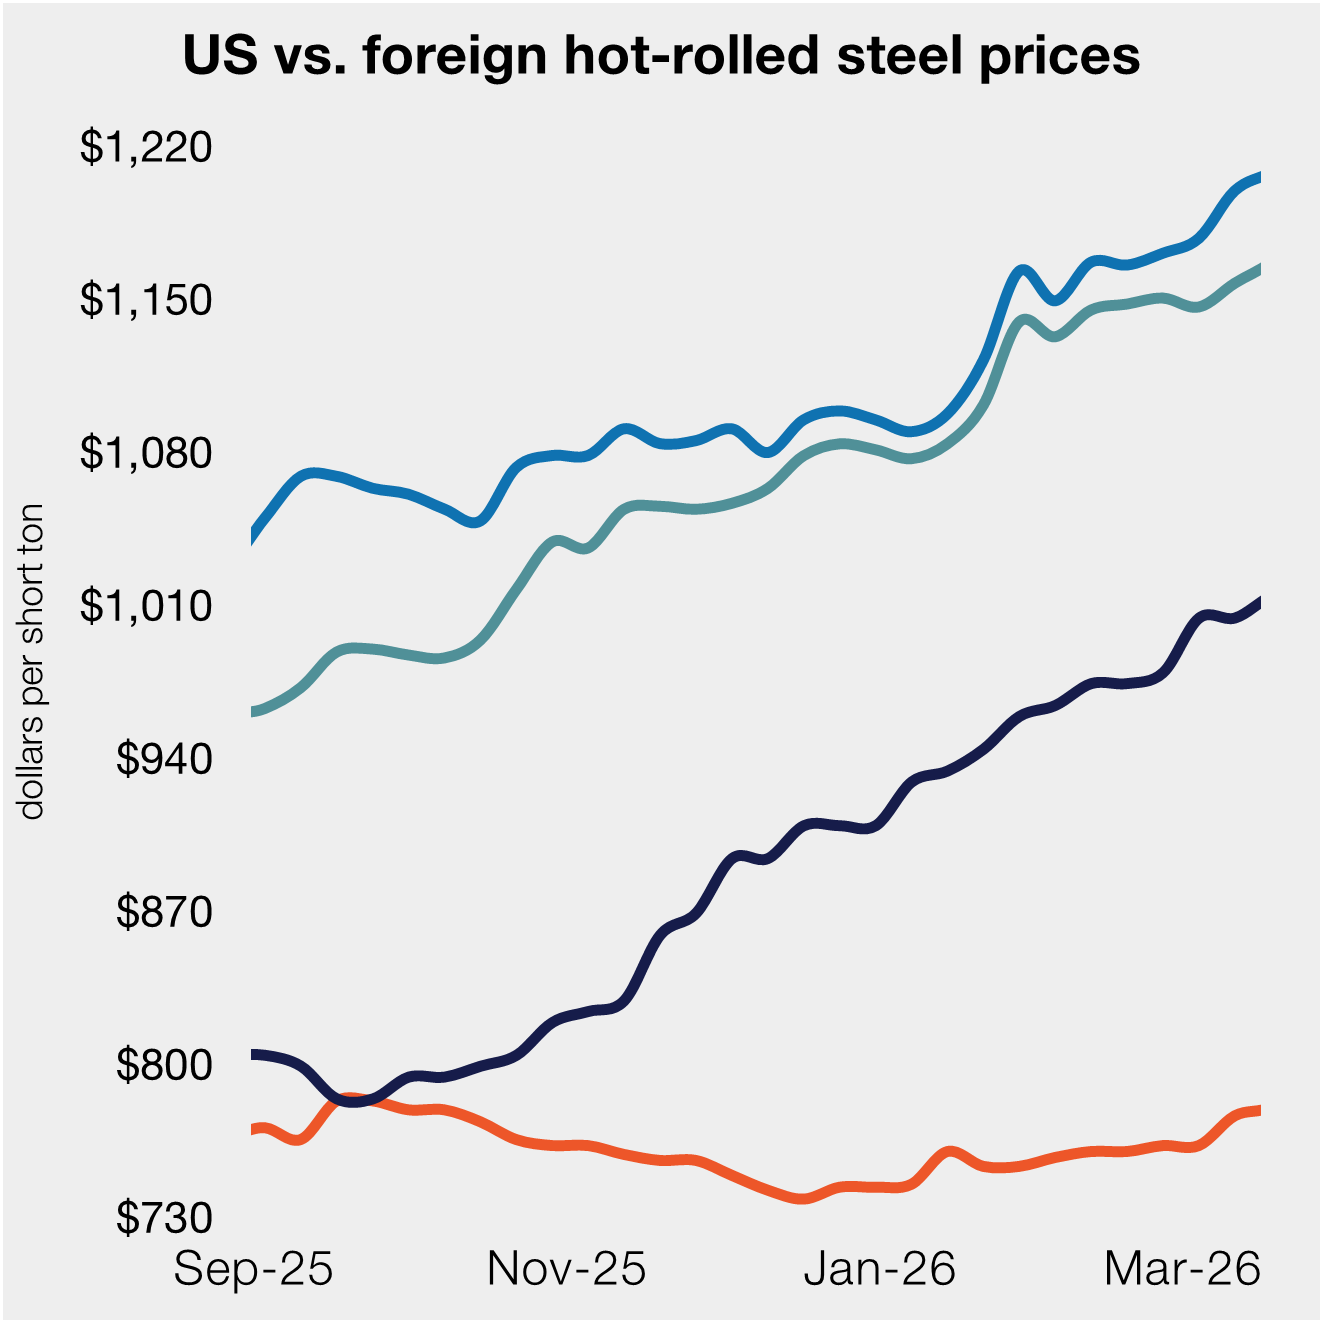
Prices

September 16, 2020
Regional Imports Through July: Hot Rolled Coil
Written by Peter Wright
National level import reports do a good job of measuring the overall market pressure caused by the imports of individual products. The downside is that there are huge regional differences. This report examines hot rolled coil imports by region through July 2020.
![]()
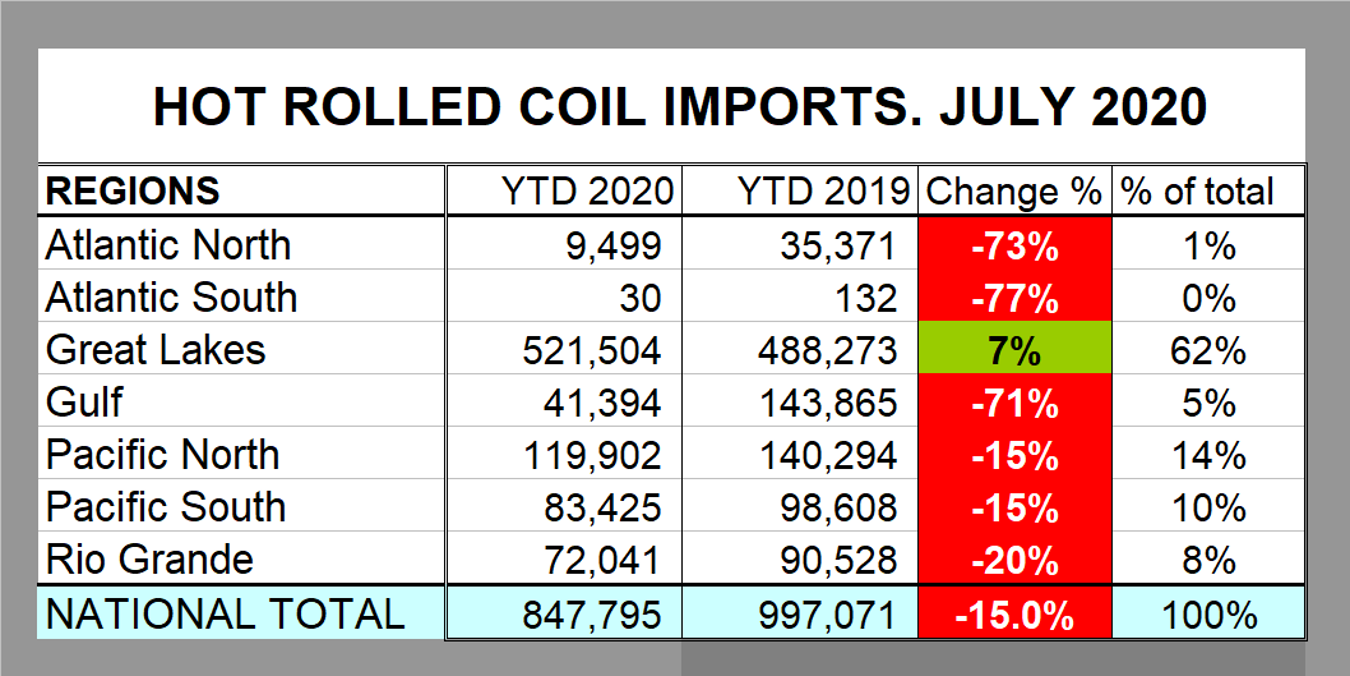
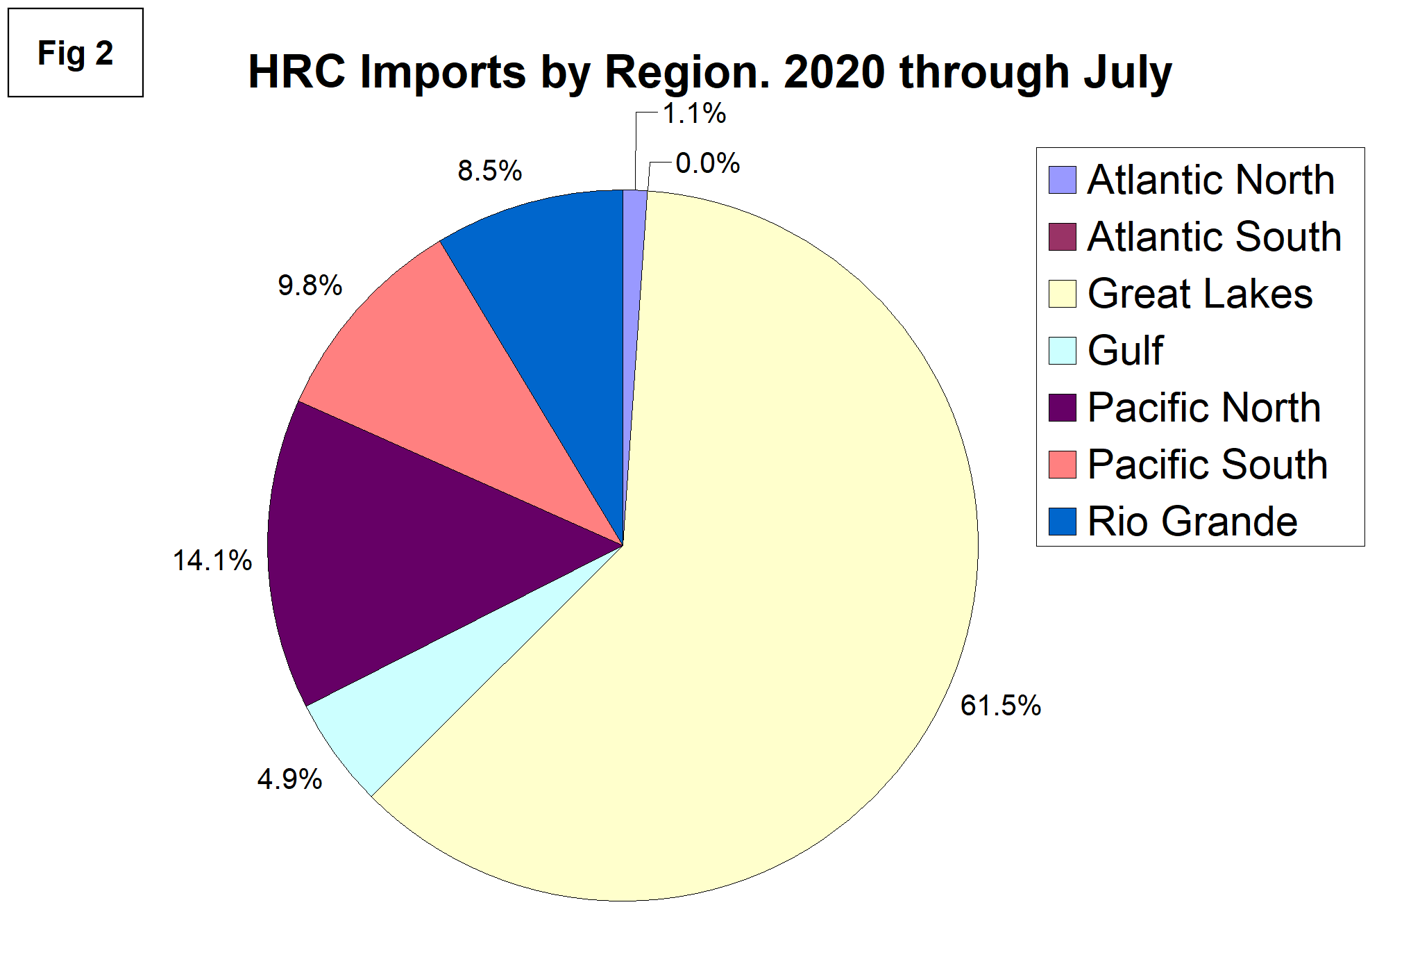
In July, hot rolled imports were down by 15.0 percent at the national level, but on a regional basis ranged from a 73 percent decline in the North Atlantic ports to an increase of 7 percent in the Great Lakes region. The Great Lakes receives by far the most tonnage and accounts for 62 percent of the national total. Tonnage into the whole Atlantic coast is minimal.
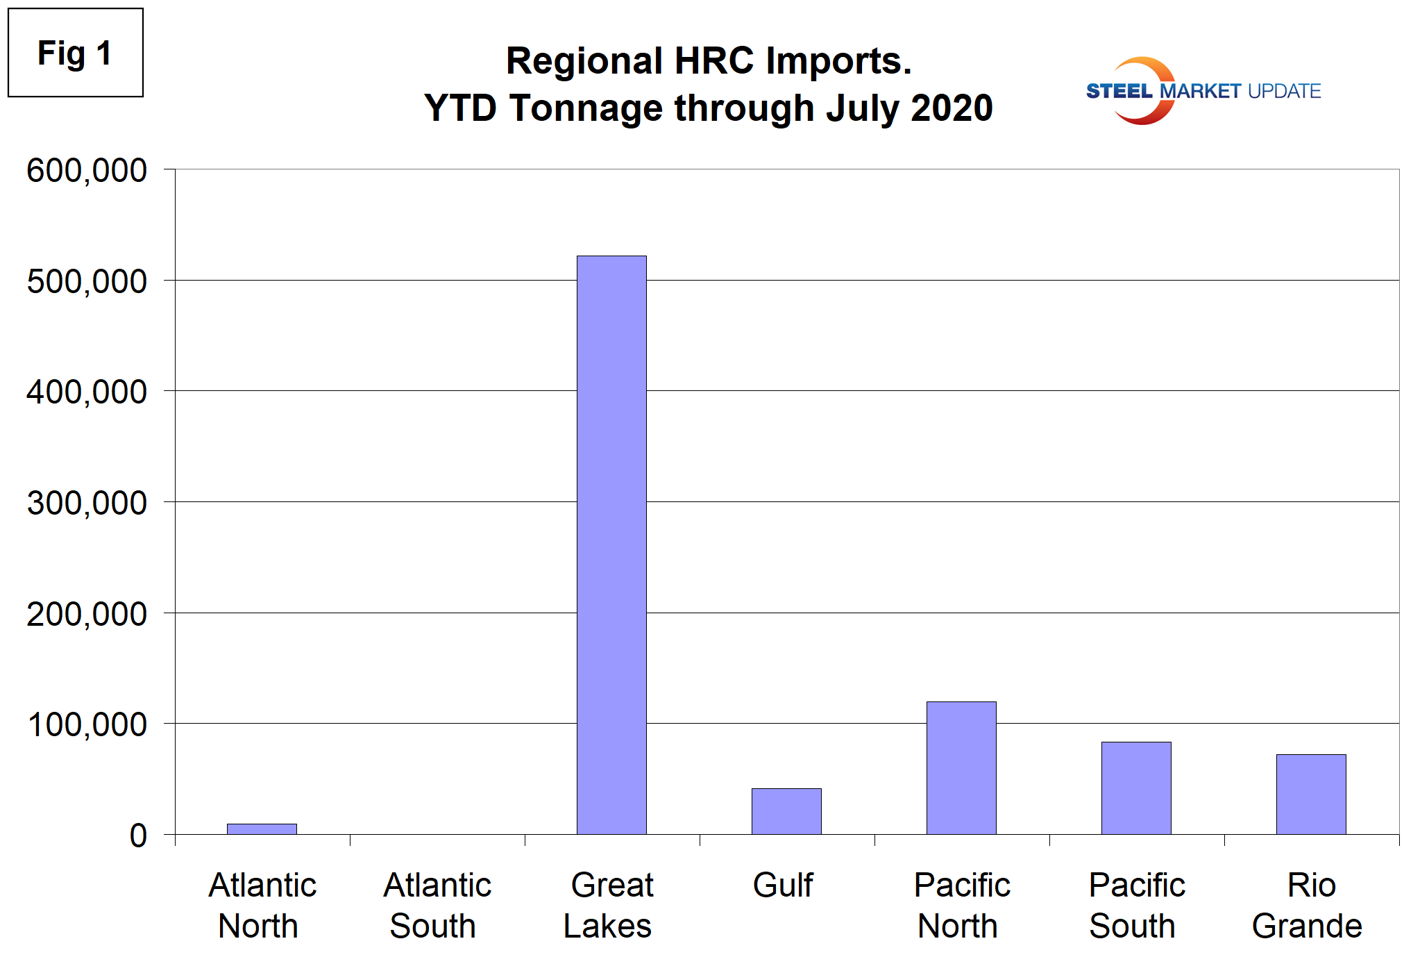
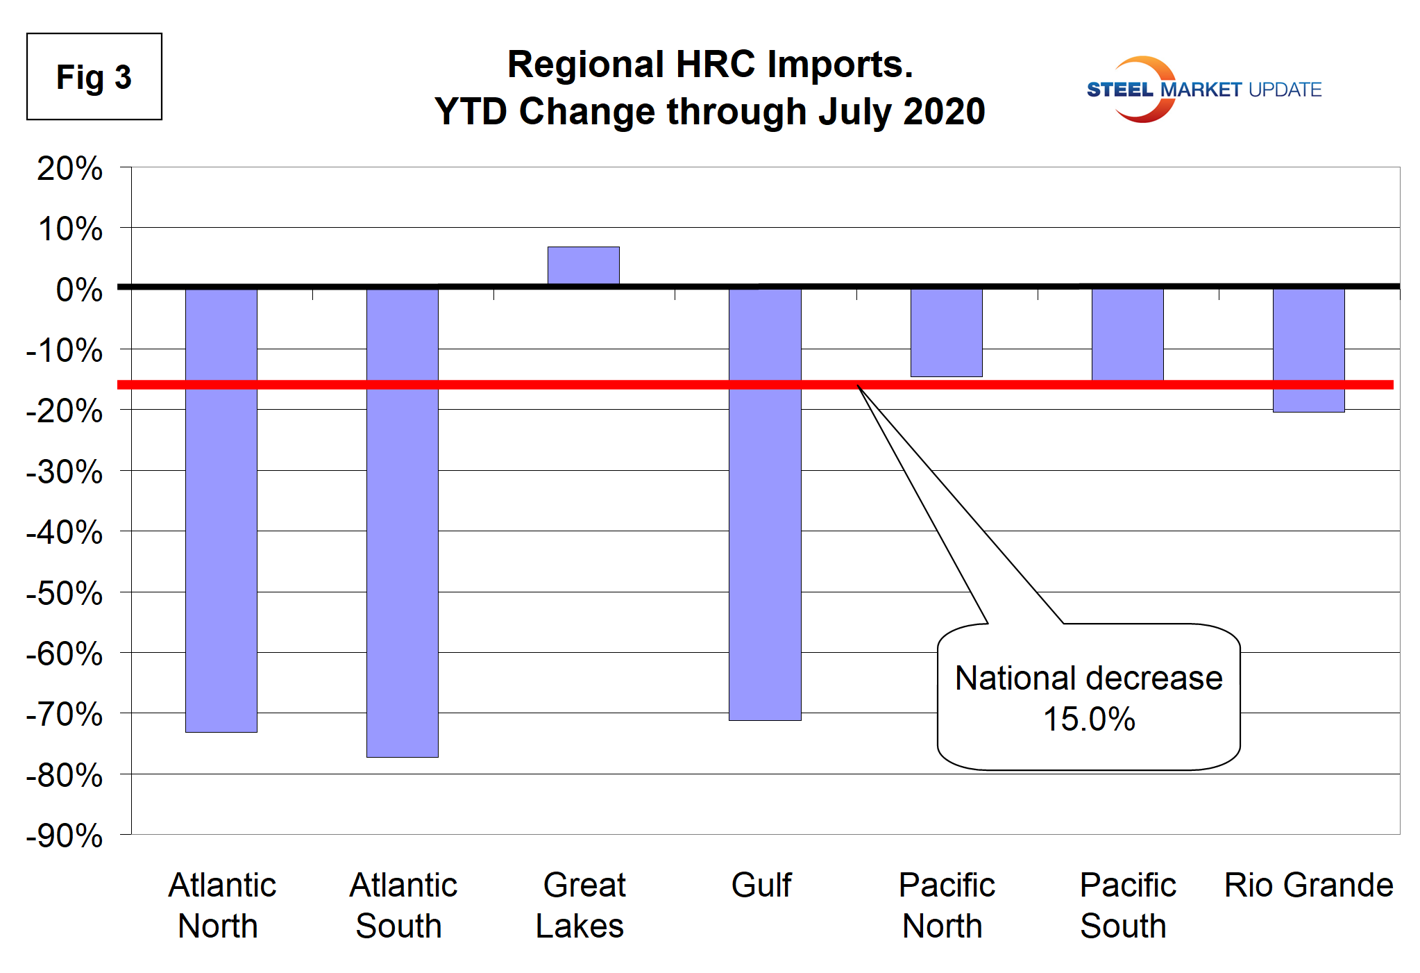
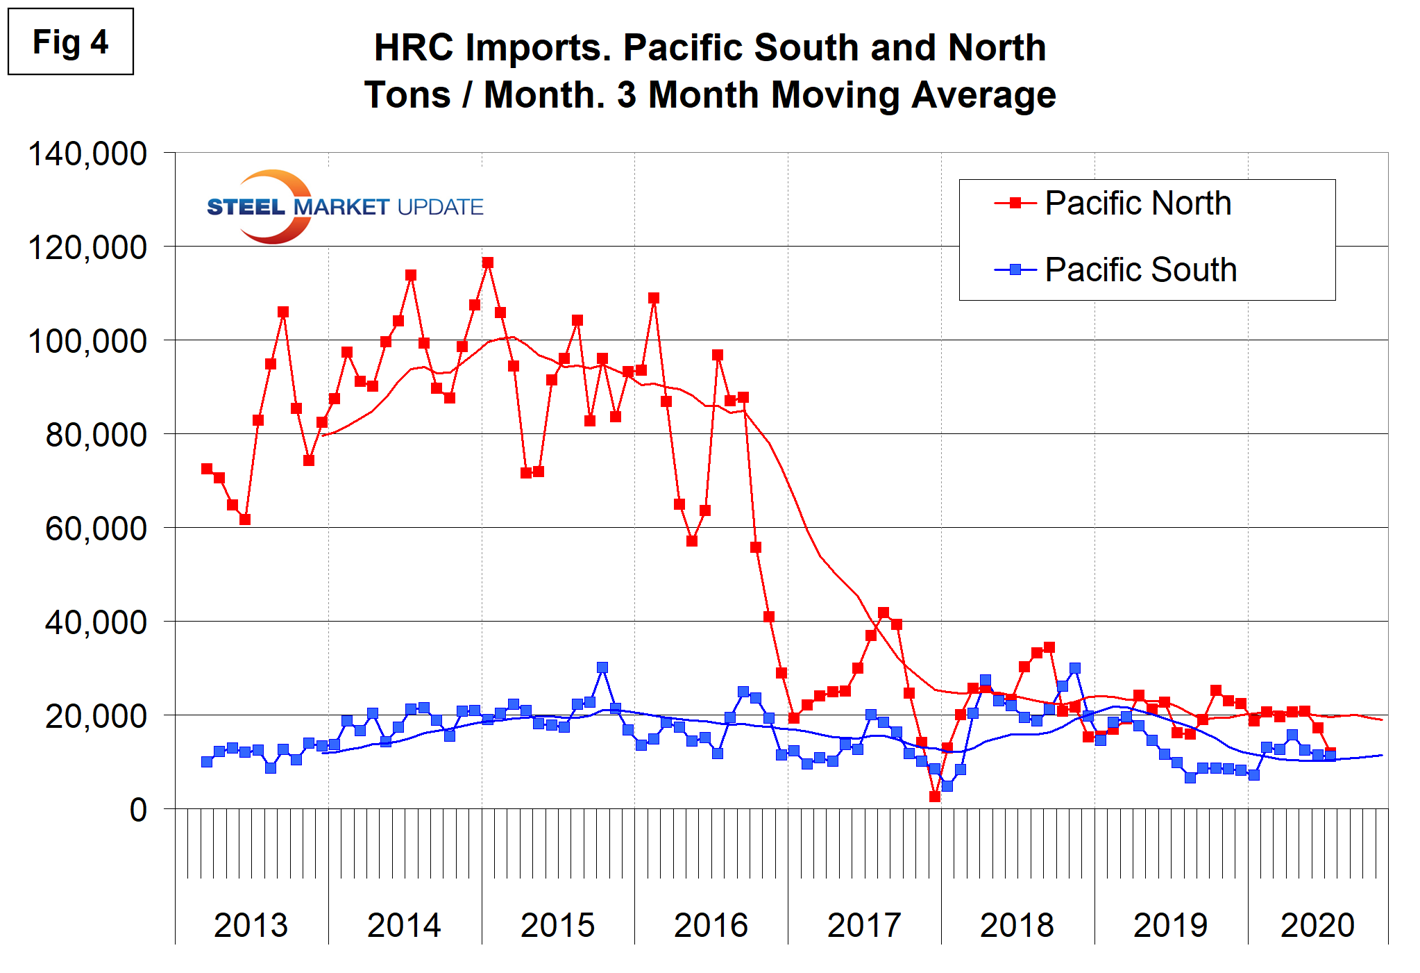
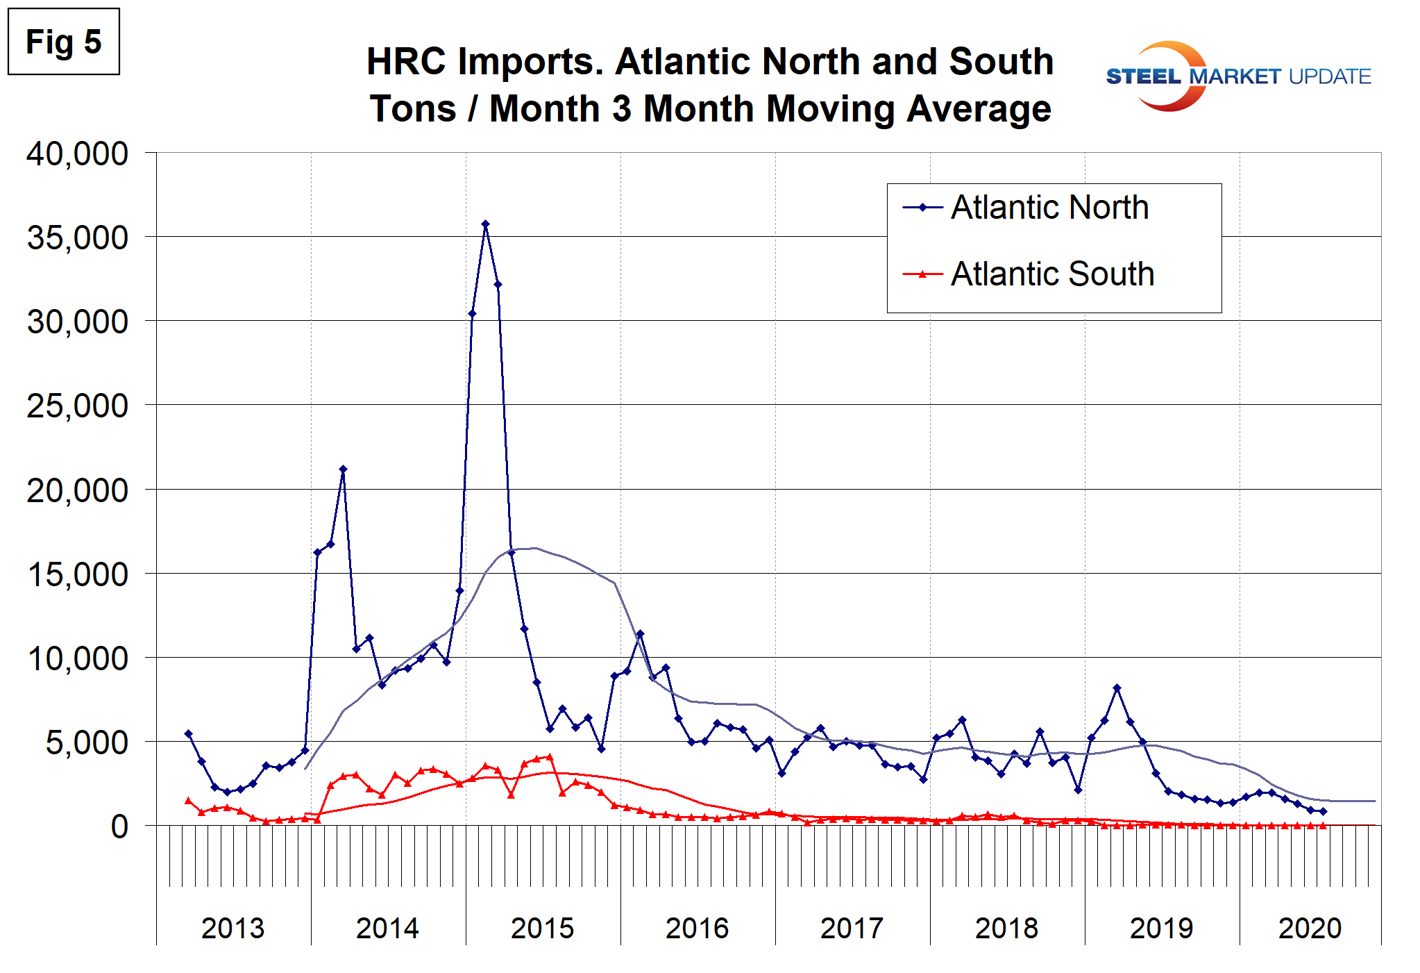
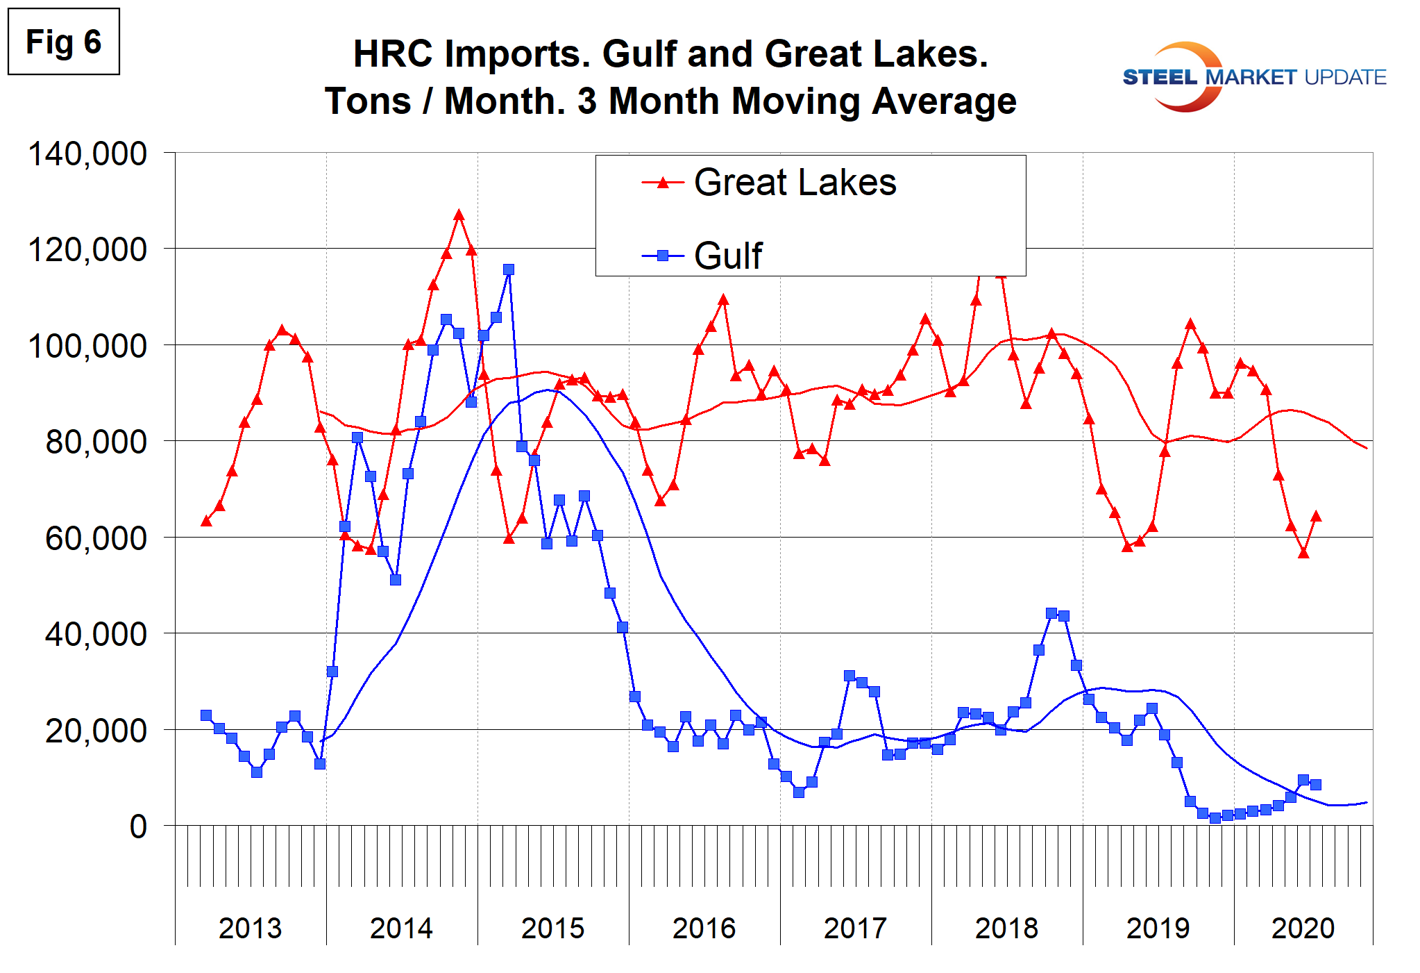
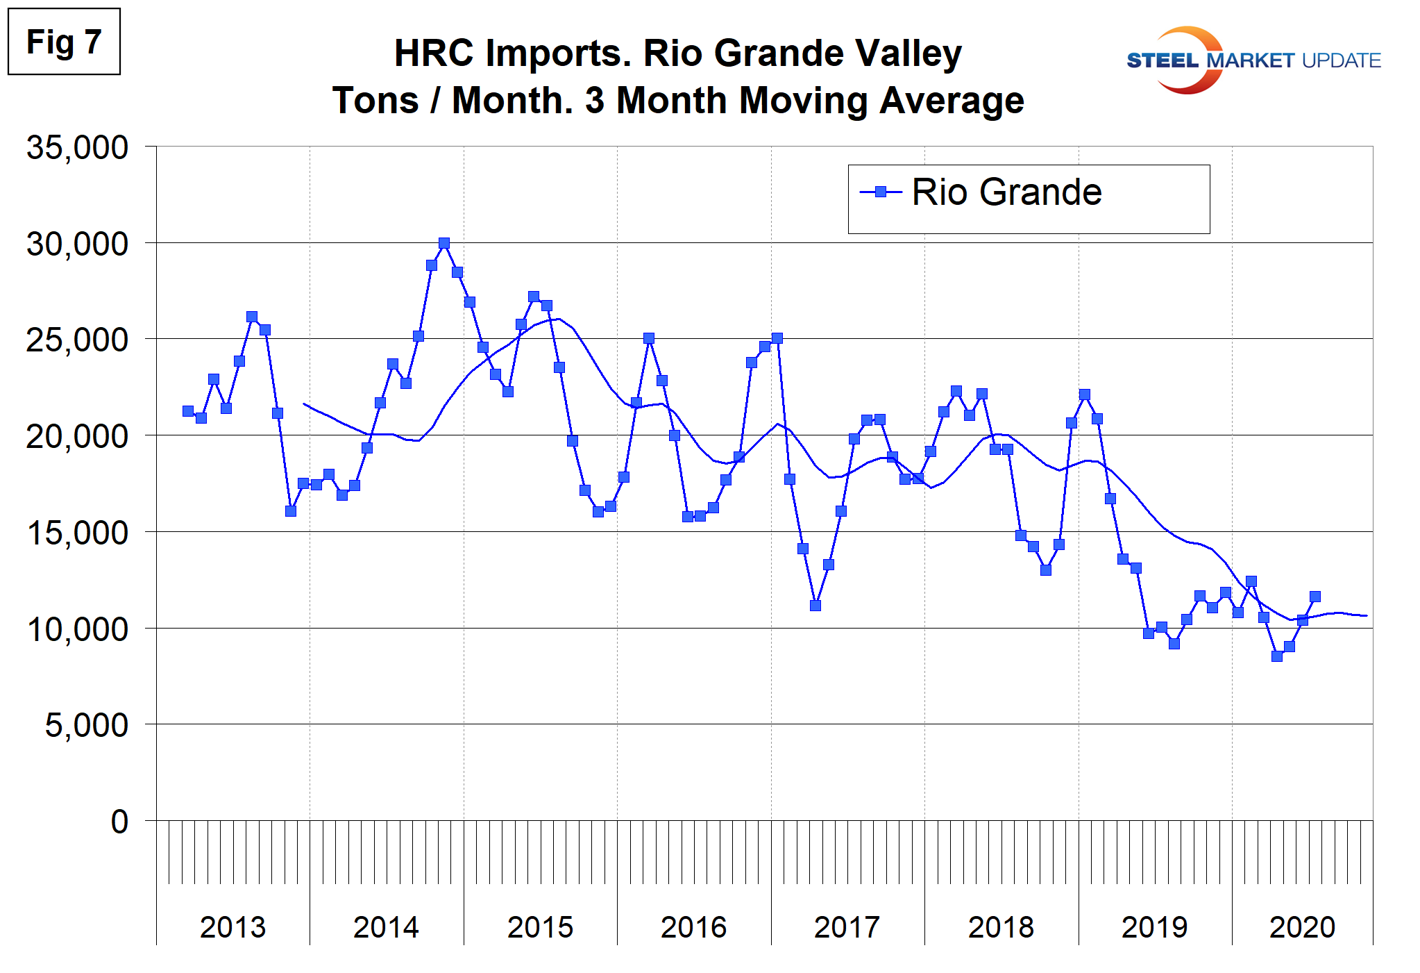
Note the tonnage scales on the Y axis of Figures 4-7 are not the same.
Pacific Coast: Hot rolled tonnage into the North and South Pacific ports has been similar since March 2018 and through July accounted for 14 percent and 10 percent of the total, respectively.
Atlantic Coast: The HRC tonnage into the North Atlantic has been gradually declining since February 2016 and had fallen to 9,499 tons through July. Tonnage into the South Atlantic has been virtually zero since December 2015.
Gulf and Great Lakes: HRC tonnage into the Gulf has declined by 71 percent in the first seven months of 2020 compared to last year and through July accounted for only 5 percent of the national total. The Great Lakes had the highest volume in three months through July and is the only region to have an increased volume this year.
Rio Grande: Tonnage across the river has been fairly stable for the last 14 months and year to date has accounted for 8 percent of the national total.
Notes: SMU presents a comprehensive series of import reports ranging from the first look at licensed data to a detailed look at volume by district of entry and source nation. The report you are reading now is designed to plug the gap between these two. This report breaks total year to date import tonnage of six flat rolled products into seven regions and the growth/contraction for each product and region. There is a summary table for each product group and a bar chart showing volume by region for the first seven months of 2020. These are reference documents with no specific comments. These charts have been developed as a guide for buyers and sellers to have a broader understanding of what’s going on in their own backyard.
Regions are compiled from the following districts:
Atlantic North: Baltimore, Boston, New York, Ogdensburg, Philadelphia, Portland ME, St. Albans and Washington. DC.
Atlantic South: Charleston, Charlotte, Miami, Norfolk and Savannah.
Great Lakes: Buffalo, Chicago, Cleveland, Detroit, Duluth, Great Falls, Milwaukee, Minneapolis and Pembina.
Gulf: Houston, New Orleans, Mobile, San Juan, St. Louis and Tampa.
Pacific North: Anchorage, Columbia Snake, San Francisco and Seattle.
Pacific South: Los Angeles and San Diego.
Rio Grande Valley: Laredo and El Paso.