Market Data

October 30, 2020
BEA: Regional GDP Growth Through Q2 2020
Written by Peter Wright
In most regions in Q2 2020, gross domestic product, as reported by the states, declined by more than the nationally reported number.
The Bureau of Economic Analysis (BEA) reports GDP by state and region on a quarterly basis. This data is released several weeks after the national report, but the BEA has committed to getting it out quicker in future. The latest data was updated through Q2 2020. Even though this might be considered historically “old,” we think it’s worth reporting because it’s the foundation for where we are now and shows how badly the pandemic hit the various regions. The data is reported in chained 2012 dollars seasonally adjusted.
![]()
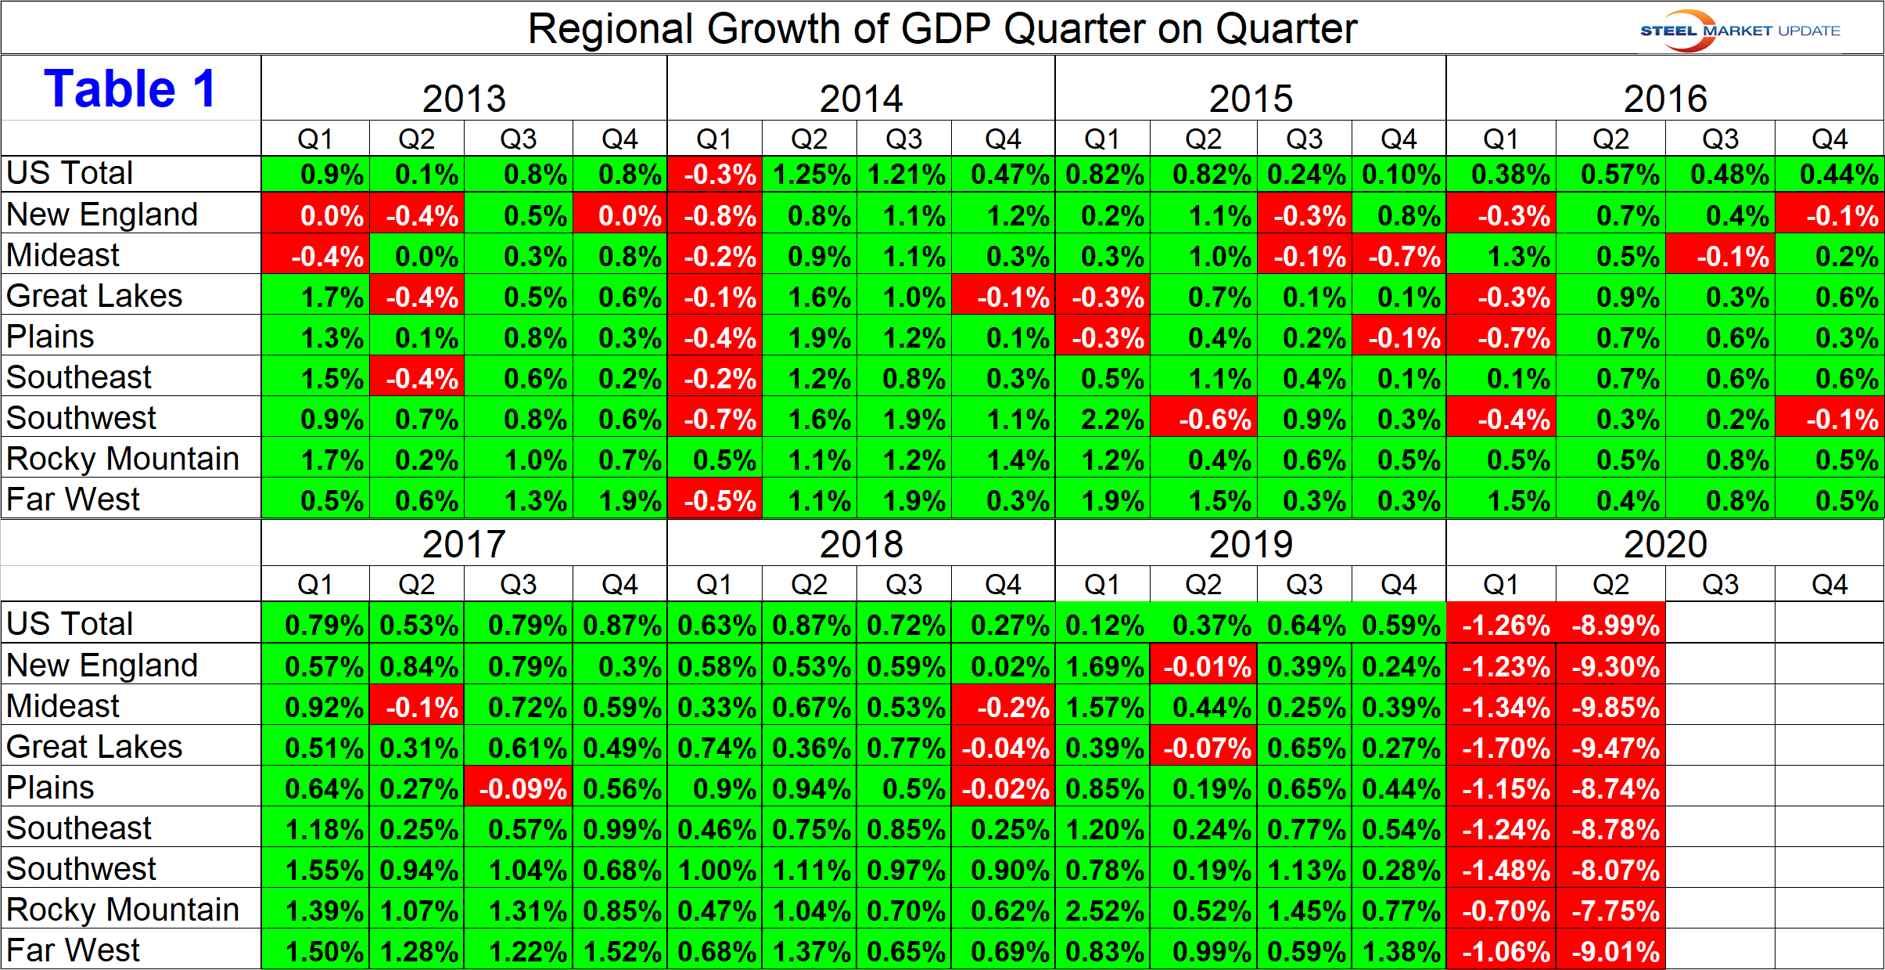
Steel Market Update analyzes the regional data and reports to subscribers quarterly. Table 1 shows the growth of regional GDP quarter on quarter. (These growth numbers are not annualized, as opposed to the headline number for the growth of national GDP. Annualized means multiplied by four.) In Q2 2020, the regions all had a similar contraction ranging from -7.75 percent in the Rocky Mountains to -9.85 percent in the Mid East.
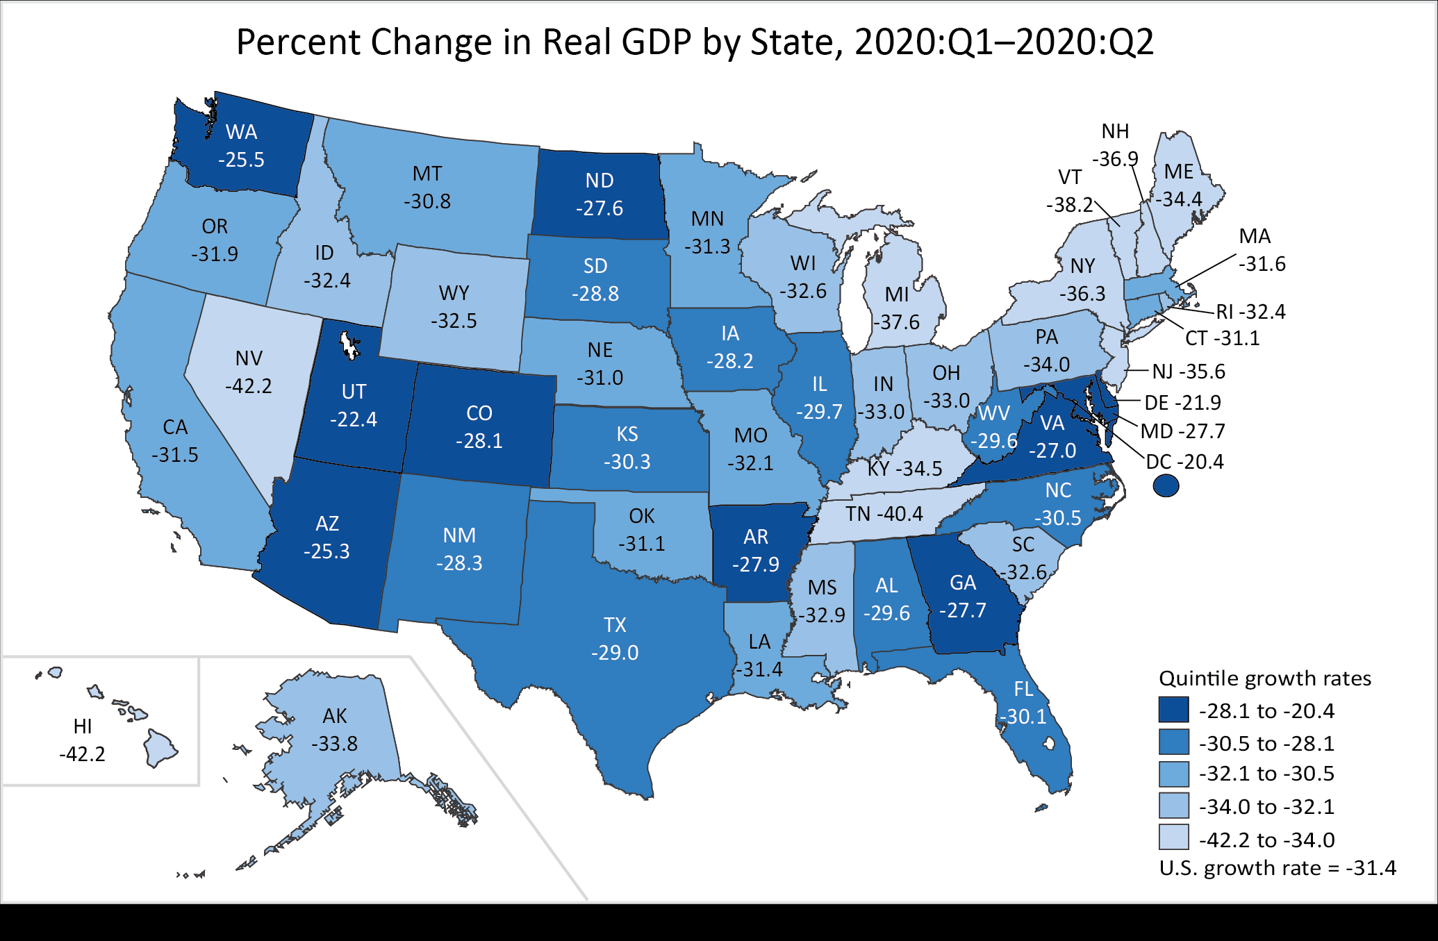
The BEA publishes a color coded map of the United States showing annualized quarter-over-quarter growth of GDP by state within each region. There were big differences between individual states with the following all exceeding negative 10 percent (40 percent annualized): Kentucky, Maine, Michigan, Nevada, New Hampshire, New Jersey, New York, Tennessee, and Vermont. The best performing states were Delaware at 6.0 percent and Utah at 6.13 percent.
Regions as defined by the BEA are as follows:
New England: Connecticut, Maine, Massachusetts, New Hampshire, Rhode Island, Vermont.
Mid East: Delaware, DC, Maryland, New Jersey, New York, Pennsylvania.
Great Lakes: Illinois, Indiana, Michigan, Ohio, Wisconsin.
Plains: Iowa, Kansas, Minnesota, Missouri, Nebraska, North Dakota, South Dakota.
South East: Alabama, Arkansas, Florida, Georgia, Kentucky, Louisiana, Mississippi, North Carolina, South Carolina, Tennessee, Virginia, West Virginia.
South West: Arizona, New Mexico, Oklahoma, Texas
Rocky Mountain: Colorado, Idaho, Montana, Utah, Wyoming.
Far West: Alaska, California, Hawaii, Nevada, Oregon, Washington.
Table 2 shows the GDP in millions of dollars annualized for the U.S. in total and for each of the eight regions as defined by the BEA. GDP is the value of the goods and services produced less the value of the goods and services consumed in each period. The South East region has the highest total GDP and the Rocky Mountains the lowest. This ranking is not qualitative; it is a function of how the BEA defines regions, which unfortunately does not quite correspond to how the Bureau of Labor Statistics defines regions for employment purposes.
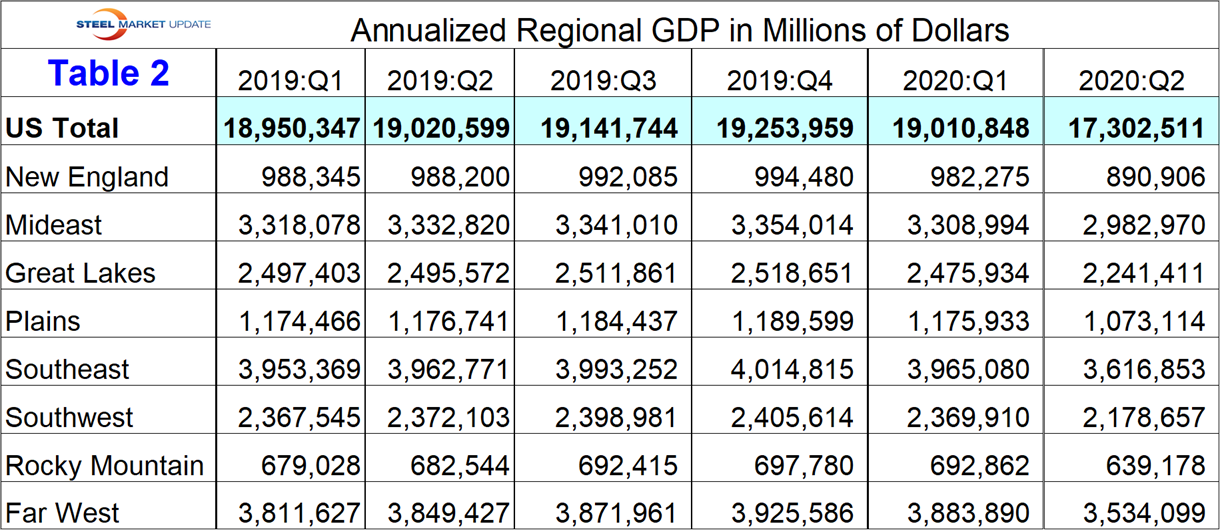
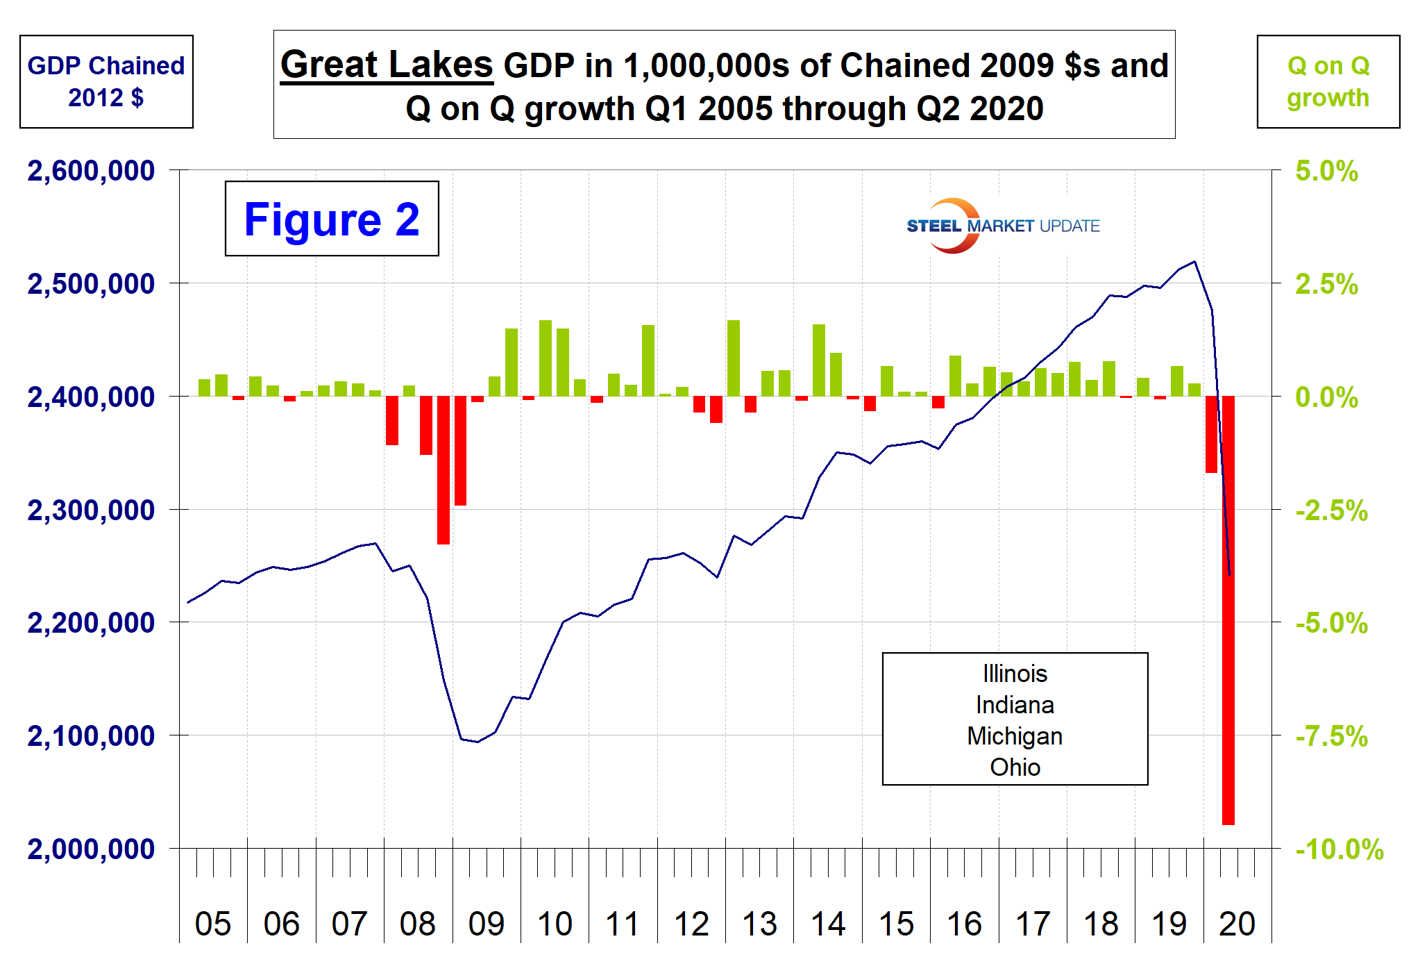
Figure 2 shows subscribers an example of the GDP graphs available on request for all regions and individual states. This example shows the results for the Great Lakes region, which in the second quarter had an annualized economic output of $2.2 trillion.
In addition to this report of regional GDP, we publish quarterly reports of regional job creation and regional imports. Our intention with these three reports is to help subscribers determine whether their business is subject to headwinds or tailwinds in the regions where they operate.
The U.S. total GDP values are slightly higher than the sum of the regional totals in this report because the GDP-by-state numbers exclude federal military and civilian activity located overseas (because it cannot be attributed to a particular state). In addition, the official headline quarterly report of national GDP is annualized, which increases the value by a factor of four.