

Prices

November 16, 2020
Regional Imports Through September: Cold Rolled Coil
Written by Peter Wright
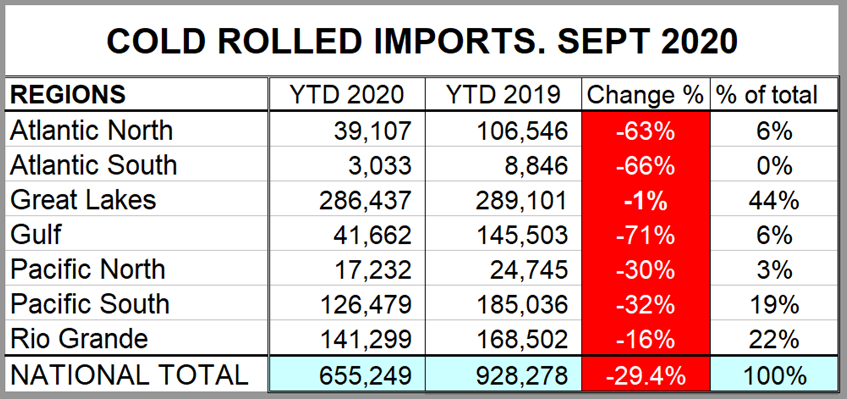
National level import reports do a good job of measuring the overall market pressure caused by the imports of individual products. The downside is that there are huge regional differences. This report examines cold rolled coil imports by region through September 2020.
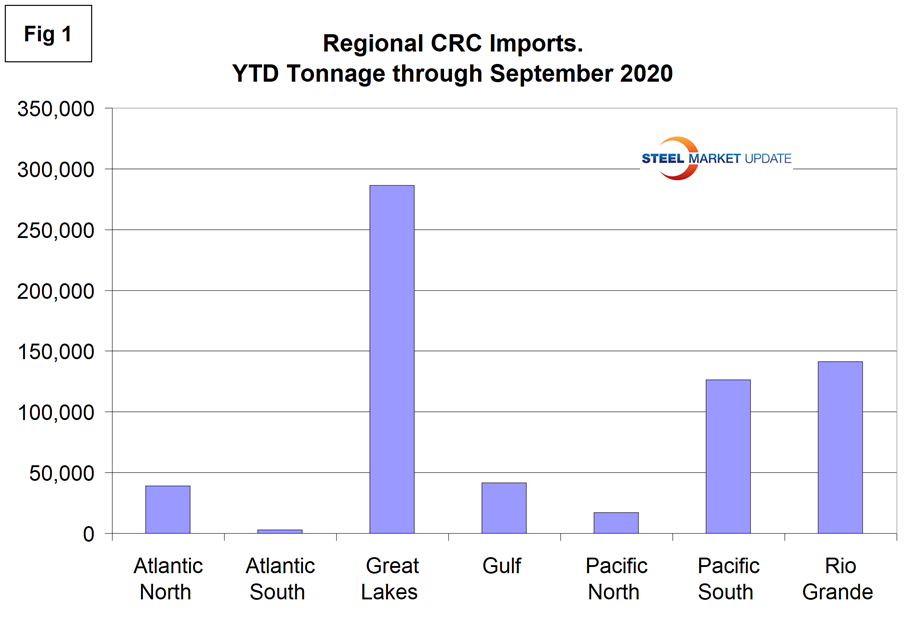
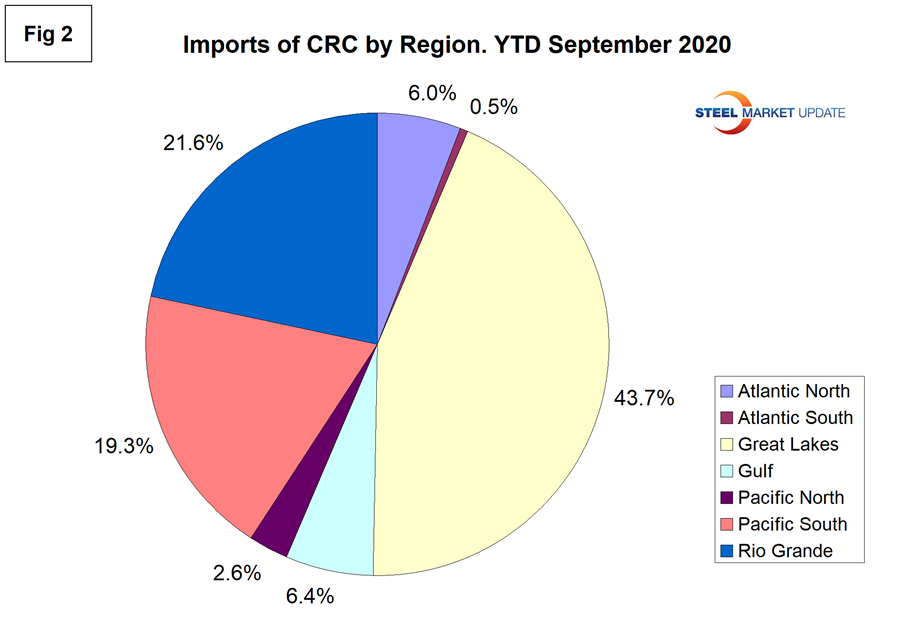
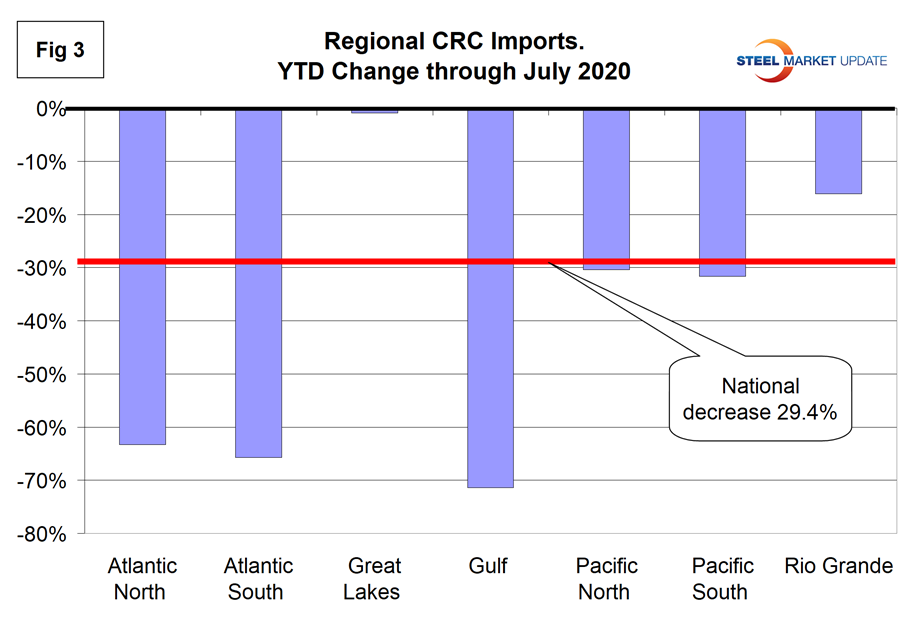
In September year to date, cold rolled imports were down by 13.8 percent at the national level, but on a regional basis ranged from a 66 percent decline in the North Atlantic ports to a 1.0 percent decline in the Great Lakes region. The Great Lakes receives by far the most tonnage and accounts for 44 percent of the national total. Tonnage into the South Atlantic and North Pacific is minimal.
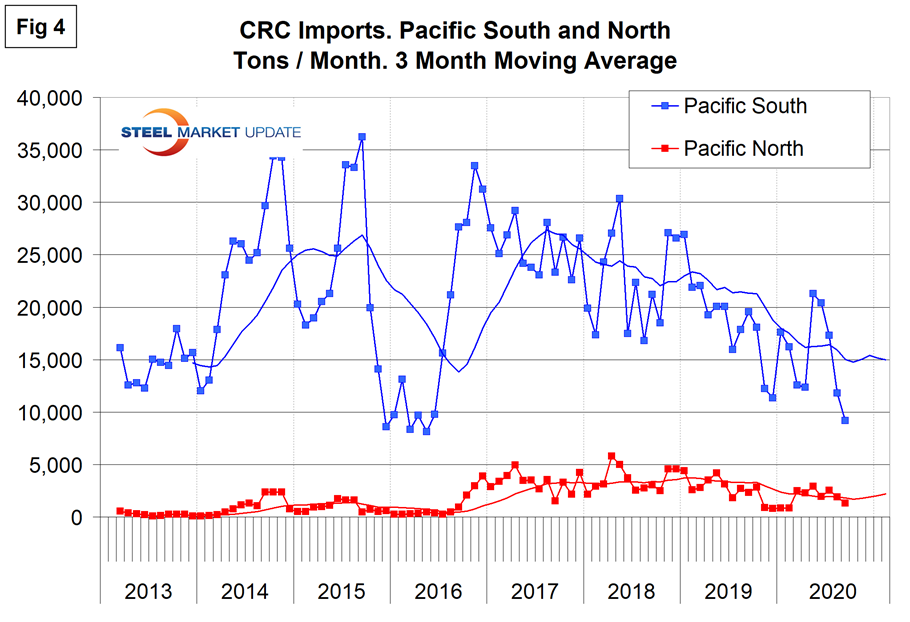
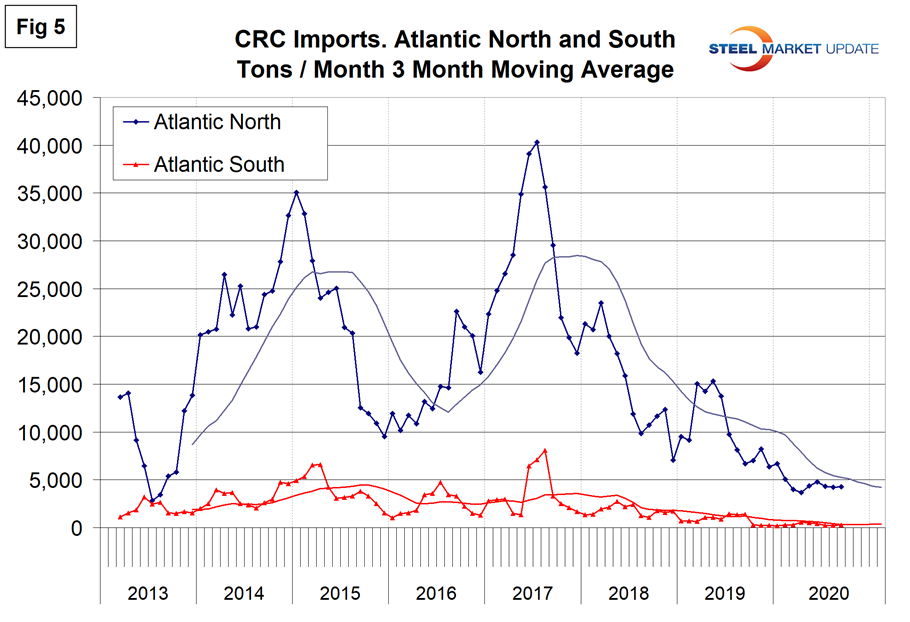
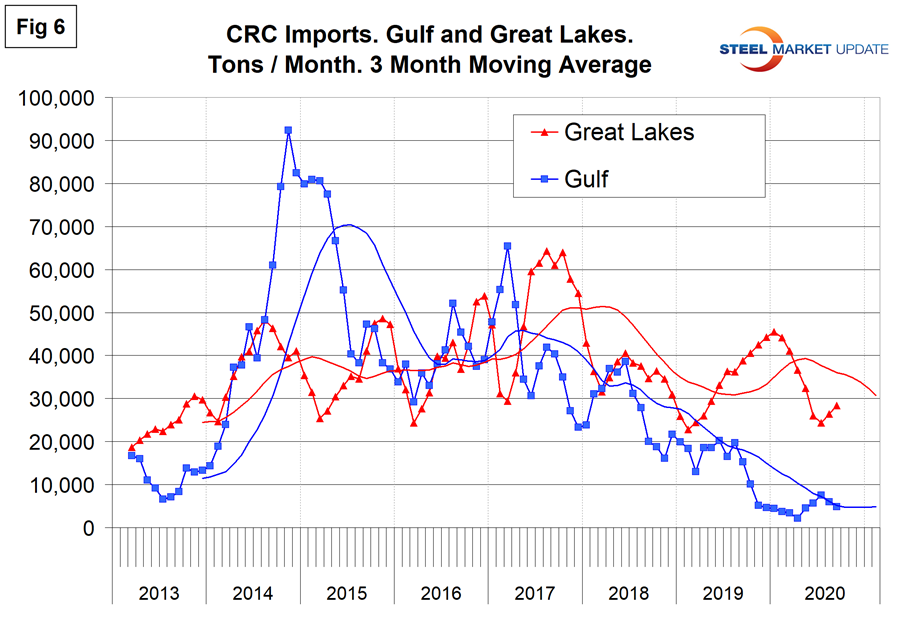
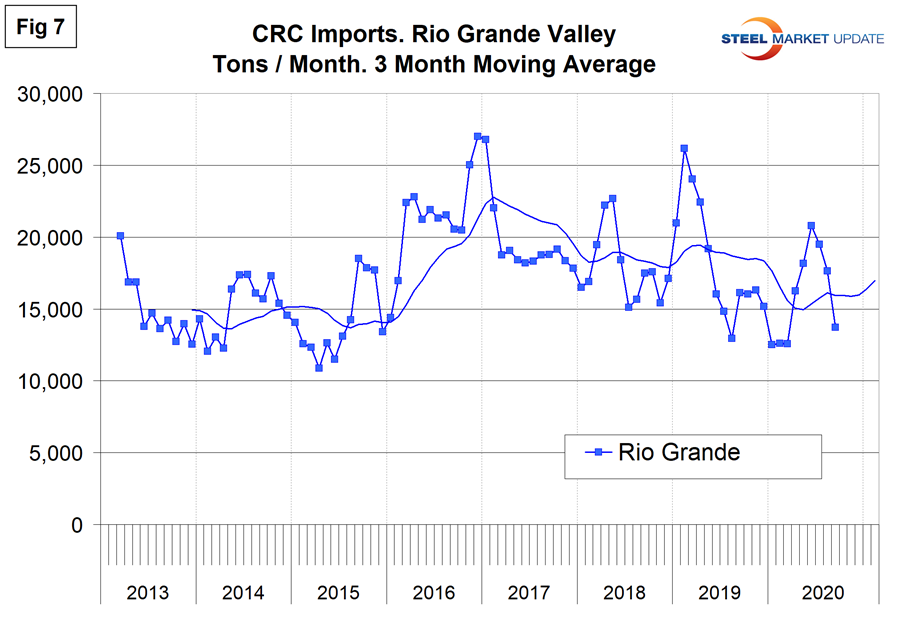
Note the tonnage scales on the Y axis of Figures 4-7 are not the same.
Pacific Coast: The tonnage into the South Pacific ports has been declining since November 2016. There was a sharp increase in May 2020, which partially gave back in June and September. There has never been much tonnage into the North Pacific.
Atlantic Coast: The tonnage into the North Atlantic reached 40,000 tons in September 2017, but year-to-date September has been less than 30,000 tons. Tonnage into the South Atlantic is virtually zero.
Gulf and Great Lakes: Both these regions have been on the decline since 2017. The Great Lakes recovered steadily in 2019, but this year has declined every month. The Gulf almost reached zero in April 2020.
Rio Grande: Tonnage declined in 2019 and has recovered in 2020. Thought the first nine months of the year, this has been the second highest volume region.
Notes: SMU presents a comprehensive series of import reports ranging from the first look at licensed data to a detailed look at volume by district of entry and source nation. The report you are reading now is designed to plug the gap between these two. This report breaks total year to date import tonnage of six flat rolled products into seven regions and the growth/contraction for each product and region. There is a summary table for each product group and a bar chart showing volume by region for the first seven months of 2020. These are reference documents with no specific comments. These charts have been developed as a guide for buyers and sellers to have a broader understanding of what’s going on in their own backyard.
Regions are compiled from the following districts:
Atlantic North: Baltimore, Boston, New York, Ogdensburg, Philadelphia, Portland ME, St. Albans and Washington. DC.
Atlantic South: Charleston, Charlotte, Miami, Norfolk and Savannah.
Great Lakes: Buffalo, Chicago, Cleveland, Detroit, Duluth, Great Falls, Milwaukee, Minneapolis and Pembina.
Gulf: Houston, New Orleans, Mobile, San Juan, St. Louis and Tampa.
Pacific North: Anchorage, Columbia Snake, San Francisco and Seattle.
Pacific South: Los Angeles and San Diego.
Rio Grande Valley: Laredo and El Paso.


