Prices

November 16, 2020
Regional Imports Through September: Hot Dipped Galvanized
Written by Peter Wright
National level import reports do a good job of measuring the overall market pressure caused by the imports of individual products. The downside is that there are huge regional differences. This report examines hot-dipped galvanized imports by region through September 2020.
![]()
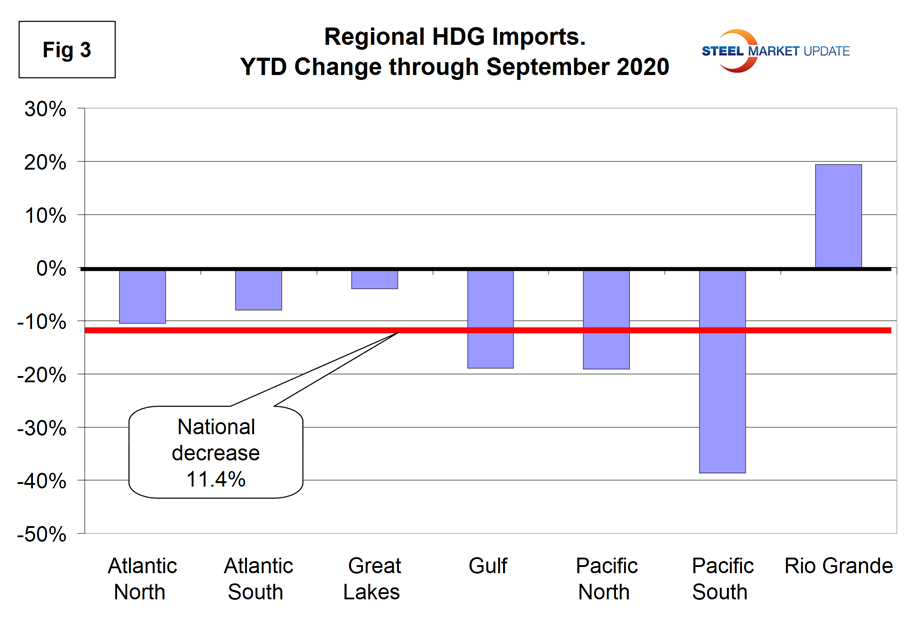
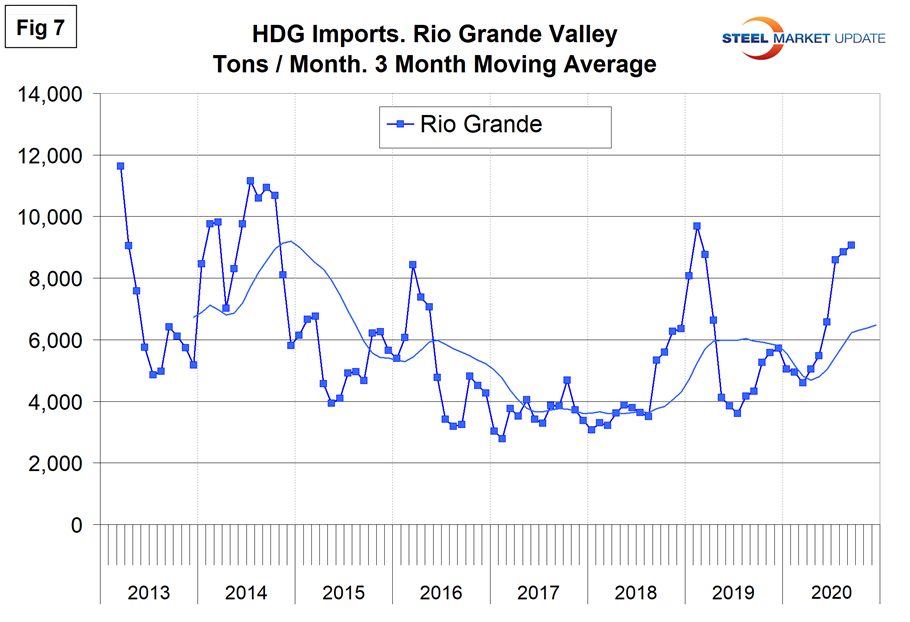
In September, hot dipped galvanized (HDG) imports were down by 11.4 percent at the national level, but on a regional basis ranged from a 39 percent decline in the South Pacific ports to an increase of 19 percent across the Rio Grande. The Great Lakes received the most tonnage followed by the Gulf.
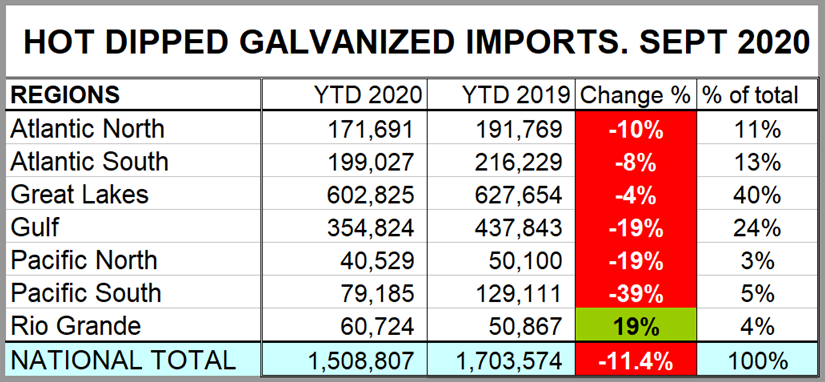
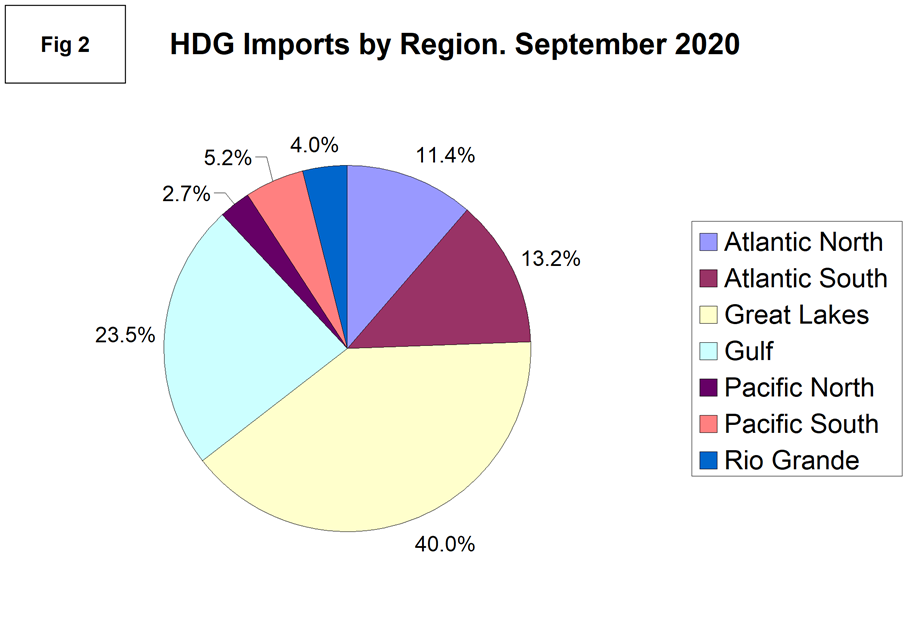
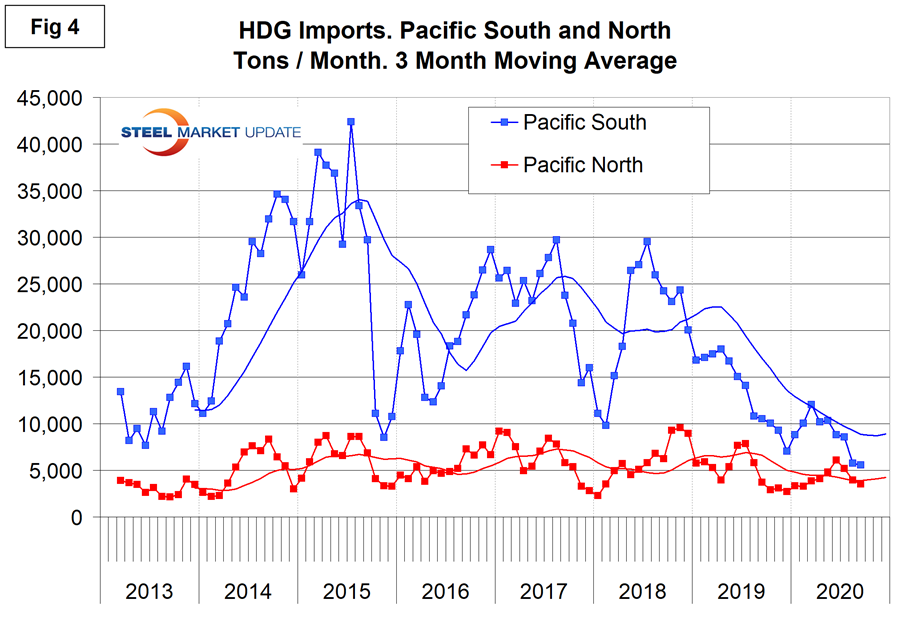
Pacific Coast: The tonnage into the South Pacific ports has been declining since July 2017. The North pacific has been fairly stable since 2013. Year to date, the North received 3 percent of the national total and the South received 5 percent.
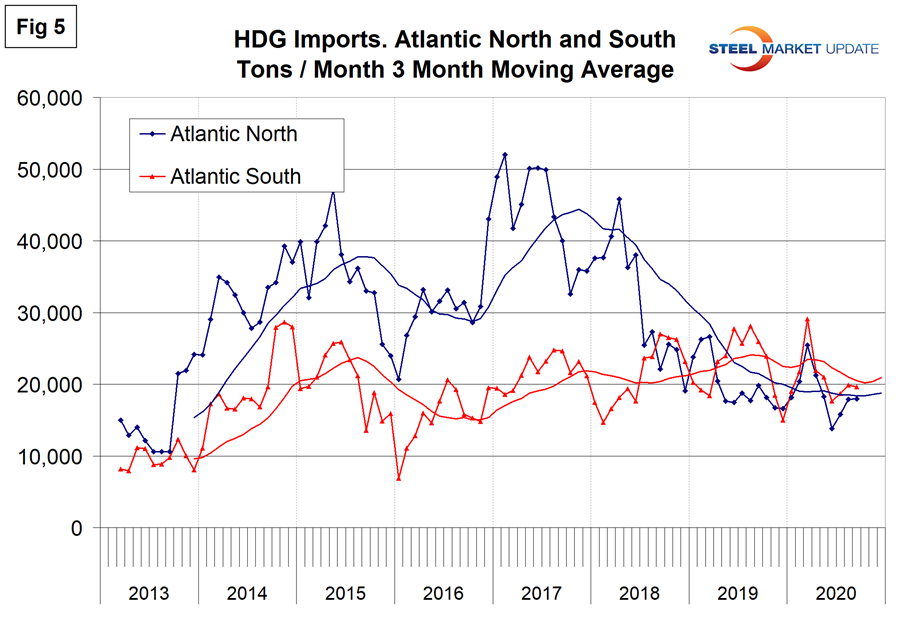
Atlantic Coast: The tonnage into the North and South Atlantic ports is similar and accounts for 11 and 13 percent of the total, respectively. Both have been gradually declining since September 2018.
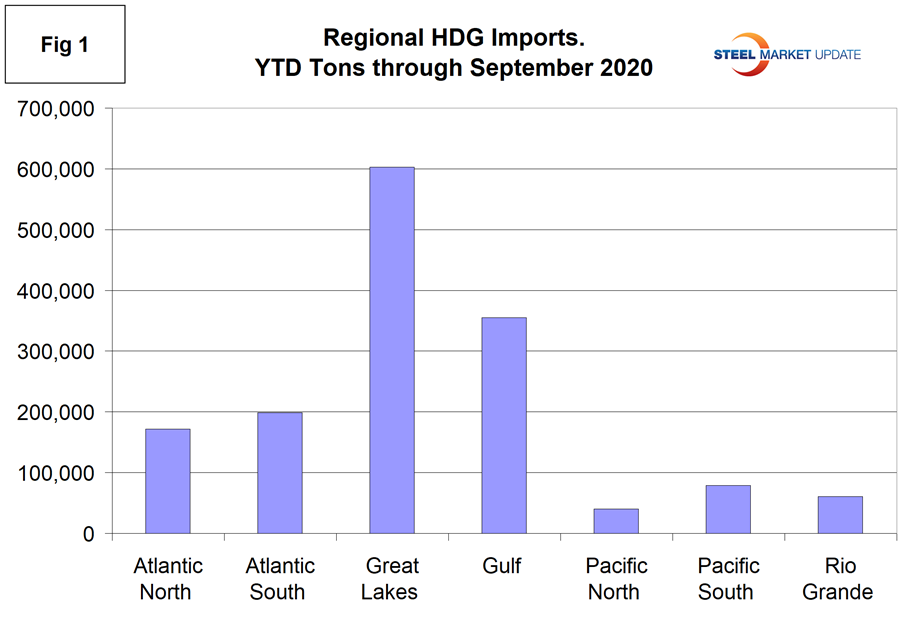
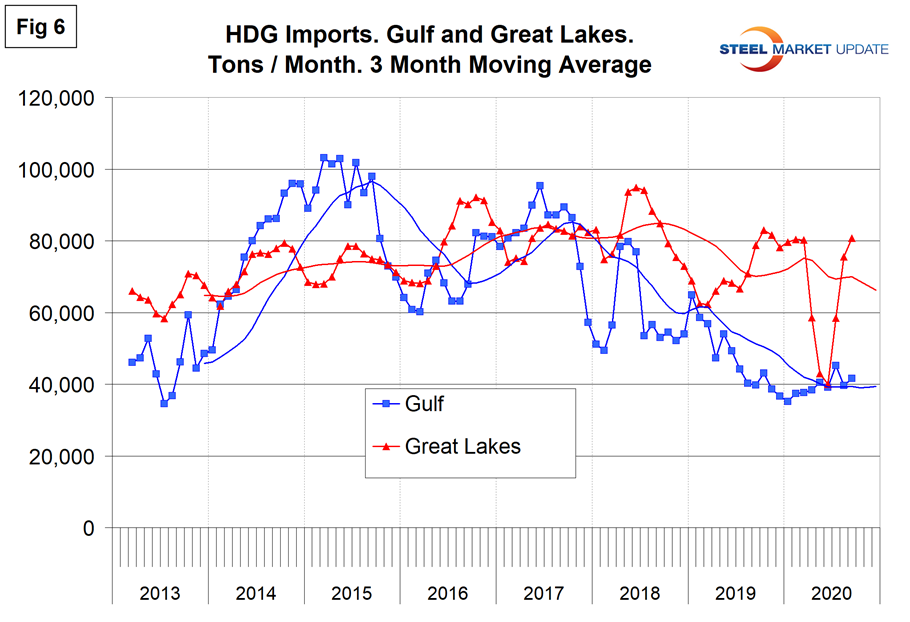
Gulf and Great Lakes: Through September, the Great Lakes received 40 percent of the national total tonnage and the Gulf received 24 percent. Between June and September, the tonnage into the Great Lakes doubled and returned to the level that existed from September 2019 through March 2020. The tonnage into the Gulf has been quite stable at 40,000 tons per month for the last year.
Rio Grande: This was the only region to experience a tonnage increase for the year, but has the second lowest tonnage of all seven regions.
Notes: SMU presents a comprehensive series of import reports ranging from the first look at licensed data to a detailed look at volume by district of entry and source nation. The report you are reading now is designed to plug the gap between these two. This report breaks total year to date import tonnage of six flat rolled products into seven regions and the growth/contraction for each product and region. There is a summary table for each product group and a bar chart showing volume by region for the first seven months of 2020. These are reference documents with no specific comments. These charts have been developed as a guide for buyers and sellers to have a broader understanding of what’s going on in their own backyard.
Regions are compiled from the following districts:
Atlantic North: Baltimore, Boston, New York, Ogdensburg, Philadelphia, Portland ME, St. Albans and Washington. DC.
Atlantic South: Charleston, Charlotte, Miami, Norfolk and Savannah.
Great Lakes: Buffalo, Chicago, Cleveland, Detroit, Duluth, Great Falls, Milwaukee, Minneapolis and Pembina.
Gulf: Houston, New Orleans, Mobile, San Juan, St. Louis and Tampa.
Pacific North: Anchorage, Columbia Snake, San Francisco and Seattle.
Pacific South: Los Angeles and San Diego.
Rio Grande Valley: Laredo and El Paso.