Market Data

December 4, 2020
Update on Manufacturing Indicators Through November
Written by Brett Linton
U.S. industrial production, manufacturing and durable goods orders continue to improve from the coronavirus pandemic downturn earlier this year. The health of the manufacturing economy has a direct bearing on the health of the steel industry.
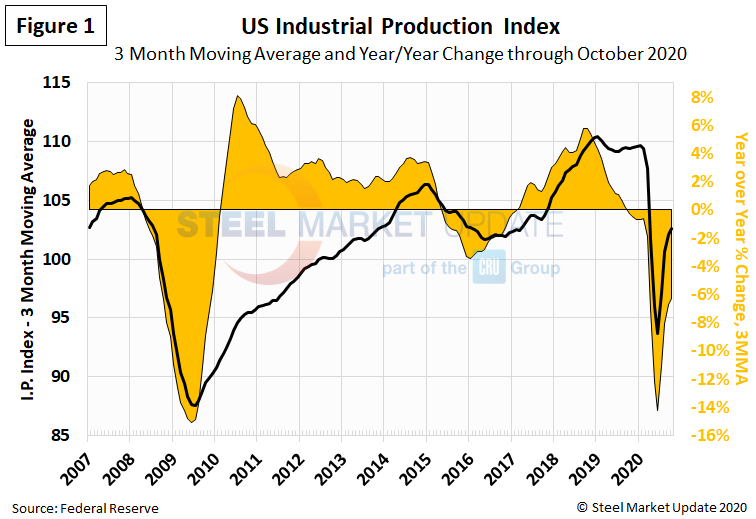
![]() The Industrial Production Index
The Industrial Production Index
The IP index is a gauge of output from factories, mines and utilities. Industrial production took a serious hit from the shutdowns of nonessential businesses and other measures mandated by the government in the first and second quarters to stem the spread of the coronavirus. Figure 1 shows the three-month moving average (3MMA) of the IP index since January 2007 as the black line and the year-over-year change as the brown shading. From the beginning of March just prior to the pandemic to the beginning of June, the 3MMA of the IP index dropped by 13 percent, from 107.7 down to 93.7. The 3MMA has since recovered, up to 102.6 in October.
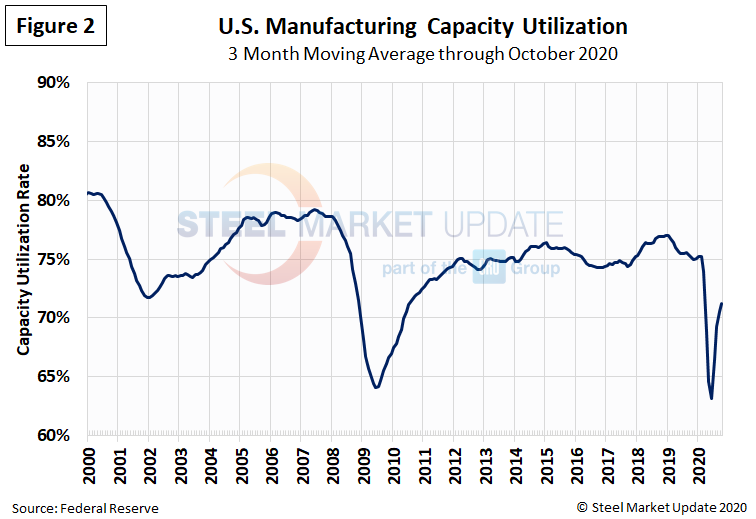
Manufacturing Capacity Utilization
Manufacturing capacity utilization, measured at 71 percent as a 3MMA, remained in recessionary territory through October data. The rate had reguarly hovered around 75 percent for the previous eight years, declining starting in March and reaching a low of 63 percent in June (Figure 2).
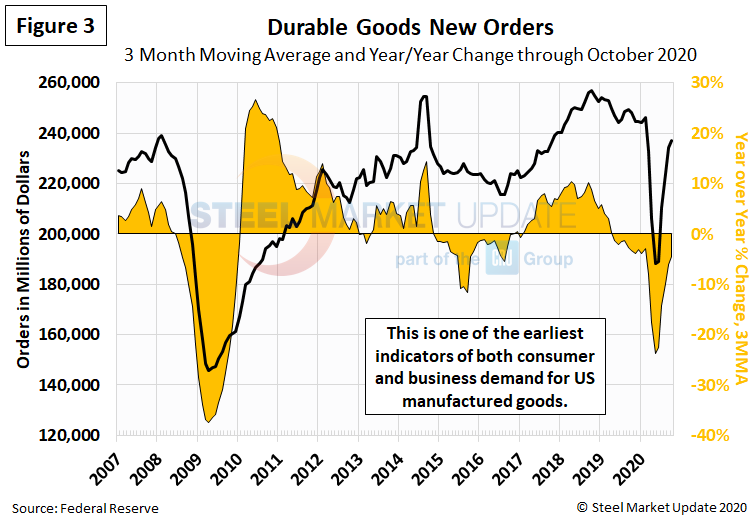
New Orders for Durable Goods
New orders for durable goods, an early indicator of consumer and business demand for U.S. manufactured goods, suffered a similar shock from the virus earlier this year (Figure 3). The 3MMA dropped by more than 23 percent from February through May, from a peak of $246.4 billion to a low of $188.5 billion. Durable goods orders have mostly recovered since then, reaching $237.2 billion as a 3MMA through October, very positive news for the economy.
New Orders for Manufactured Products
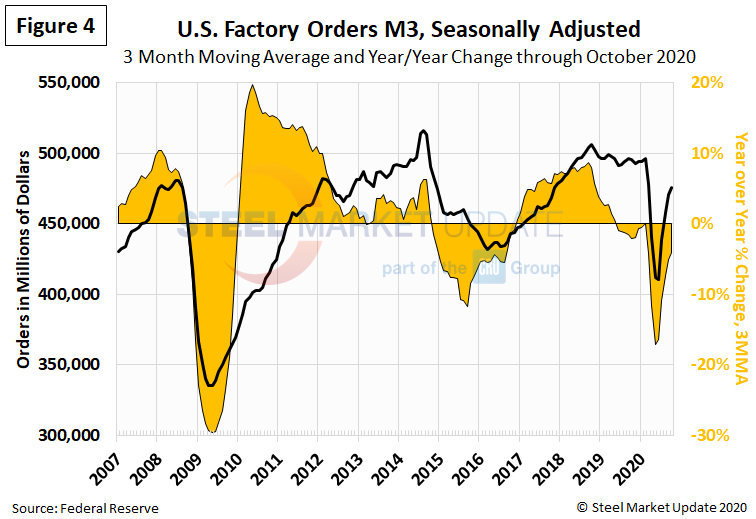
The growth rate of new orders for manufactured products as reported by the Census Bureau was slightly negative for most of 2019, then declined sharply in March 2020 (Figure 4). On a 3MMA basis, factory orders fell to a near 10-year low in June at $410.7 billion. Year over year in October, factory orders were down just 4 percent to $475.5 billion.
New Orders for Products Manufactured from Iron and Steel
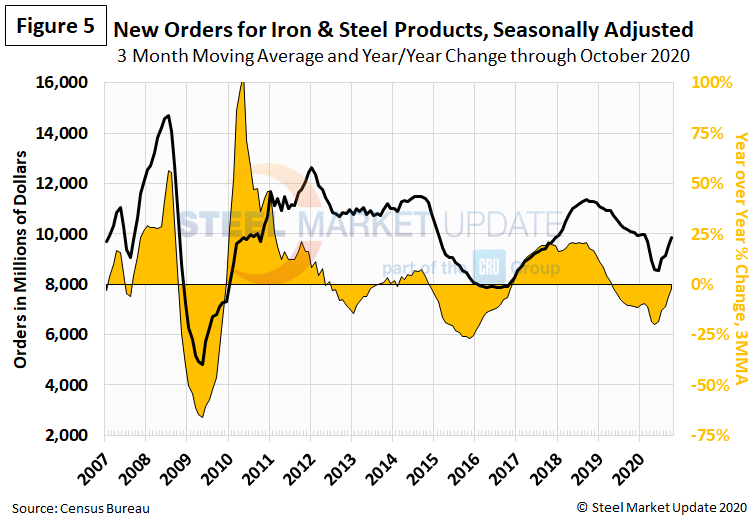
Within the Census Bureau M3 manufacturing survey is a subsection for iron and steel products. Figure 5 shows the history of new orders for iron and steel products since January 2000 as a 3MMA. The 3MMA year-over-year growth rate, which reached negative 20 percent in May, rebounded to negative 2 percent year-over-year in October at $9.9 billion.
Inventories of Products Manufactured from Iron and Steel
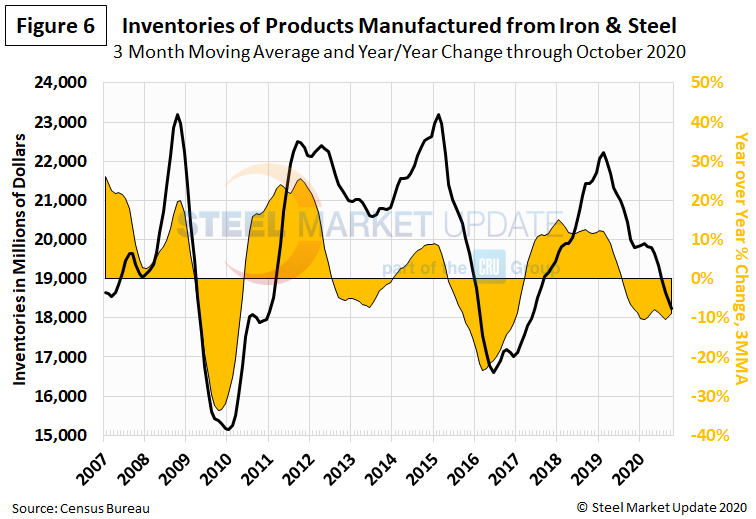
Inventories of iron and steel products continued to decline, down to $18.2 billion on a 3MMA basis through October (Figure 6).
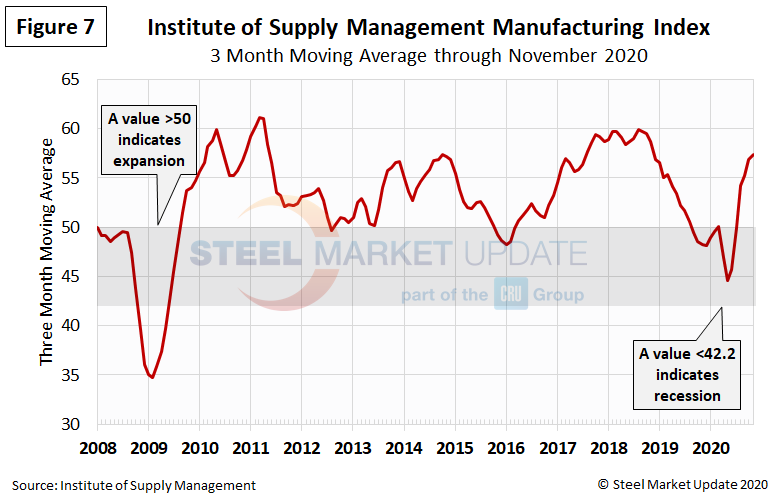
The ISM Manufacturing Index
The Institute for Supply Management’s Manufacturing Index is a diffusion index. An index value above 50 indicates that the manufacturing economy is expanding. As Figure 7 shows, the index as a 3MMA basis remained in contraction territory from September 2019 through June 2020, but has recovered each month since June and hit 57.4 in November.
“The manufacturing economy continued its recovery in November. Survey committee members reported that their companies and suppliers continue to operate in reconfigured factories, but absenteeism, short-term shutdowns to sanitize facilities and difficulties in returning and hiring workers are causing strains that will likely limit future manufacturing growth potential,” said Timothy Fiore, chairman of ISM’s Manufacturing Business Survey Committee. “Manufacturing performed well for the sixth straight month, with demand, consumption and inputs registering growth, but at slower rates compared to October. Labor market difficulties, both current and anticipated, at panelists’ companies and their suppliers will continue to dampen the manufacturing economy until the coronavirus (COVID-19) crisis ends.”