

Analysis

February 3, 2021
North American Auto Assemblies Make Comeback in 2020
Written by David Schollaert
Auto assemblies in North America bounced back robustly and surpassed pre-pandemic levels to close out 2020. Despite a production shutdown in March to stop the spread of COVID-19, U.S. auto sales ended the year just slightly below the initial 16.7 million forecast at 16.4 million units, according to LMC Automotive (LMCA).
U.S. Vehicle Sales
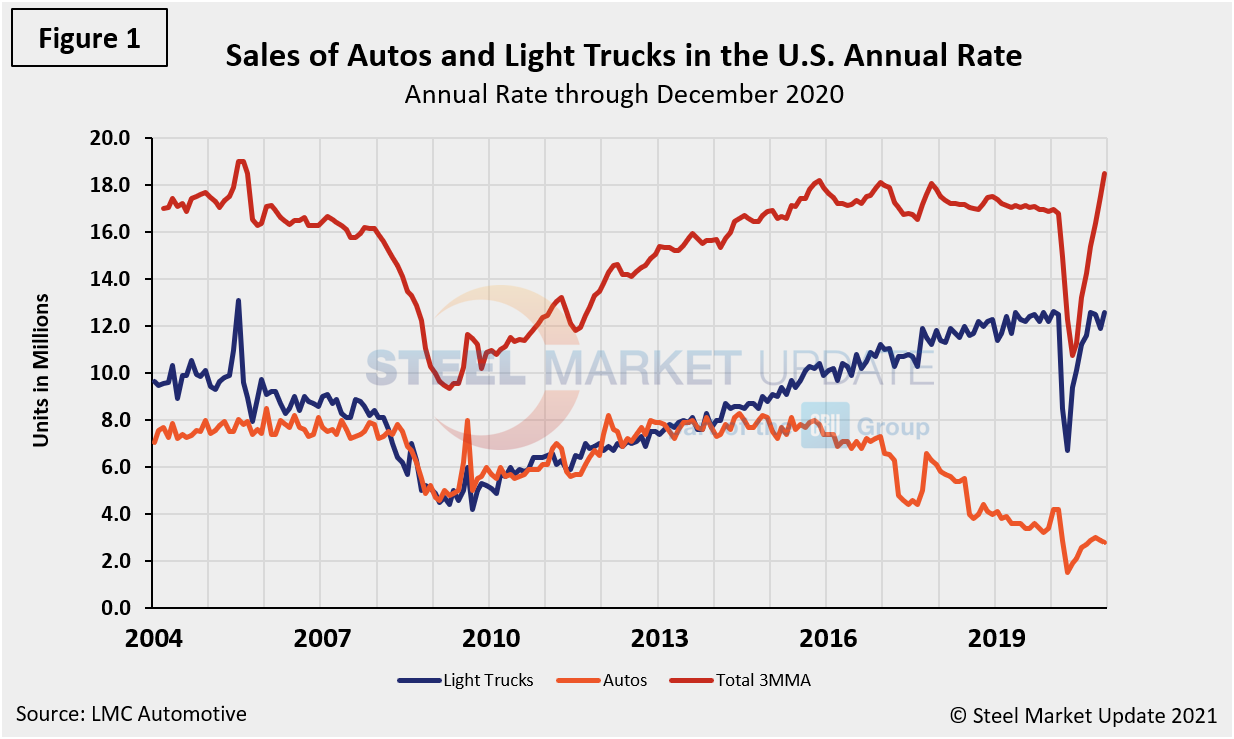
Figure 1 shows auto and light truck sales since January 2004. The bottom was reached in May 2020 when total sales were down 37.4 percent on a three-month moving average (3MMA) basis year over year. Since then, sales have rebounded and pushed upward, closing out December at a positive 9.7 percent. That’s more than a 47.0 percent swing in a matter of just seven months. Despite the monumental turnaround, auto sales are still lagging pre-pandemic levels, while pickups, SUVs and crossovers are back in line with January 2020 figures. Light trucks are currently nearly 82.0 percent of all sales, while auto sales have dipped to 18.2 percent, down from 25.4 percent last March. Import market share had spiked to 27.6 percent in June before falling back to 19.0 percent by year end.
North American Assemblies
According to LMCA, U.S. light vehicle sales grew by 6.4 percent year on year in December, due largely to extra selling days compared to December 2019. Nevertheless, the selling rate accelerated to 16.4 million units per year, from 15.6 million in November, a robust end to the year. In Canada, light vehicle sales were down by 7.1 percent compared to the year prior in December, and the selling rate slumped to 1.44 million units per year, the lowest rate since May. The slowdown was a result of wide-sweeping lockdown measures due to the pandemic. For the full year in Canada, sales fell by 19.6 percent versus 2019 to 1.55 million units. In Mexico, December sales fell by 19.4 percent year on year. The total sales volume for the year declined by 27.9 percent during 2020. Figure 2 shows the production in North America on a rolling 12-month basis as the dark blue line and the year-over-year growth as the light blue bars.
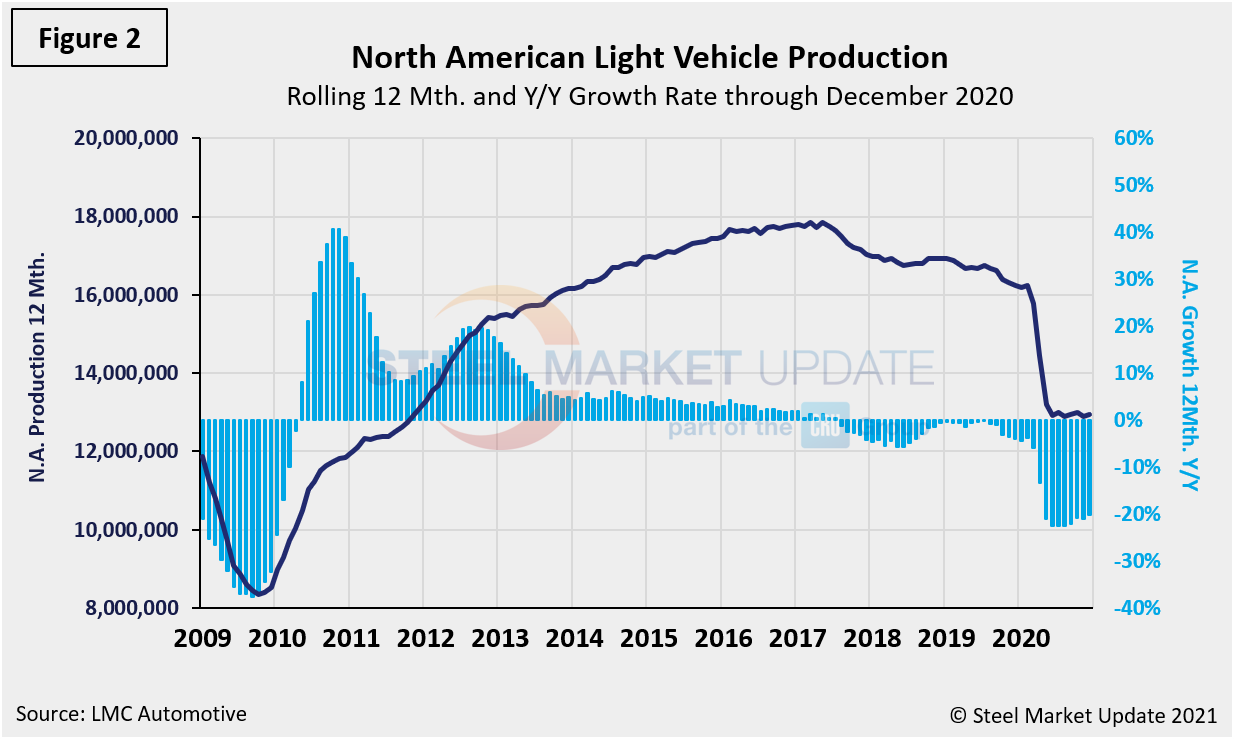
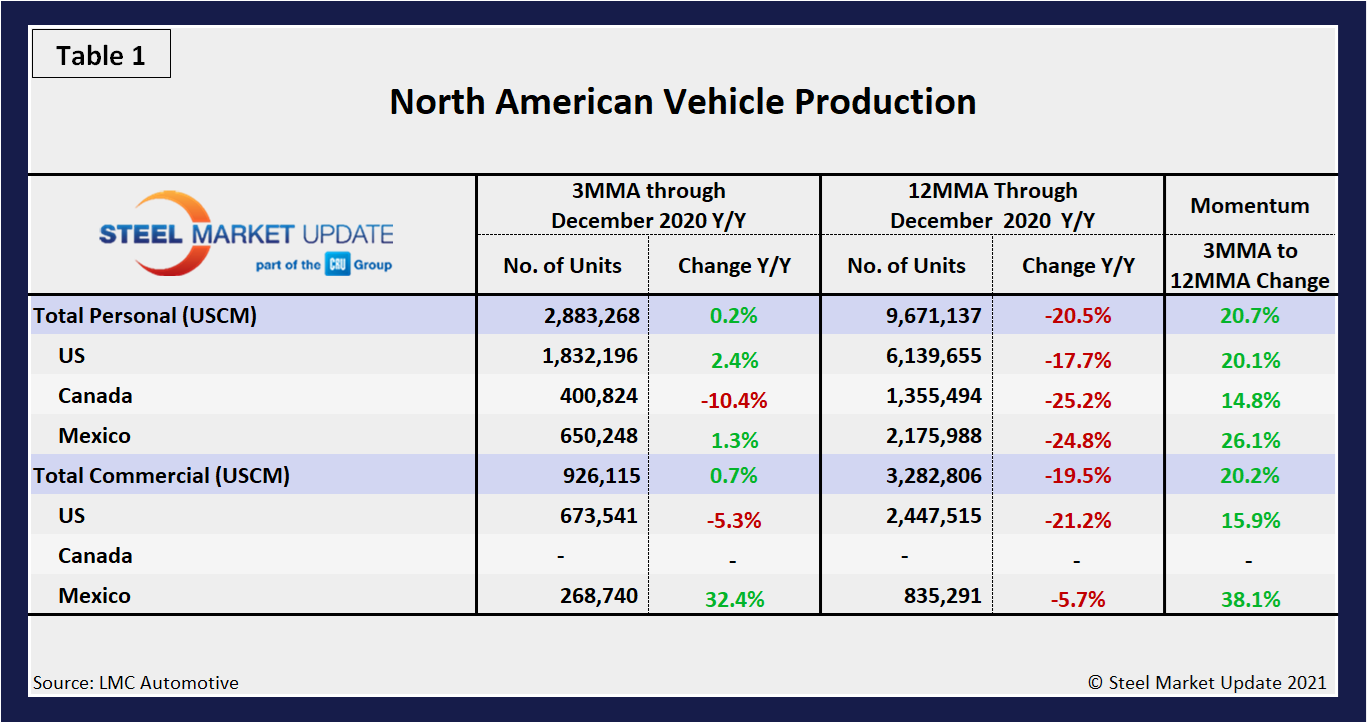
Table 1 is a short-term snapshot of assembly by nation and vehicle type. It breaks down total North American personal and commercial vehicle production into the U.S, Canadian and Mexican components and the three- and 12-month growth rate for each. At the far right it shows the momentum for the total and for each of the three nations. In three months through December, total personal vehicle assemblies in the USMCA were up 0.2 percent year over year, a strong turnaround from a decrease of 70.5 percent seen in June on a year-on-year basis. Commercial light vehicle assemblies were also up 0.7 percent year over year after being down by 66.5 percent at the end of the second quarter. There has been zero commercial vehicle production in Canada in 2020.
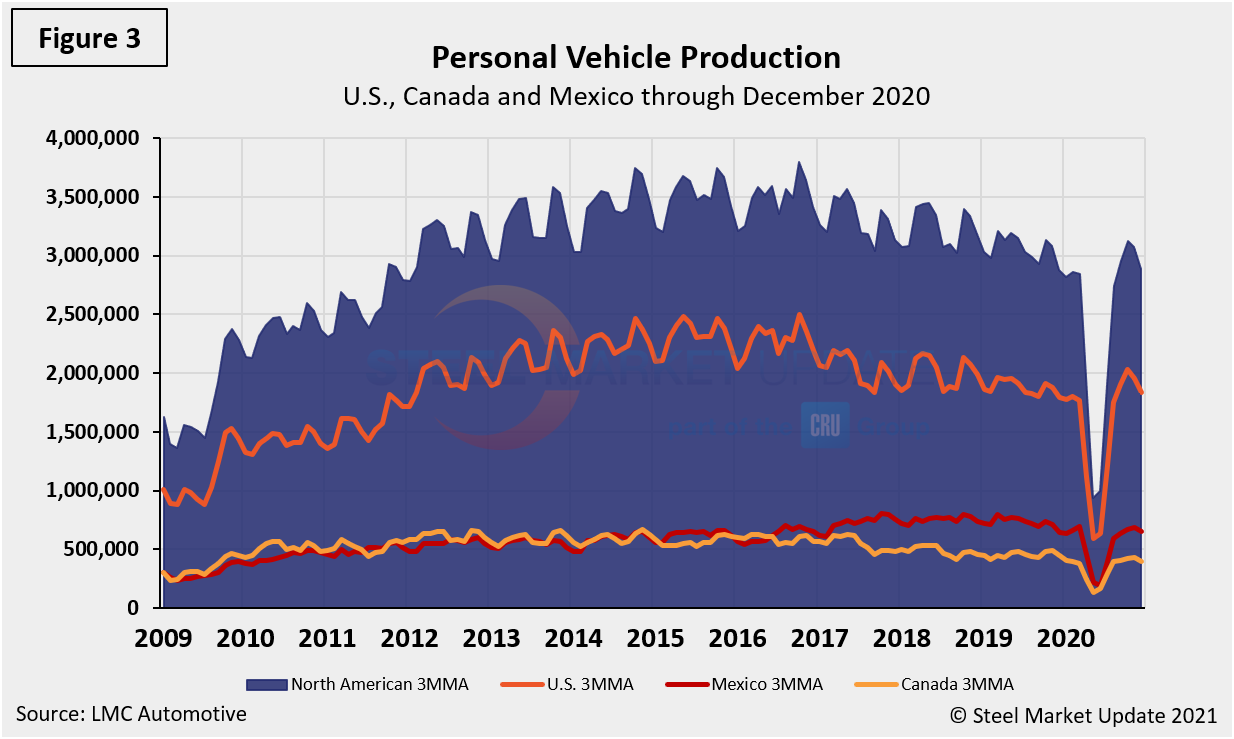
The longer-term picture is shown in the following charts by vehicle type and nation. Figure 3 shows the total personal vehicle production for North America and the total for each nation.
Figures 4, 5 and 6 show the production of personal vehicles by nation and the year-over-year growth rate for each. Figure 7 shows the production share for each nation. The U.S. share was as high at 64.8 percent in October, but slipped to 63.5 percent through December. On the same basis, Canada’s share fluctuated throughout 2020, settling at 13.9 percent in December. Mexico’s share improved to 22.6 percent in December from a low of 19.0 percent in June.
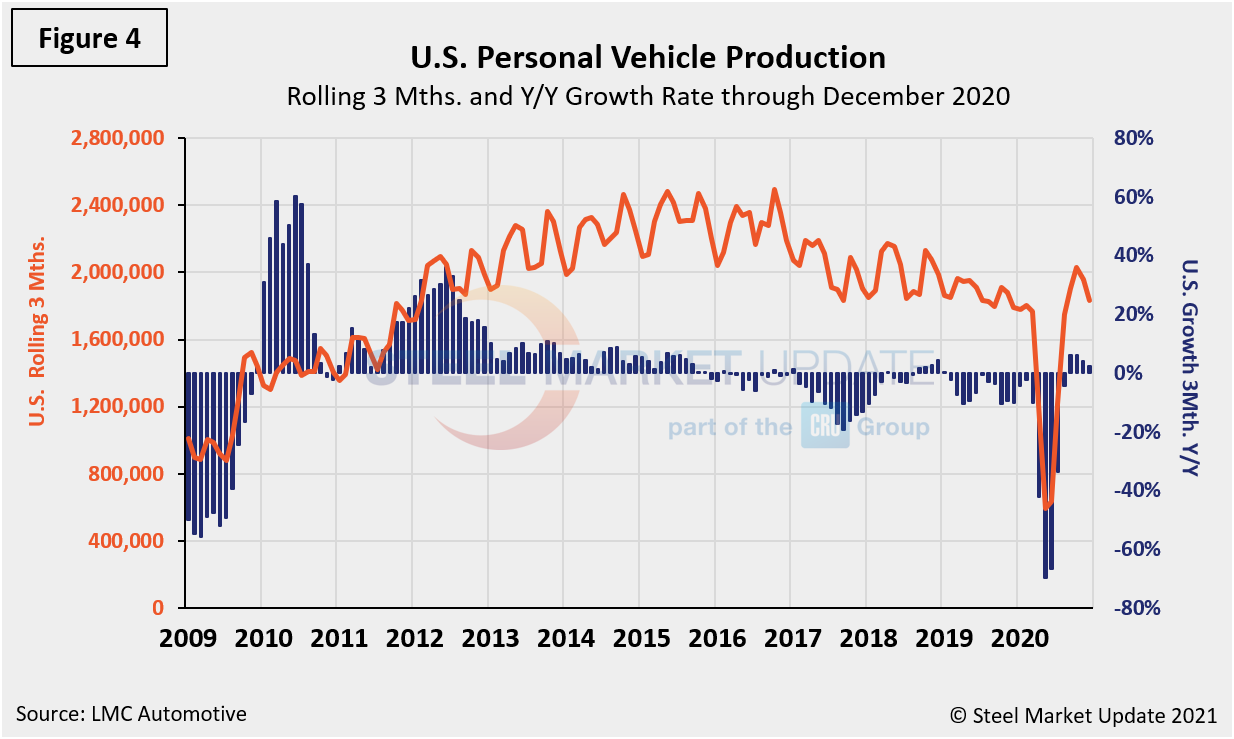
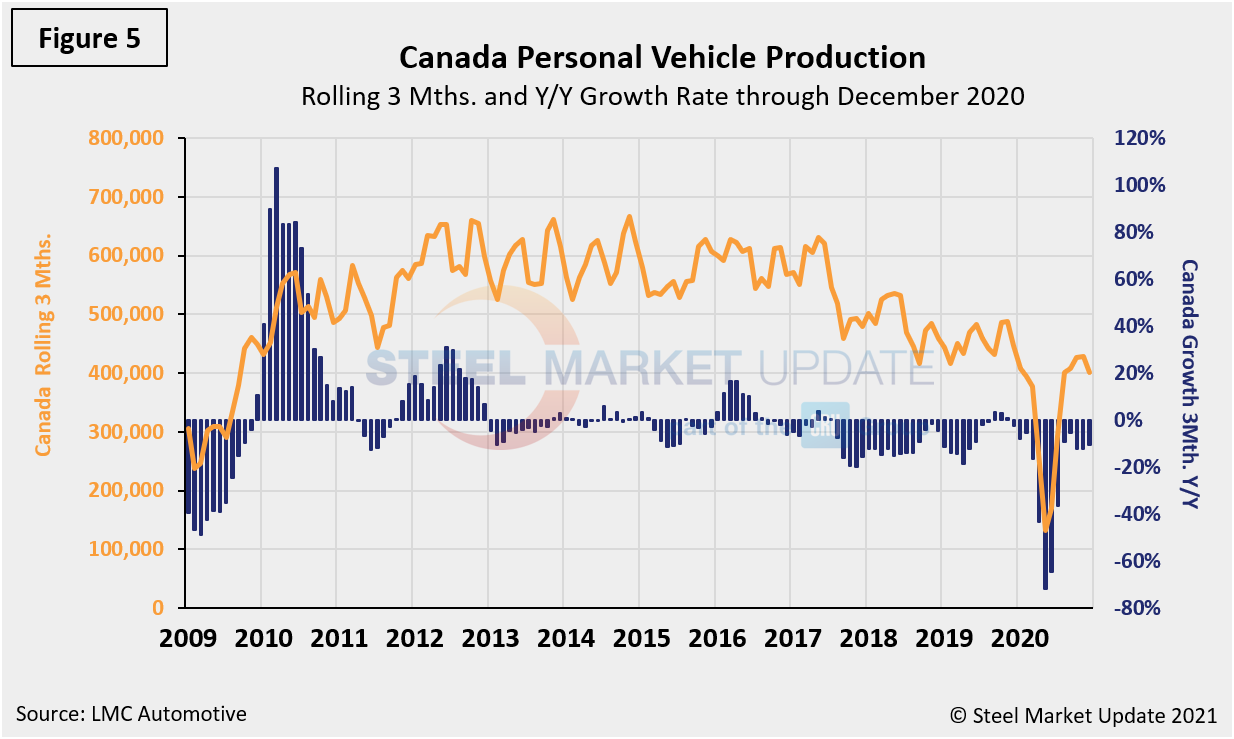
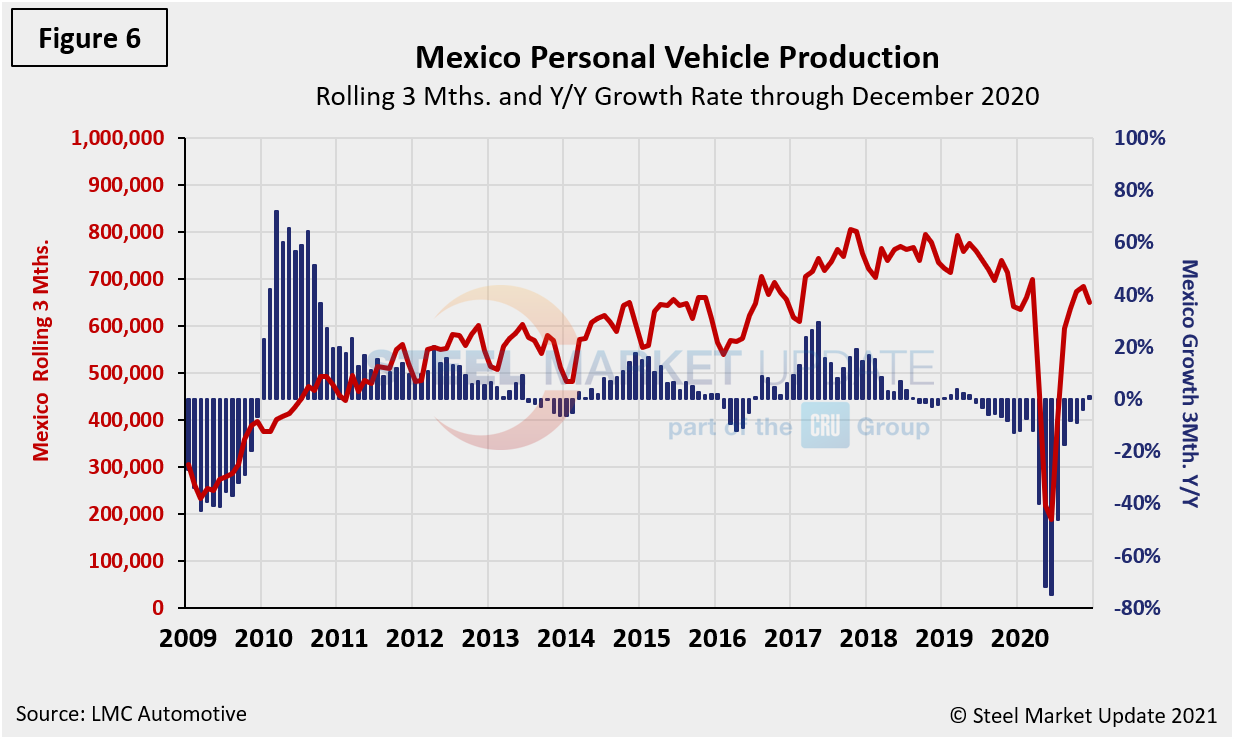
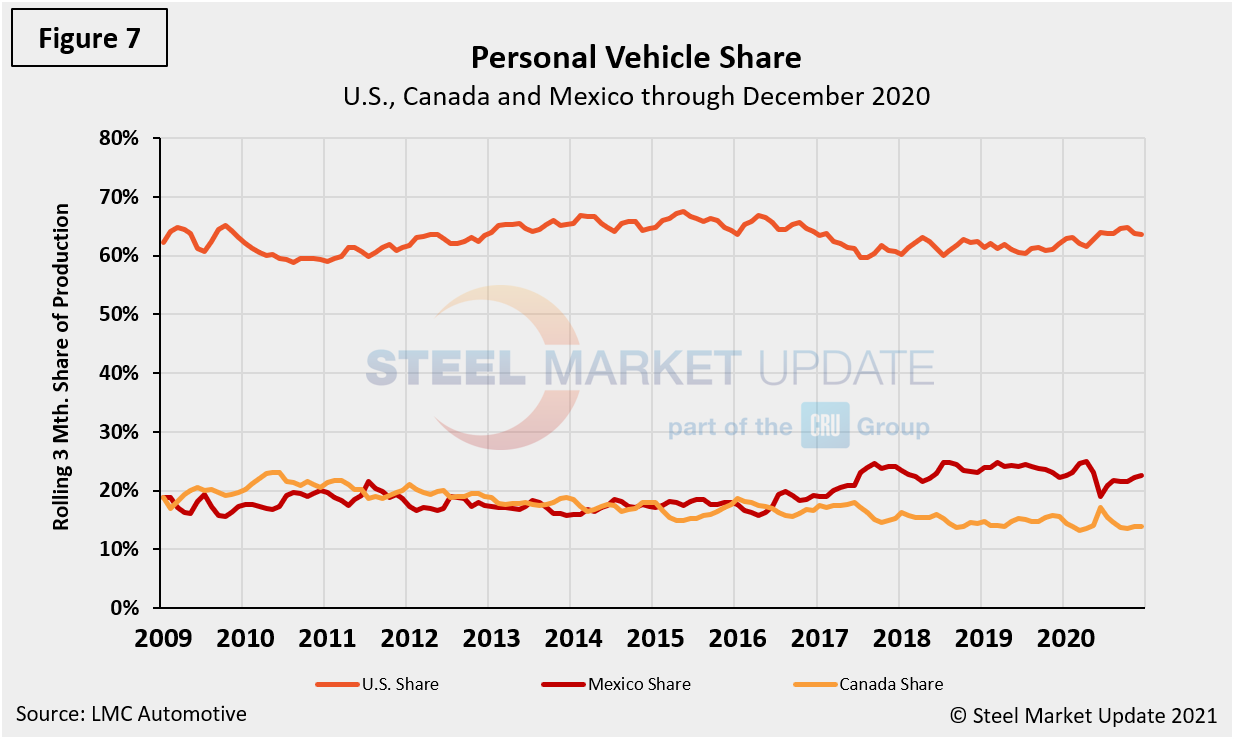
Figure 8 shows the total commercial vehicle production for North America and the total for each nation on a rolling three-month basis.
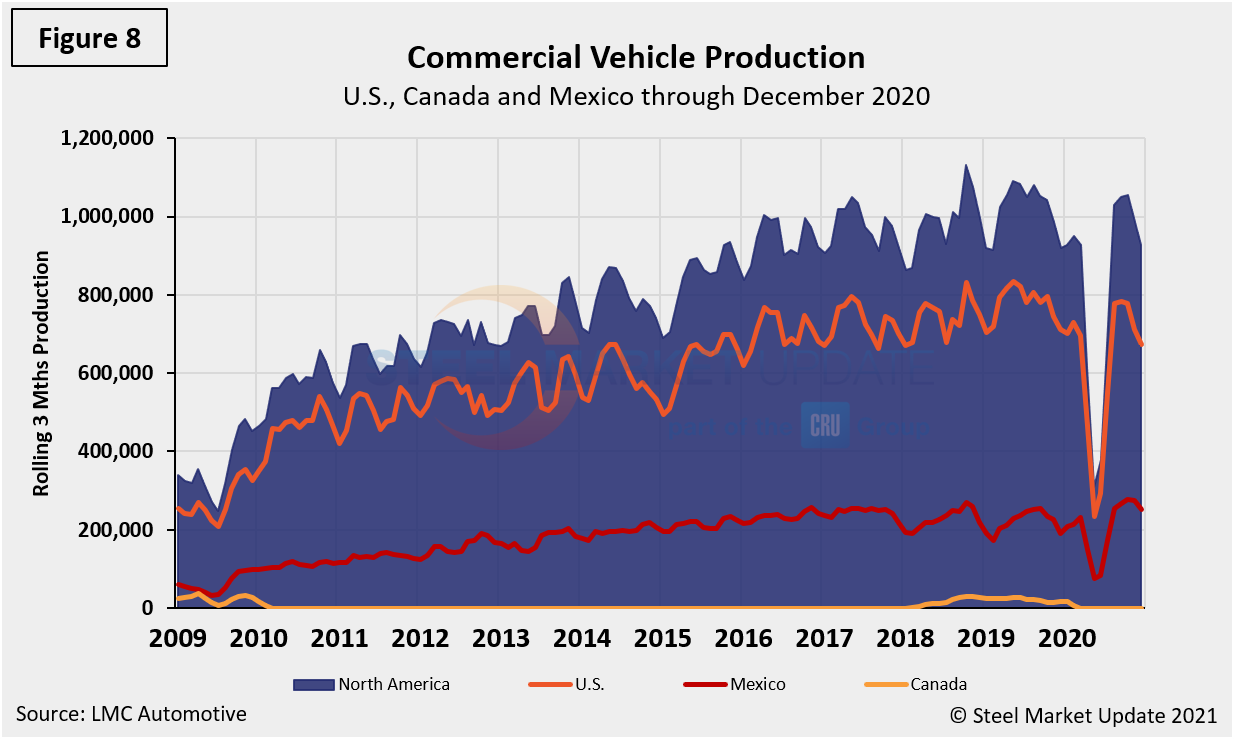
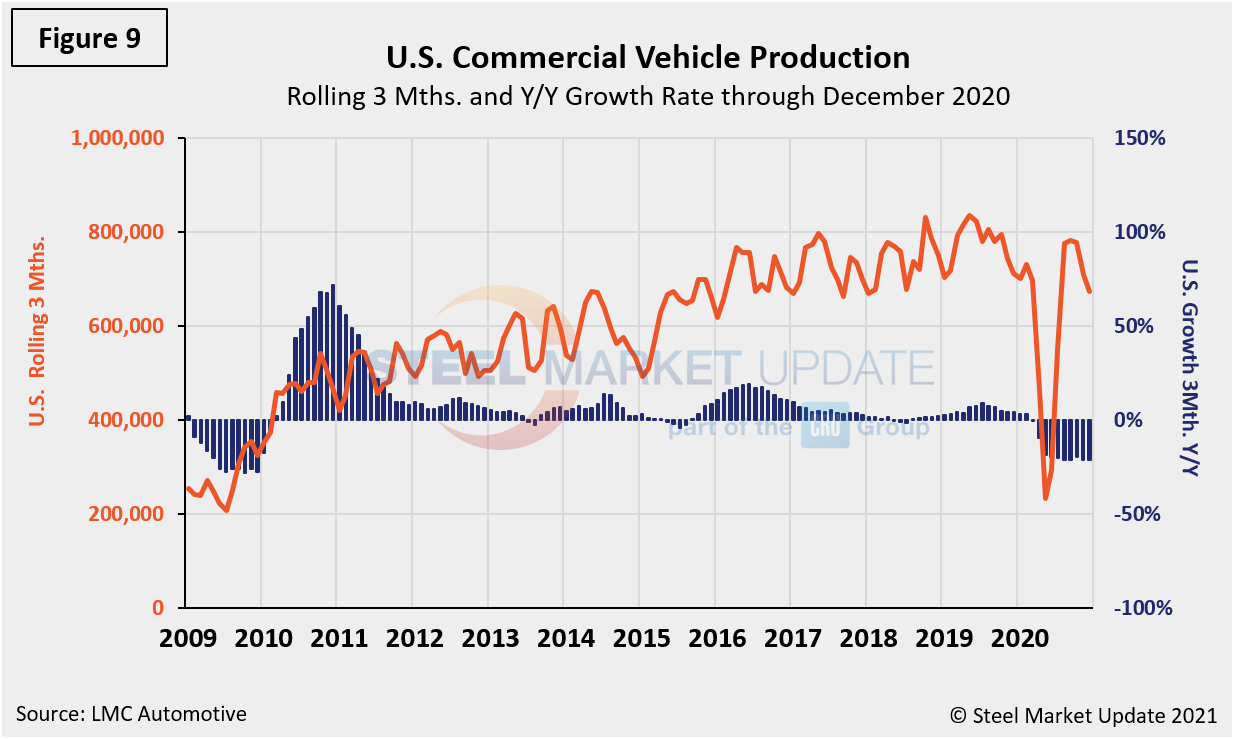
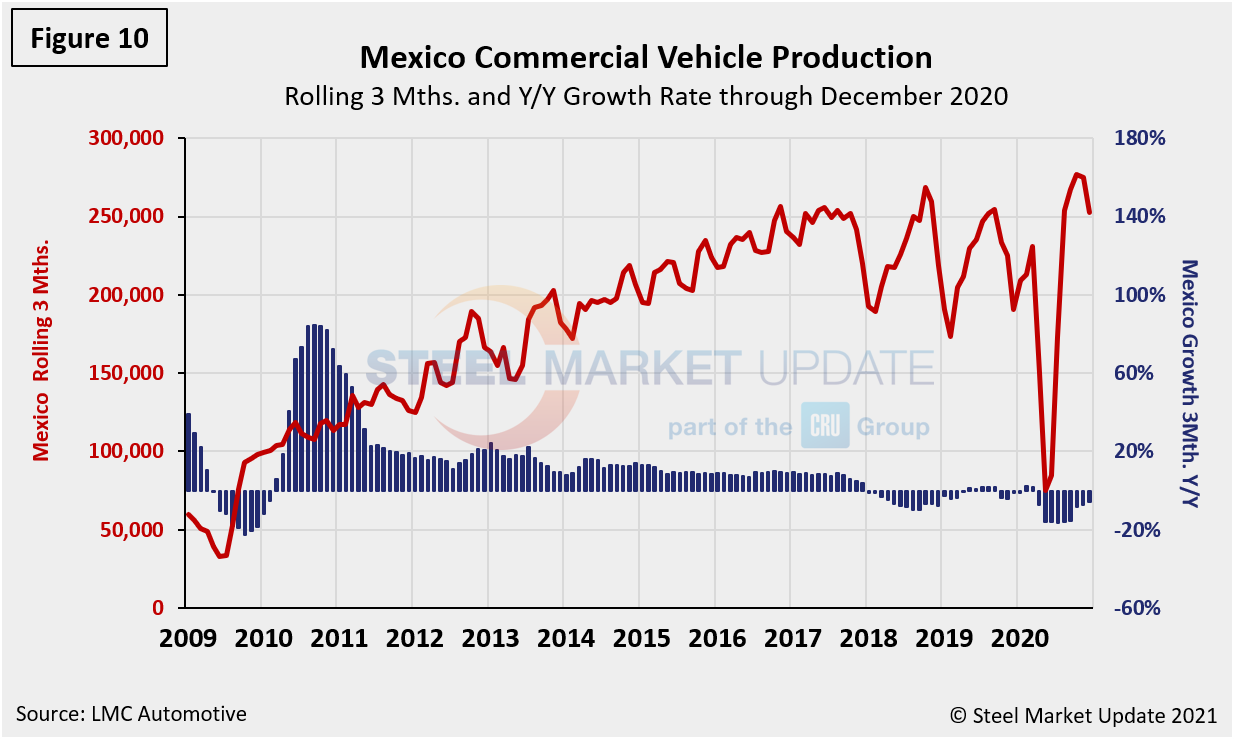
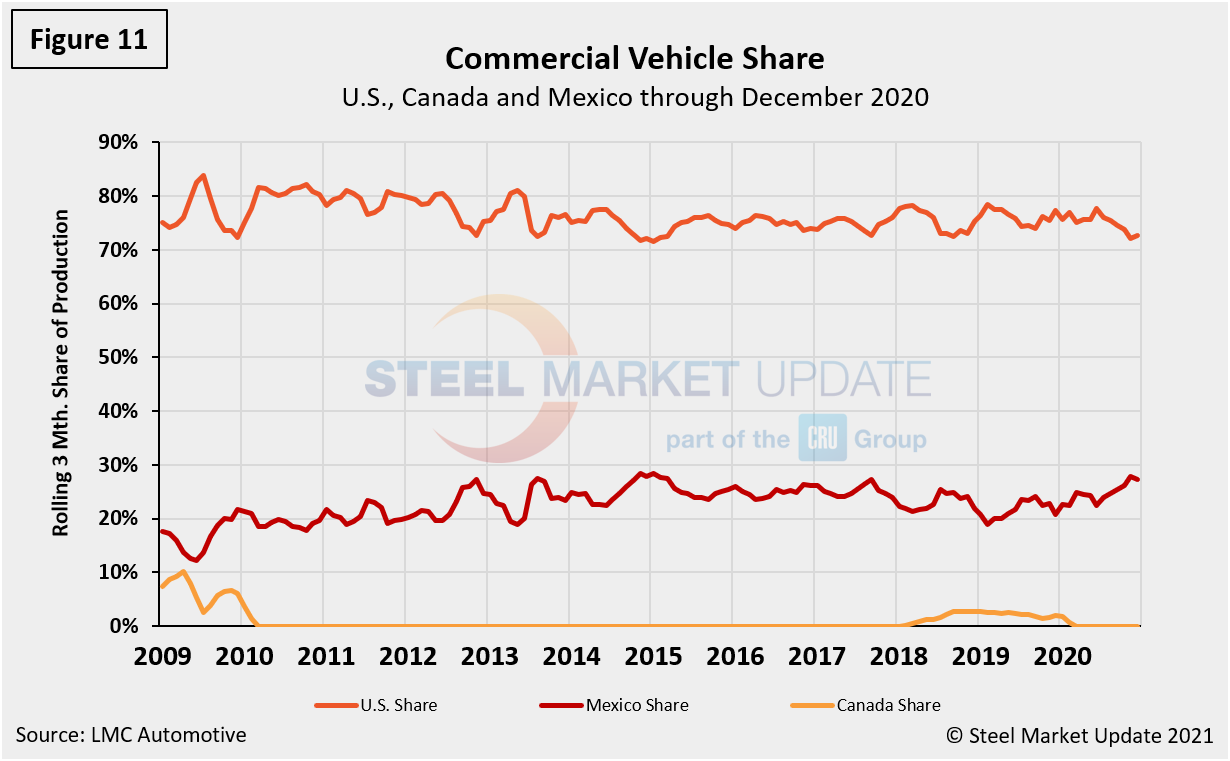
Figures 9, 10 and 11 show the production of commercial vehicles by nation and the year-over-year growth rate for each, and Figure 12 shows the production share for each nation. The U.S. share edged down from 77.6 percent in June to 72.7 percent in December. Mexico’s share rose during the same period from 22.4 percent in June to 27.3 percent in December. Canada has had no commercial production since February 2020. Mexico currently exports about 80 percent of its light vehicle production. The U.S and Canada are the highest volume destinations for Mexican exports.
Note: This report is based on data from LMC Automotive for automotive assemblies in the U.S., Canada and Mexico. The breakdown of assemblies is “Personal” (cars for personal use) and “Commercial” (light vehicles less than 6.0 metric tons gross vehicle weight rating; heavy trucks and buses are not included). In this report we briefly describe light vehicle sales in the U.S. before reporting in detail on assemblies in the three regions of North America.
By David Schollaert, David@SteelMarketUpdate.com

