

Market Data

March 3, 2021
SMU Energy Analysis: Recovery Ahead?
Written by Brett Linton
The Energy Information Administration’s February Short-Term Energy Outlook, which was published prior to the hazardous winter weather that swept across the country in mid-February, remained subject to heightened levels of uncertainty as responses to COVID-19 continue to evolve. Reduced economic activity from the pandemic caused a decline in 2020 energy demand and supply. As of early-February, the EIA expected lower oil prices later in 2021 as a result of rising oil supplies that will slow the pace of global oil inventory withdrawals. EIA also expects that high global oil inventory levels and spare production capacity will limit upward price pressures
SMU Note: Earlier today, SMU hosted a Community Chat Webinar featuring Rick Preckel of Preston Pipe. Preckel shared his comments about the state of the U.S. energy market and its predicted recovery. You can view a recording of this free webinar and a copy of the presentation here.
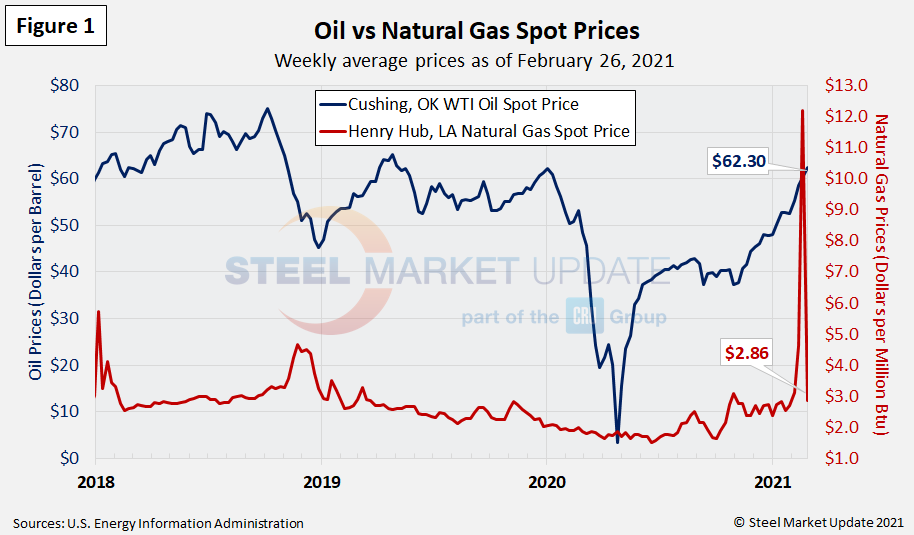
Spot Prices
The spot market price for West Texas Intermediate (WTI) continues to rise, at $62.30 per barrel as of Feb. 26, the highest price since May 2019. Natural gas at the Henry Hub in Oklahoma had been relatively steady since November, but jumped in mid-February as winter storms impacted much of the nation. The scarcity of natural gas and rising demand drove spot prices through the roof, reaching $23.86 MMBTU (million British Thermal Units) on Feb. 17. The spot price returned to near normal levels as of last week, down to $2.86 per MMBTU as of Feb. 26. Figure 1 shows the weekly average spot prices for each product through last week.
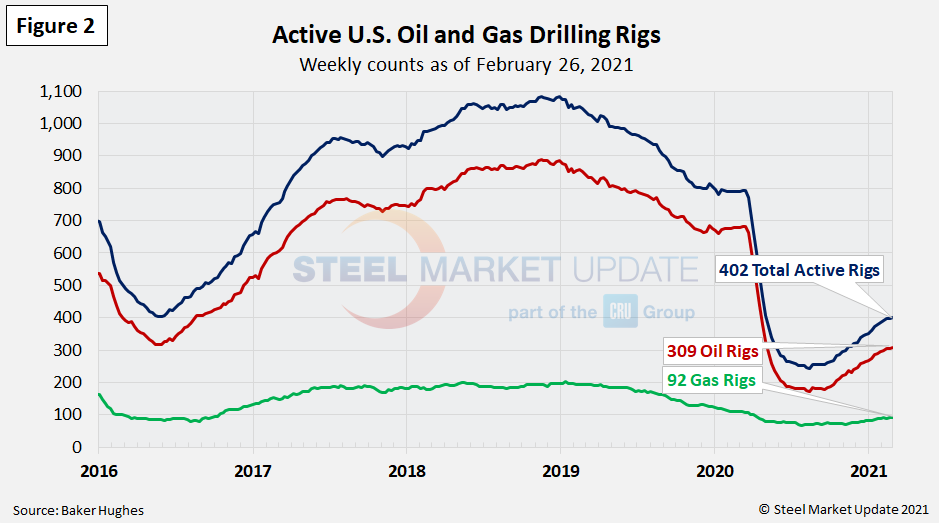
Rig Counts
The number of active U.S. oil and gas drill rigs has continued to recover since mid-2020. Last week there were 402 active drill rigs, comprised of 309 oil rigs, 92 gas rigs and 1 miscellaneous rig, according to the latest data from Baker Hughes (Figure 2). While up over recent months, active drill rigs are down 49 percent from the March 2020 level of 793 rigs, just prior to the coronavirus shutdowns. The table below compares the current U.S., Canada and International rig counts to historical levels.
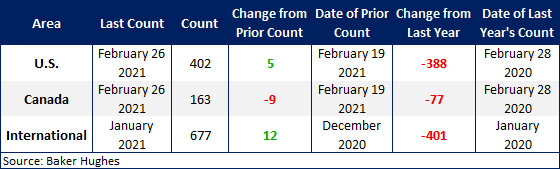
U.S. oil and gas production are heavily concentrated in Texas, Oklahoma, North Dakota and New Mexico, which have all seen declines of 47-73 percent since March of last year. The most active state, Texas, now has 195 active rigs in operation, the highest level seen since May 1, 2020. Texas rigs had plummeted from 407 in March 2020 to 97 rigs in August 2020 (Figure 3).
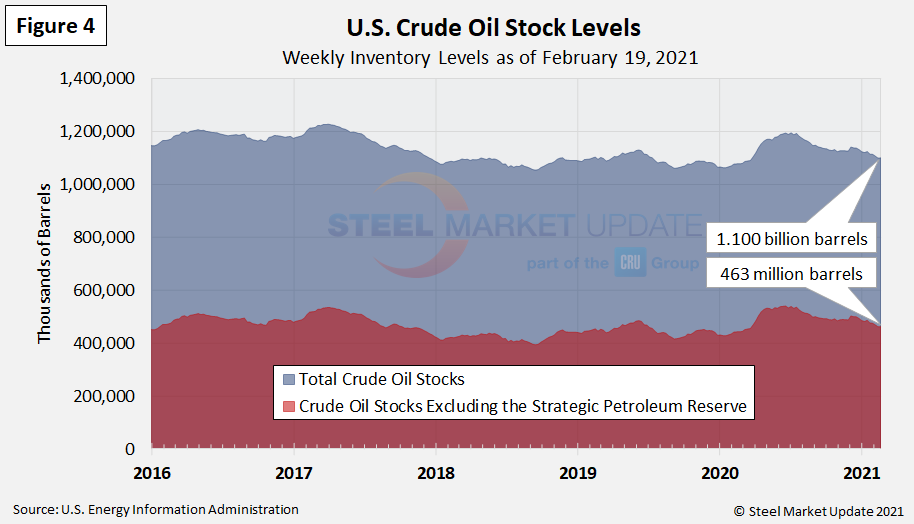
Stock Levels
U.S. total crude oil stocks in 2020 had surged from mid-March through July, but have steadily declined since then. The latest level is 1.100 billion barrels as of Feb. 19, up from 1.078 billion barrels the same time last year (Figure 4).
Trends in energy prices and rig counts are a predictor of demand for oil country tubular products (OCTG), line pipe and other steel products.
By Brett Linton, Brett@SteelMarketUpdate.com


