

Analysis

May 6, 2021
March CPIP Data Shows Residential Construction Leading the Way
Written by David Schollaert
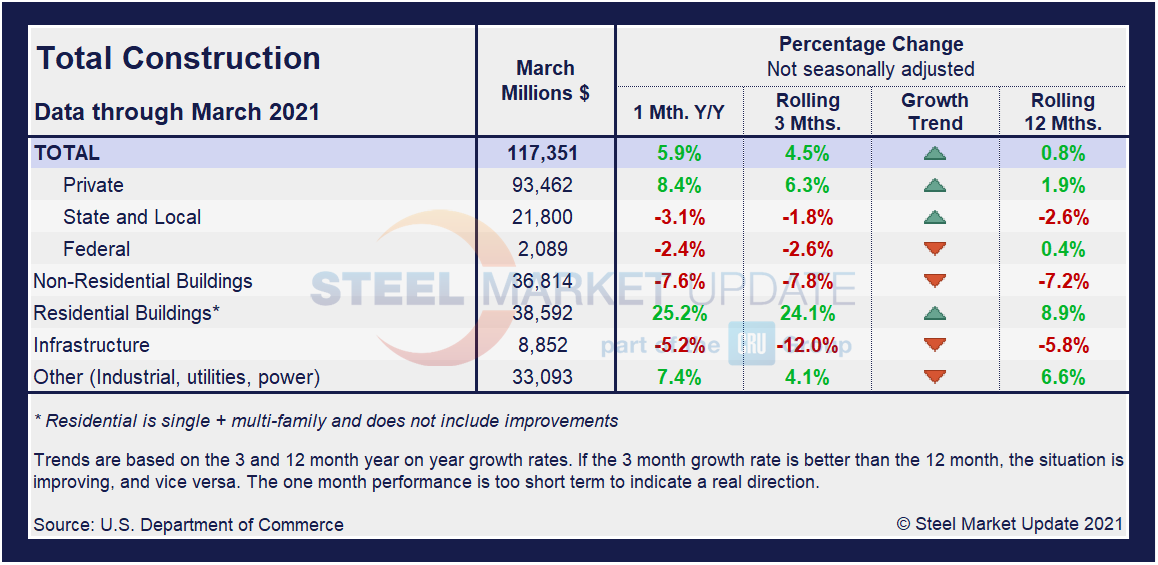
The construction sector has seen positive, but uneven, growth as it works through the effects of the COVID pandemic. Total construction expenditures in March were $1.513 trillion, up 0.2% from February’s revised estimate of $1.509 trillion, reported the U.S. Census Bureau. Total construction was also up 5.9% compared to a year ago when construction spending was $1.463 trillion. Year-to-date construction spending amounted to $3.283 trillion, 4.5% above the $3.141 trillion for the same period in 2020.
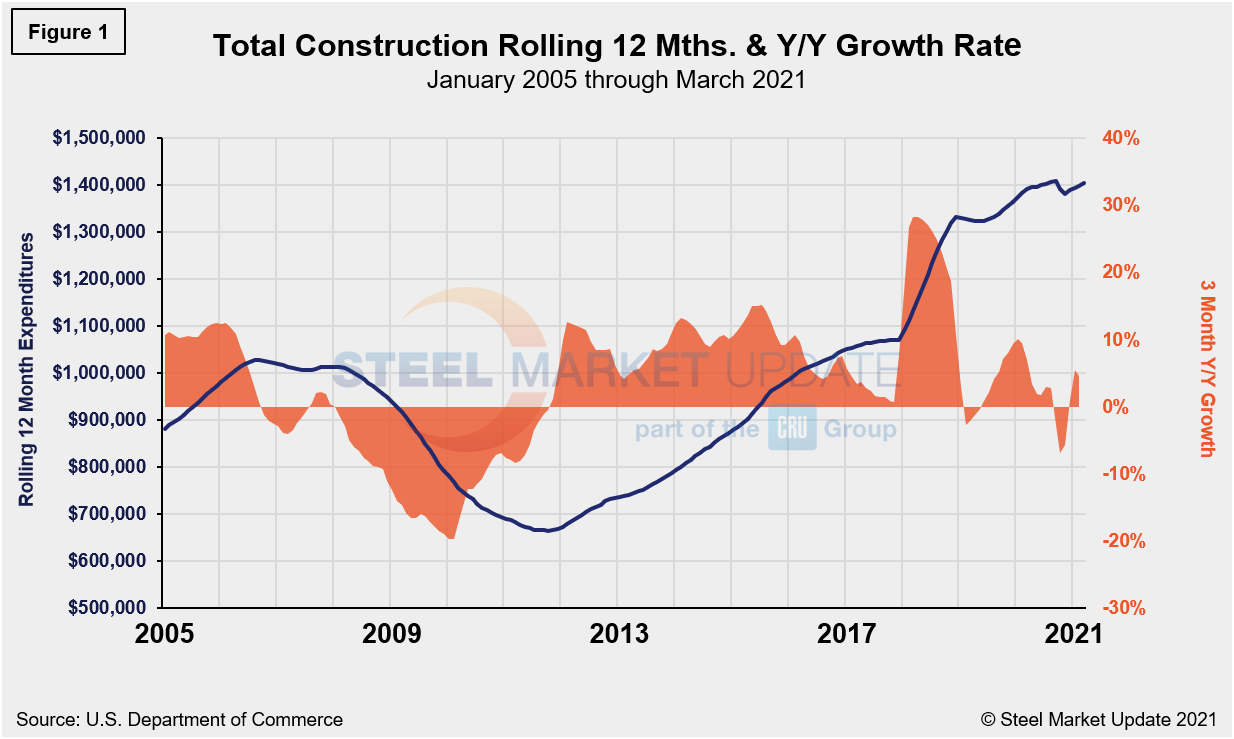
Although total construction spending overall is up year on year, the table below highlights that primary growth is coming from the private sector, specifically residential building, which is up nearly 9% over the past 12 months. Nonresidential spending is down more than 7% over the same period. Total construction expenditures are also shown in Figure 1 on a rolling 12-month basis as the blue line and the rolling three-month year-over-year growth rate as the orange bars
Private Construction
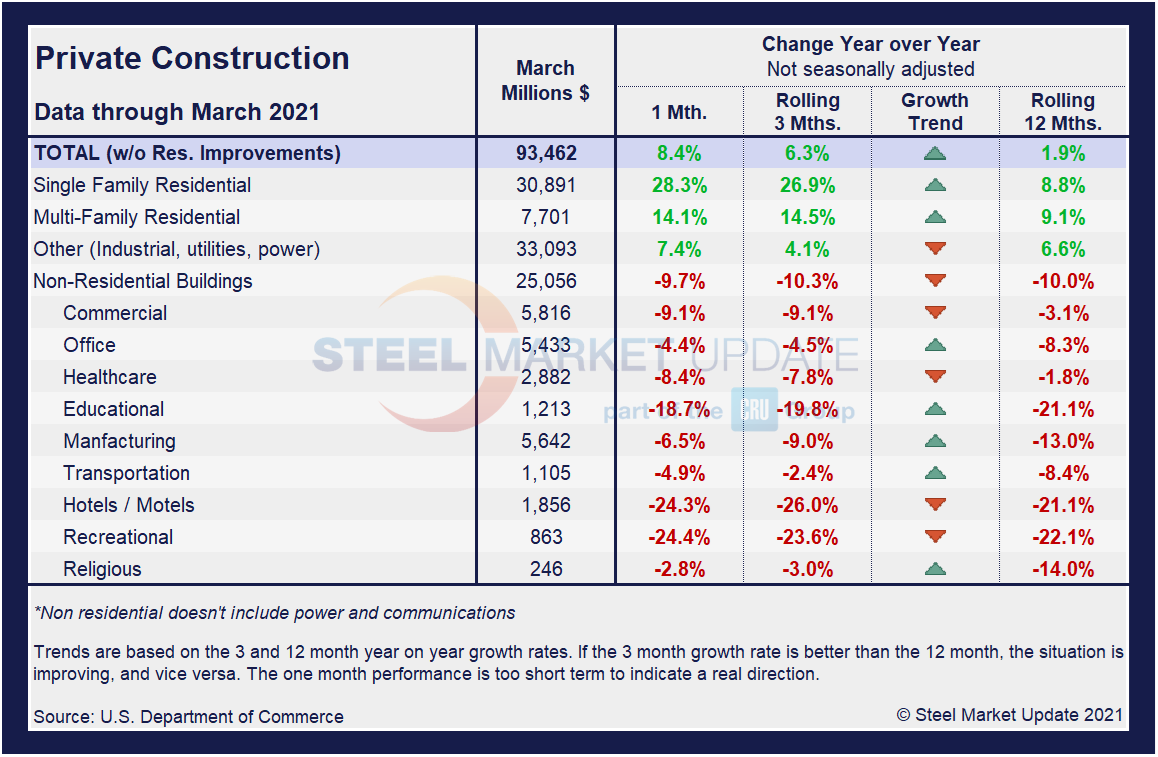
The breakdown of private expenditures into residential and nonresidential and their subsectors are highlighted in the table below. Despite a few nonresidential subcategories trending up of late, residential construction has been the driving force in the private construction sector. Not surprising are the nonresidential subcategories hit hardest by the pandemic shutdowns, such as recreational, hotels and educational construction, all down by more than 20% on a rolling 12-month basis. Single-family and multi-family residential construction are up 8.8% and 9.1%, respectively, on a rolling 12-month basis. Single-family residential construction posted a 28.3% growth rate in March.
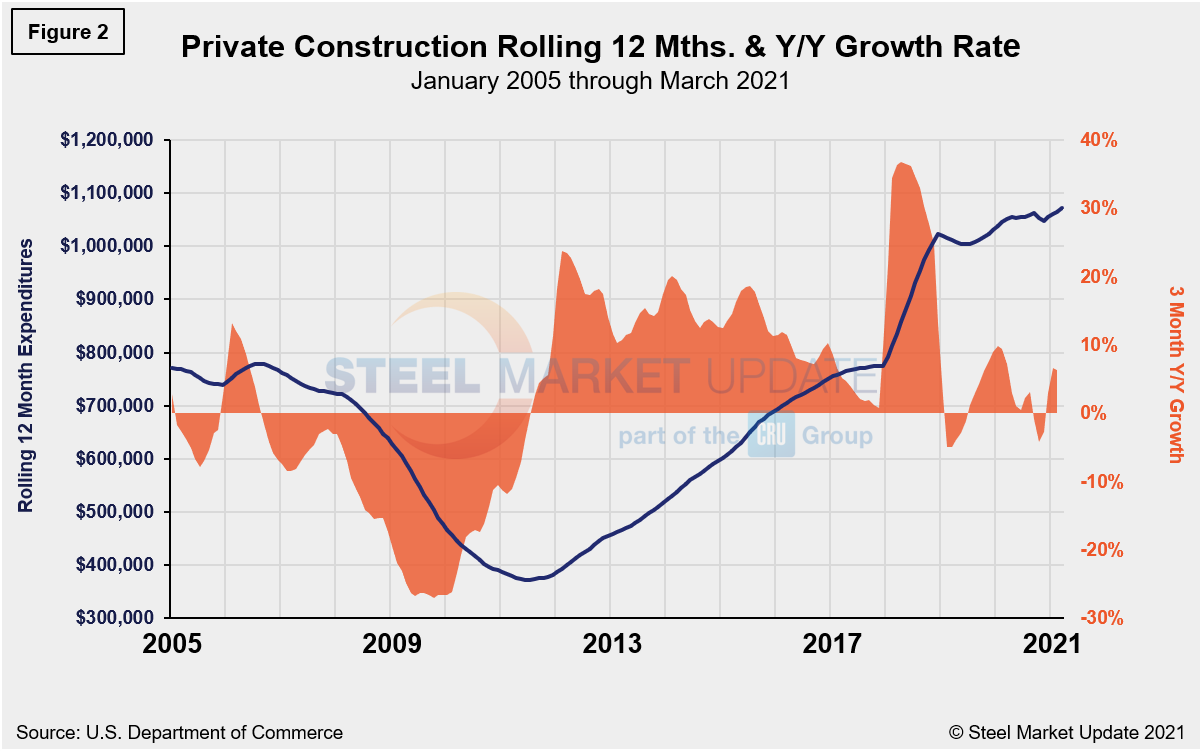
Spending on private construction in March hit a seasonally adjusted annual rate of $1.169 trillion, 0.7% above the revised February estimate of $1.160 trillion, Census reported (Figure 2). Residential construction saw a seasonally adjusted annual rate of $725.2 billion in March, or 1.7% above the revised February estimate of $713.1 billion. Nonresidential construction spending was at a seasonally adjusted annual rate of $444.0 billion in March, or 0.9% below the revised February estimate of $447.8 billion.
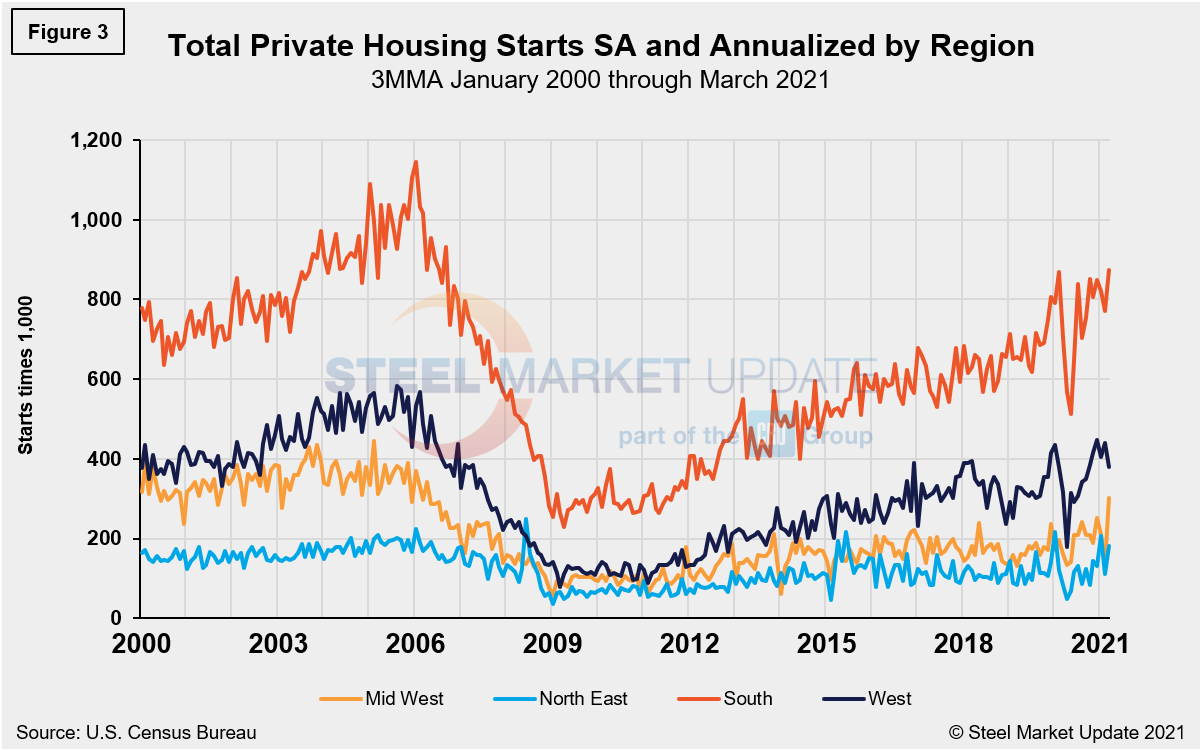
Total housing starts in the four regions are displayed below (Figure 3). Privately-owned housing starts in March were at a seasonally adjusted annual rate of 1.739 million, up 19.4% from the revised February estimate of 1.457 million and up 37.0% from last year when starts totaled 1.269 million. Single-family housing starts in March were at a rate of 1.238 million, or 15.3% above the revised February figure of 1.074 million.
The South region continues to be the strongest for housing starts, while the Northeast trails the other three. All four regions were directly impacted by the widespread COVID-19 shutdowns last year, causing housing starts to fall dramatically. Since then, however, they have nearly recovered to pre-pandemic levels and are trending up. The West region has seen a decline recently due to additional COVID-19 mitigation efforts.
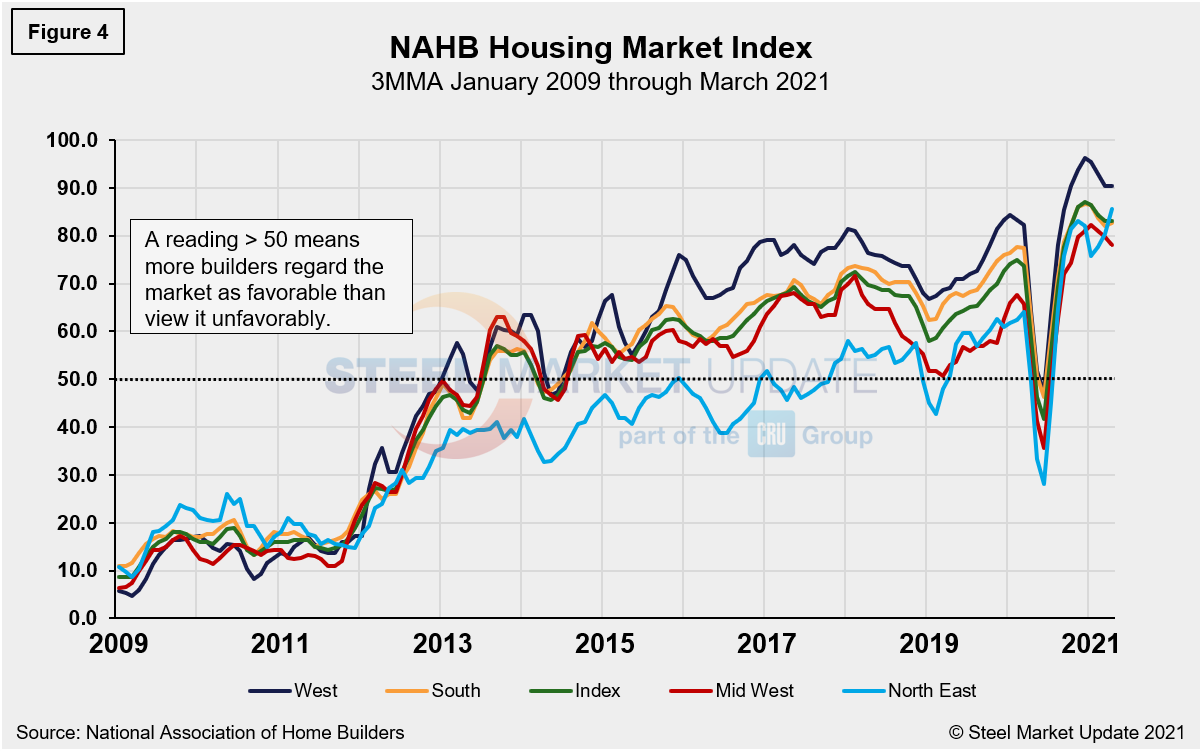
The National Association of Home Builders optimism index plummeted in April 2020 at the onset of COVID-19, but then recovered from May through December last year. Since the beginning of 2021, optimism among home builders has fluctuated up and down within a small range–possibly due to the short supplies and high costs of lumber and other building materials–but remains in very positive territory (Figure 4).
State and Local Construction
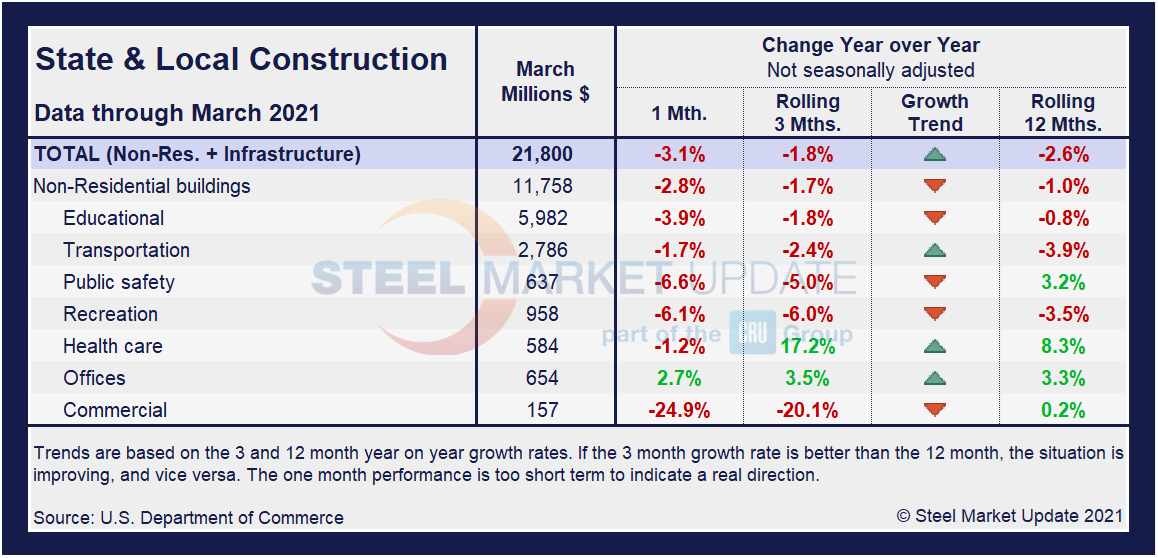
Construction expenditures on a state and local level remain the most impacted by the year-long health crisis. Notably, on a year-on-year and rolling three-month basis, these construction categories and subcategories are still behind pre-pandemic levels. The table below details what in most cases are declining growth rates. Health care expenditures are a bright spot, however.
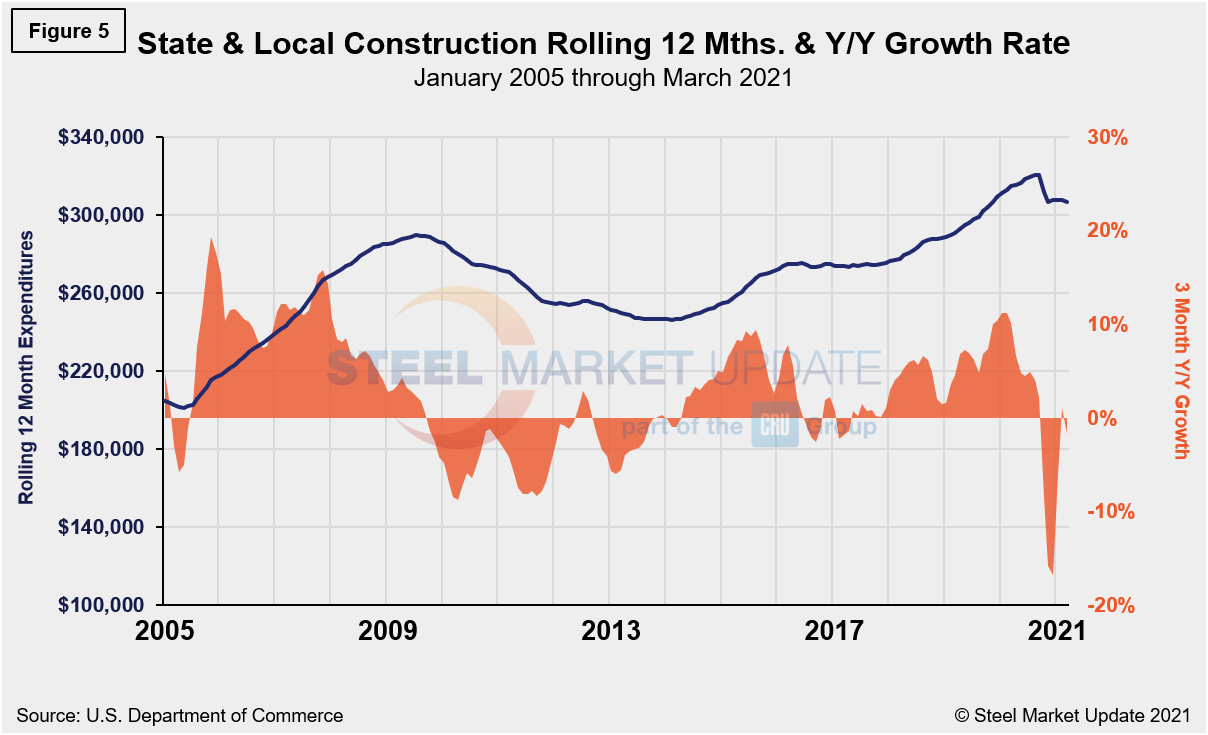
In three months through March, overall state and local construction was trending up, yet five of the eight subcategories were still trending down. In March, the estimated seasonally adjusted annual rate of public construction spending was $343.9 billion, 1.5% below the revised February estimate of $349.0 billion. Educational construction was at a seasonally adjusted annual rate of $85.3 billion, 2.0% below the revised February estimate of $87.1 billion. Highway construction was at a seasonally adjusted annual rate of $98.8 billion, 2.2% down from the revised February estimate of $101.1 billion. Figure 5 shows the history of total S&L expenditures.
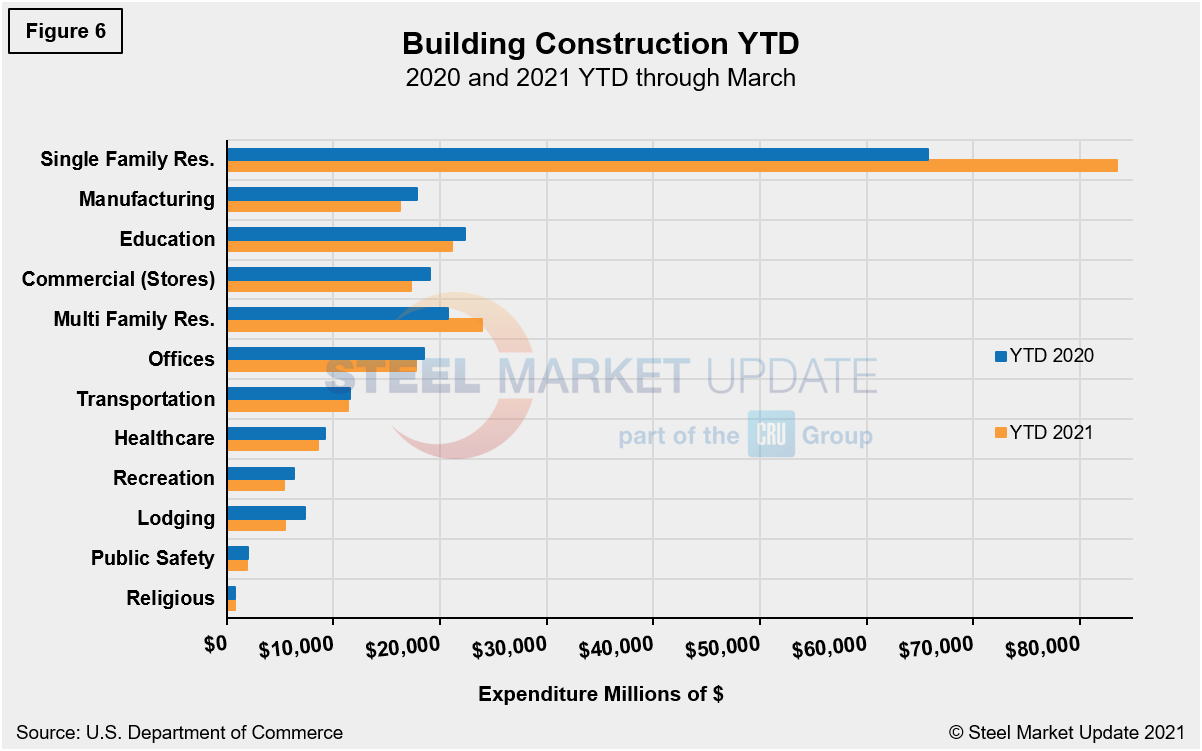
Year-to-date expenditures for construction of the various building sectors for 2020 and 2021 is compared in Figure 6. Single-family residential construction was dominant in 2020 with expenditures totalling $301.9 billion annualized, and it has not let up in 2021. Through March, expenditures for single-family construction were $83.5 billion or 26.9% above year-ago levels when expenditures were $65.8 billion. The only other sector indicating a positive delta year-on-year is multifamily residential at a positive 15.4%. All other sectors are still lagging on a year-to-date basis.
Explanation: Each month, the Commerce Department issues its Construction Put in Place (CPIP) data, usually on the first working day covering activity one month and one day earlier. There are three major categories based on funding source: private, state and local, and federal. Within these three groups are about 120 subcategories of construction projects. SMU analyzes the expenditures from the three funding categories to provide a concise summary of the steel-consuming sectors.
By David Schollaert, David@SteelMarketUpdate.com


