

Market Data

December 9, 2021
Steel Product Shipments and Inventories Through October
Written by David Schollaert
U.S. steel product shipments rose for a sixth straight month in October, expanding by 1.7% versus the prior month. The pace of growth has been steady over the past few months. Steel product shipments have grown at a rate just under 2.0% month on month since July and keeping a steady upward trend since May.
New orders for steel production outpaced steel shipments in October, maintaining a trend seen for much of the year. The dynamic highlights the strong downstream demand the steel industry has seen since nearly coming to a halt at the onset of the pandemic, roughly 19 months ago. The trend is also in line with mill outages, labor shortages, supply chain disruptions, and other factors that continue to impact the steel and manufacturing industries.
Manufacturing inventories saw a much slower rate of rise in October, according to the latest available Census Bureau data on inventories, shipments and new orders for total U.S. manufacturing and steel products. Total manufacturing inventories were up fractionally in October, just 0.8% versus the month prior, but up 8.7% and 7.6% when compared to the same 2020 and 2019 months, respectively. Steel product inventories have seen a far more pronounced growth rate over the same period. Although October’s total is up just 2.7% from the month prior, it’s up 27.6% versus the same 2020 period. The strong recovery in steel product inventories has rebounded above the 2019 pre-pandemic year by a noteworthy 16.5%.
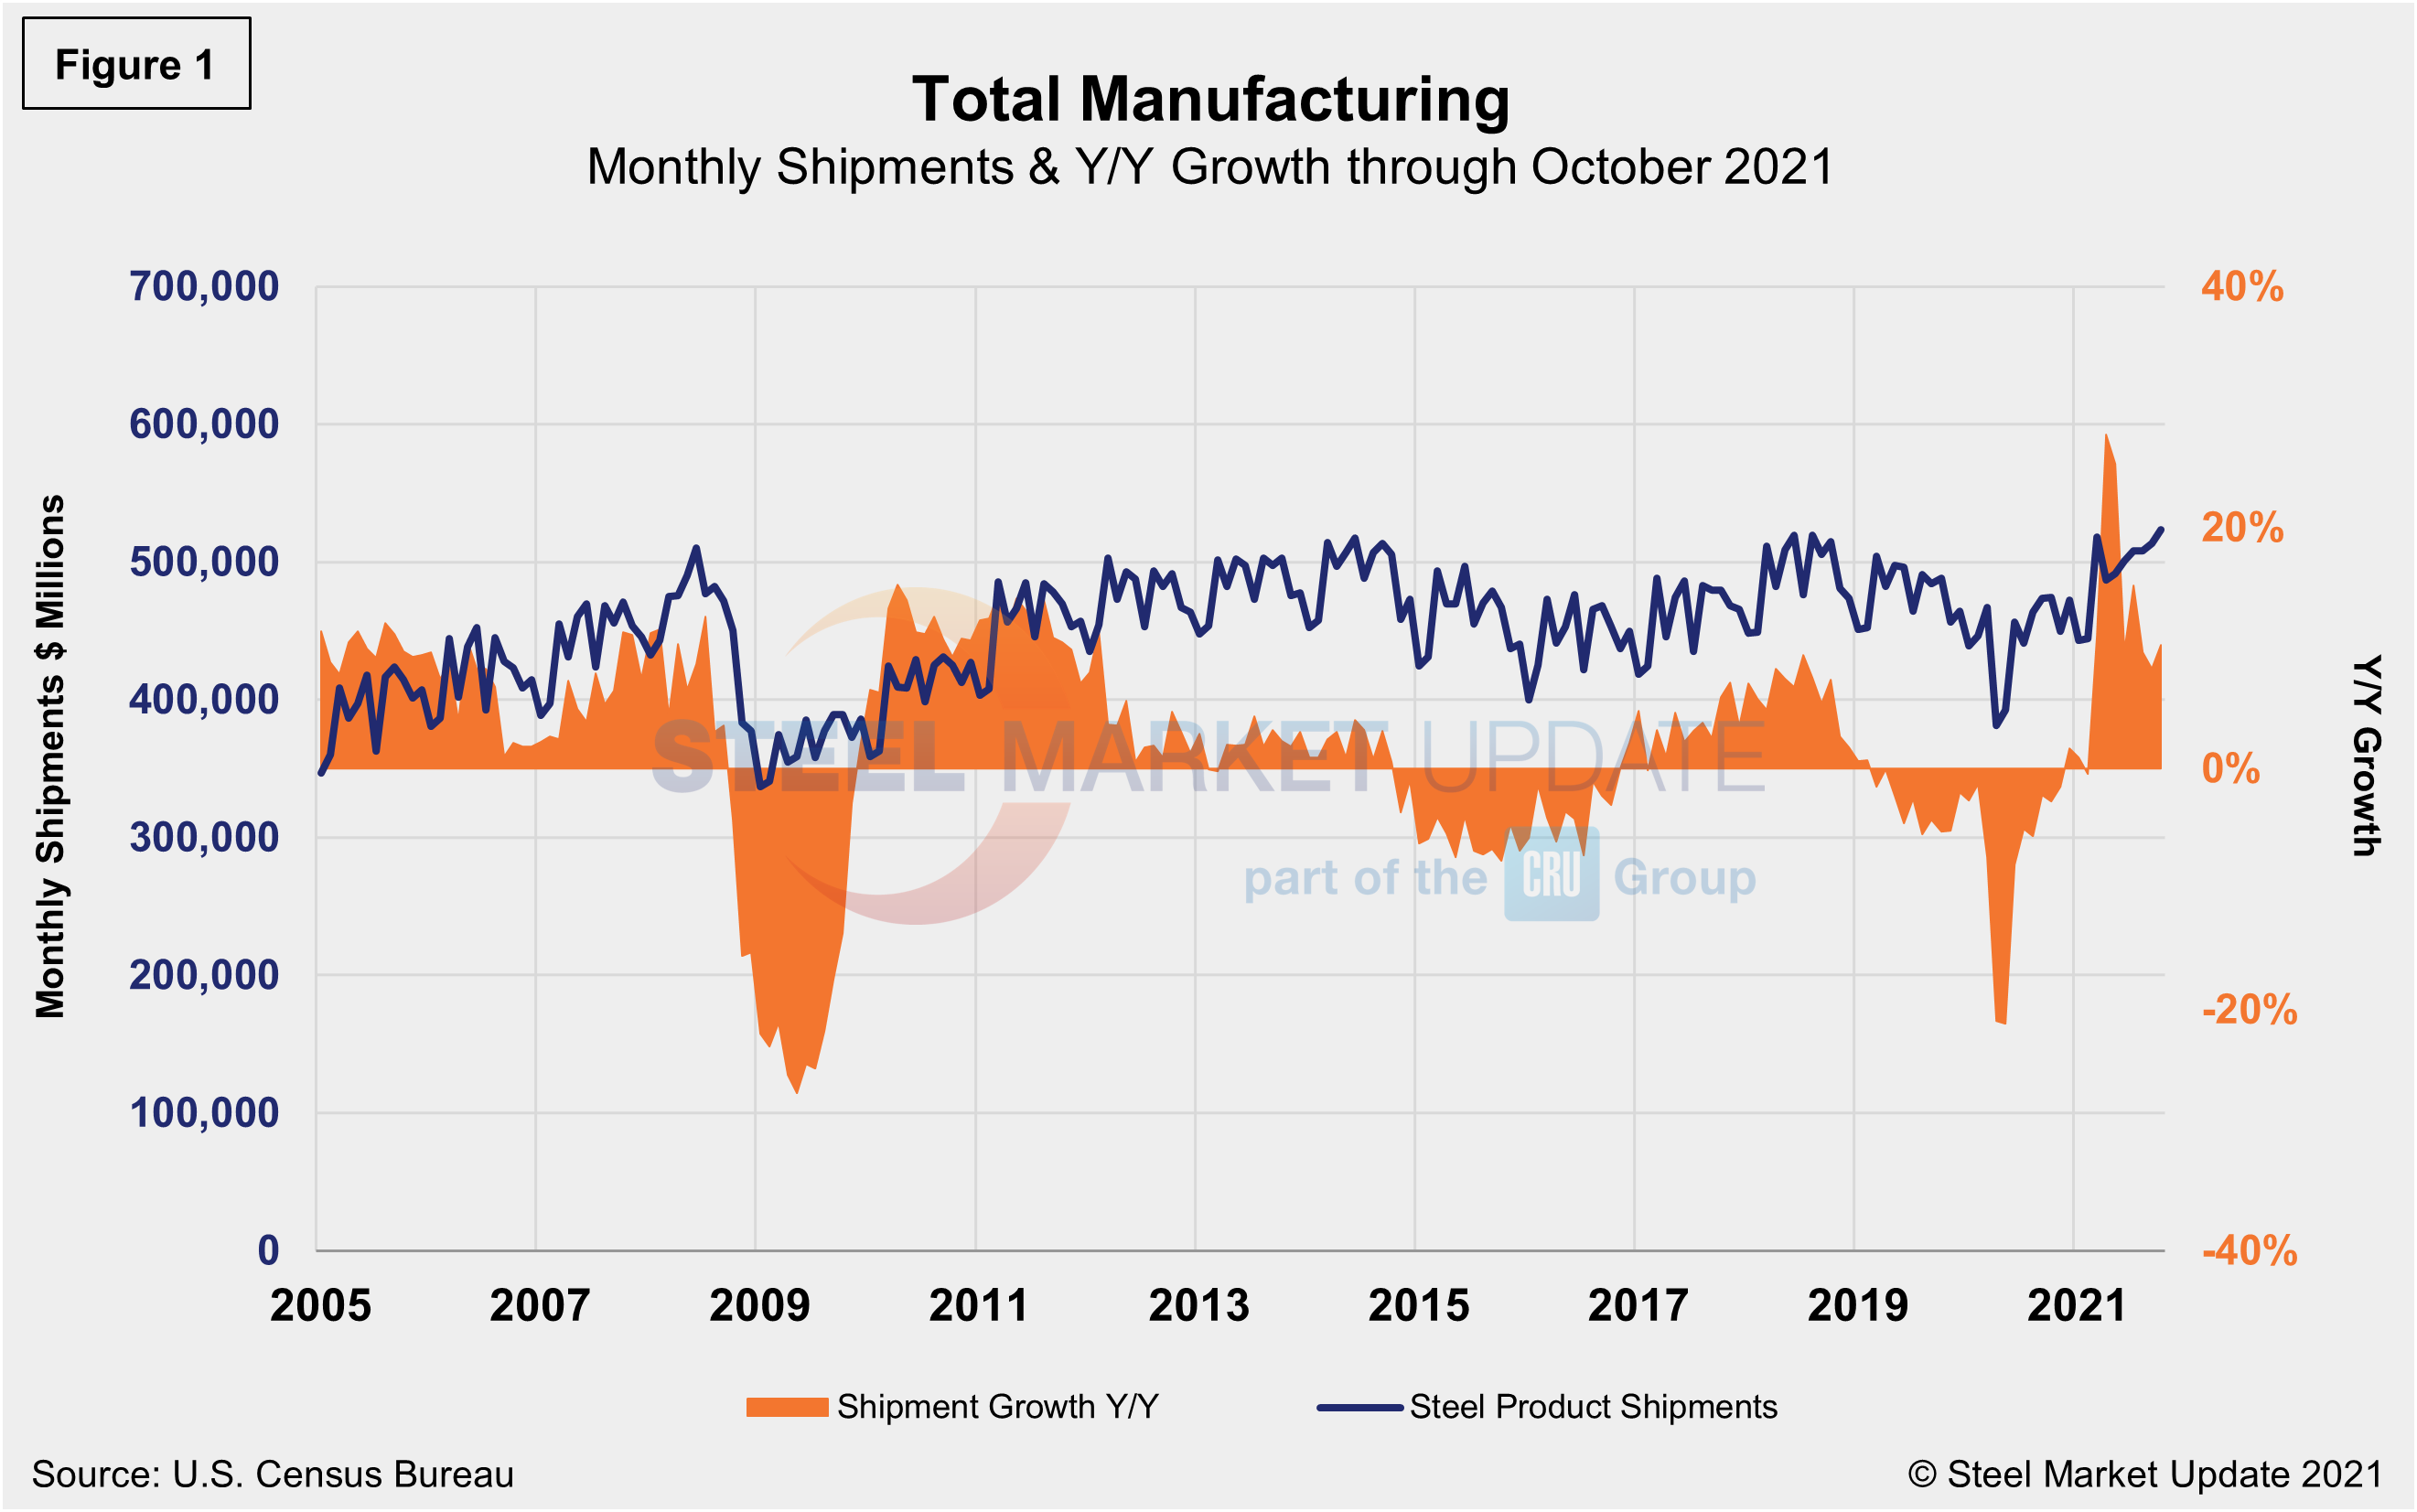
Total shipments and inventories are reported in millions of dollars, seasonally adjusted. Total steel shipments in October were 39.1% higher than in the same year-ago period and 27.4% higher when compared to the same pre-pandemic period in 2019. Year over year through October, total manufactured product shipments rose by 10.3%, and were up 7.2% when compared to the first 10 months of 2019. During the first wave of the global pandemic last April, total manufacturing shipments plunged by 19.4% and steel product shipments fell by 21.4% compared with the prior year. Both have steadily recovered since. Figure 1 and Figure 2 show the history of both since 2005.
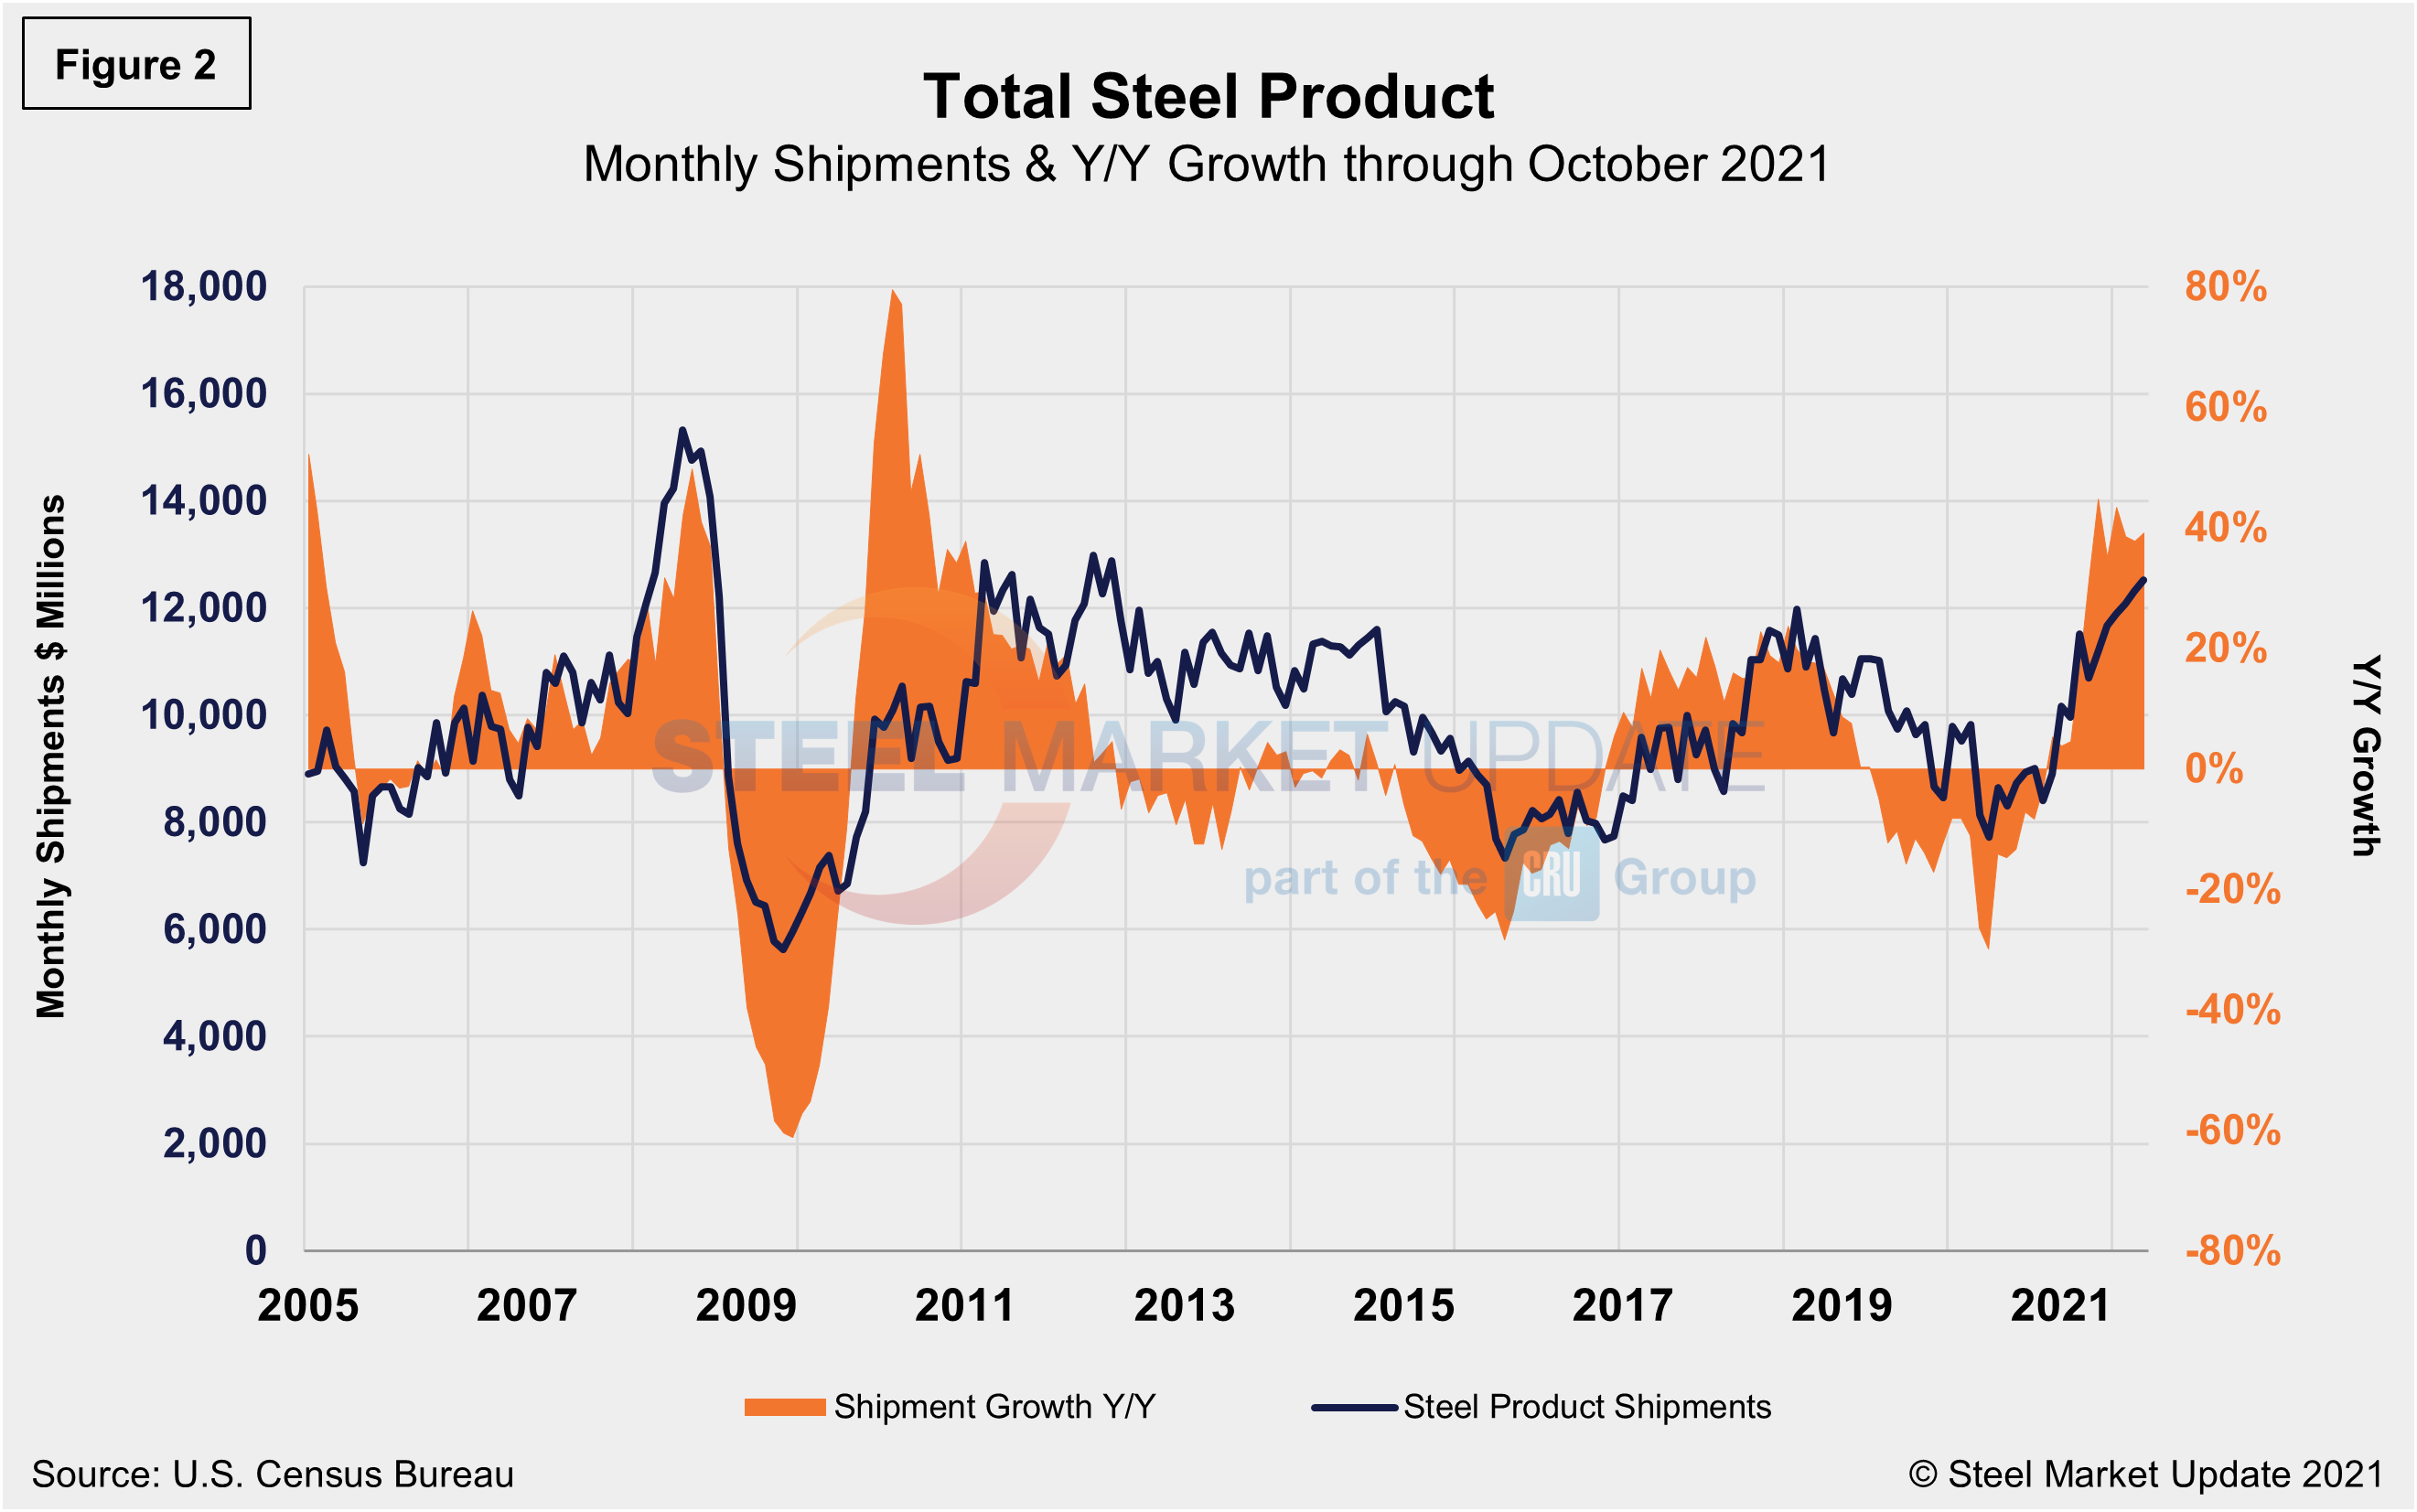
Monthly steel product shipments through October are detailed in Figure 2. Shipments of steel products totaled $12.515 billion in October, up 1.7% from the $12.310 billion in September, and up 39.1% from year-ago levels when shipments were $8.995 billion. Shipments of steel products had most recently peaked in August 2018 at $11.980 billion, then began a 20-month decline through May 2020. Although the growth rate declined from 23.6% in July 2018 to 3.8% through January 2021, the steady growth since has pushed shipments of steel products to their highest level to date.
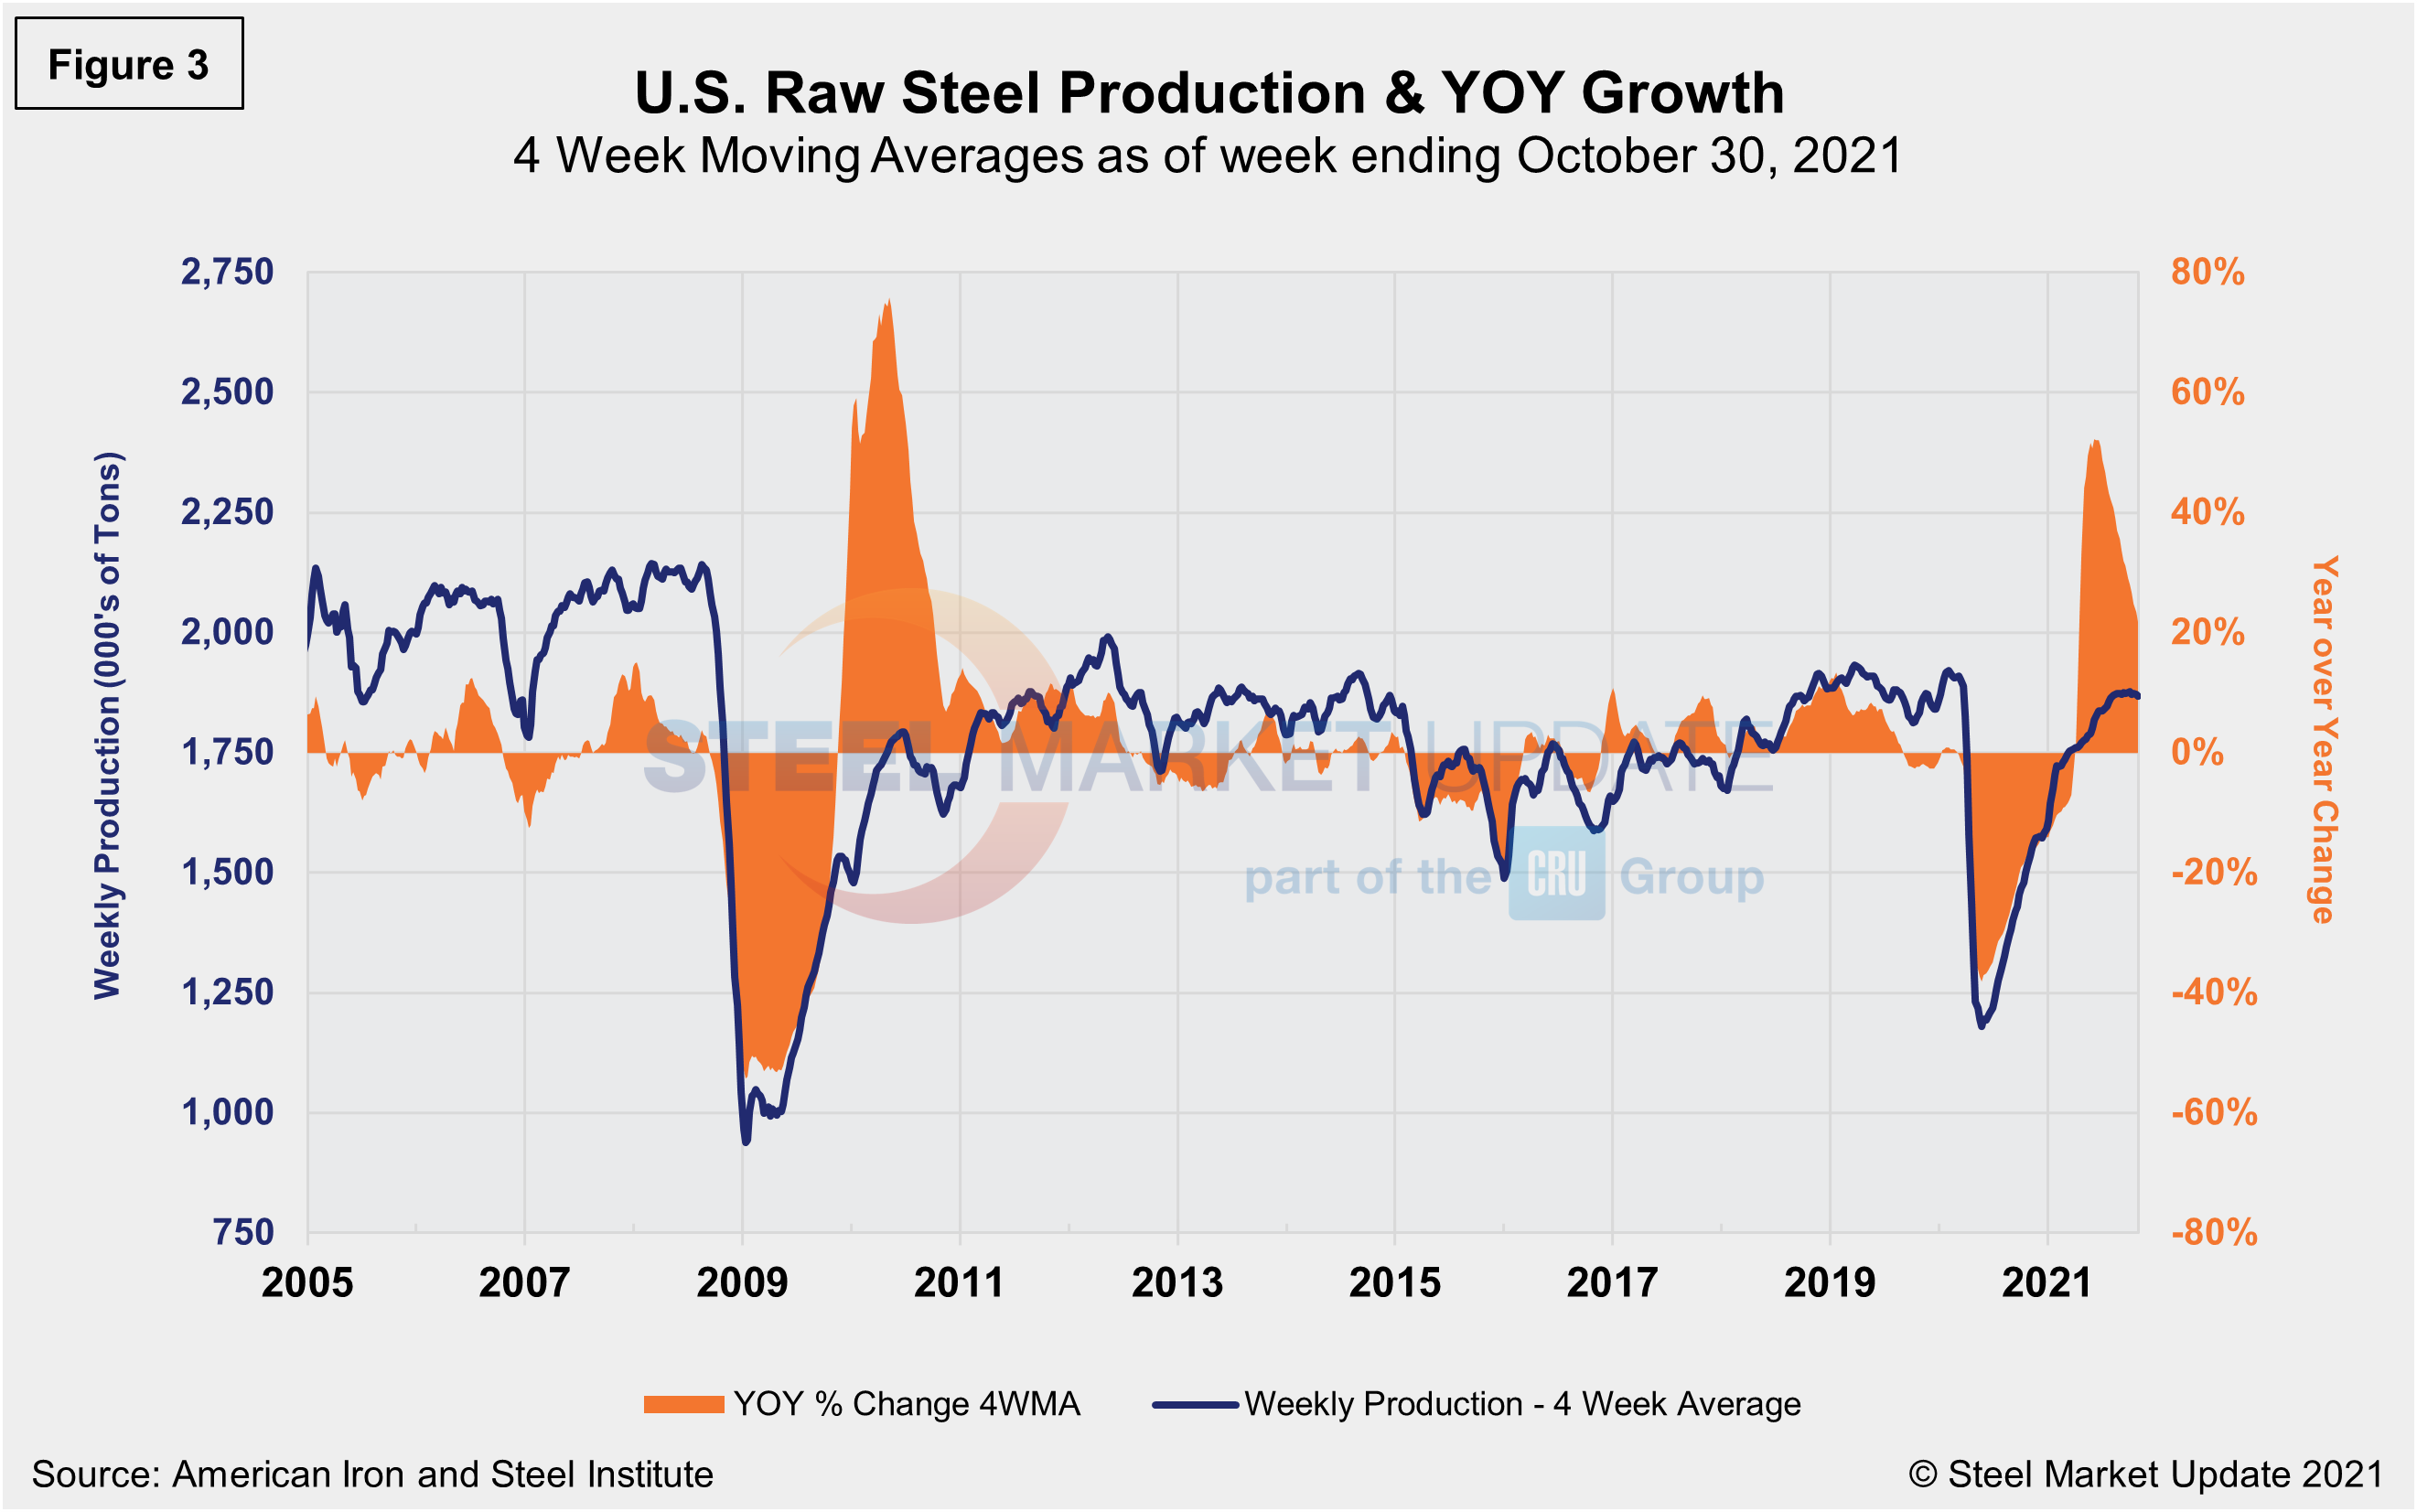
The Census data in Figure 2 compares well over the long term with the American Iron and Steel Institute (AISI) weekly crude steel production shown in Figure 3. Figure 2 is in dollars and Figure 3 is in tons, but they paint a similar picture. Steel production has rebounded since the freefall seen during the first wave of the pandemic, according to AISI data shown on a four-week moving average basis. Crude steel production was up 21.7% in the week ending Oct. 30 compared the same period a year ago.
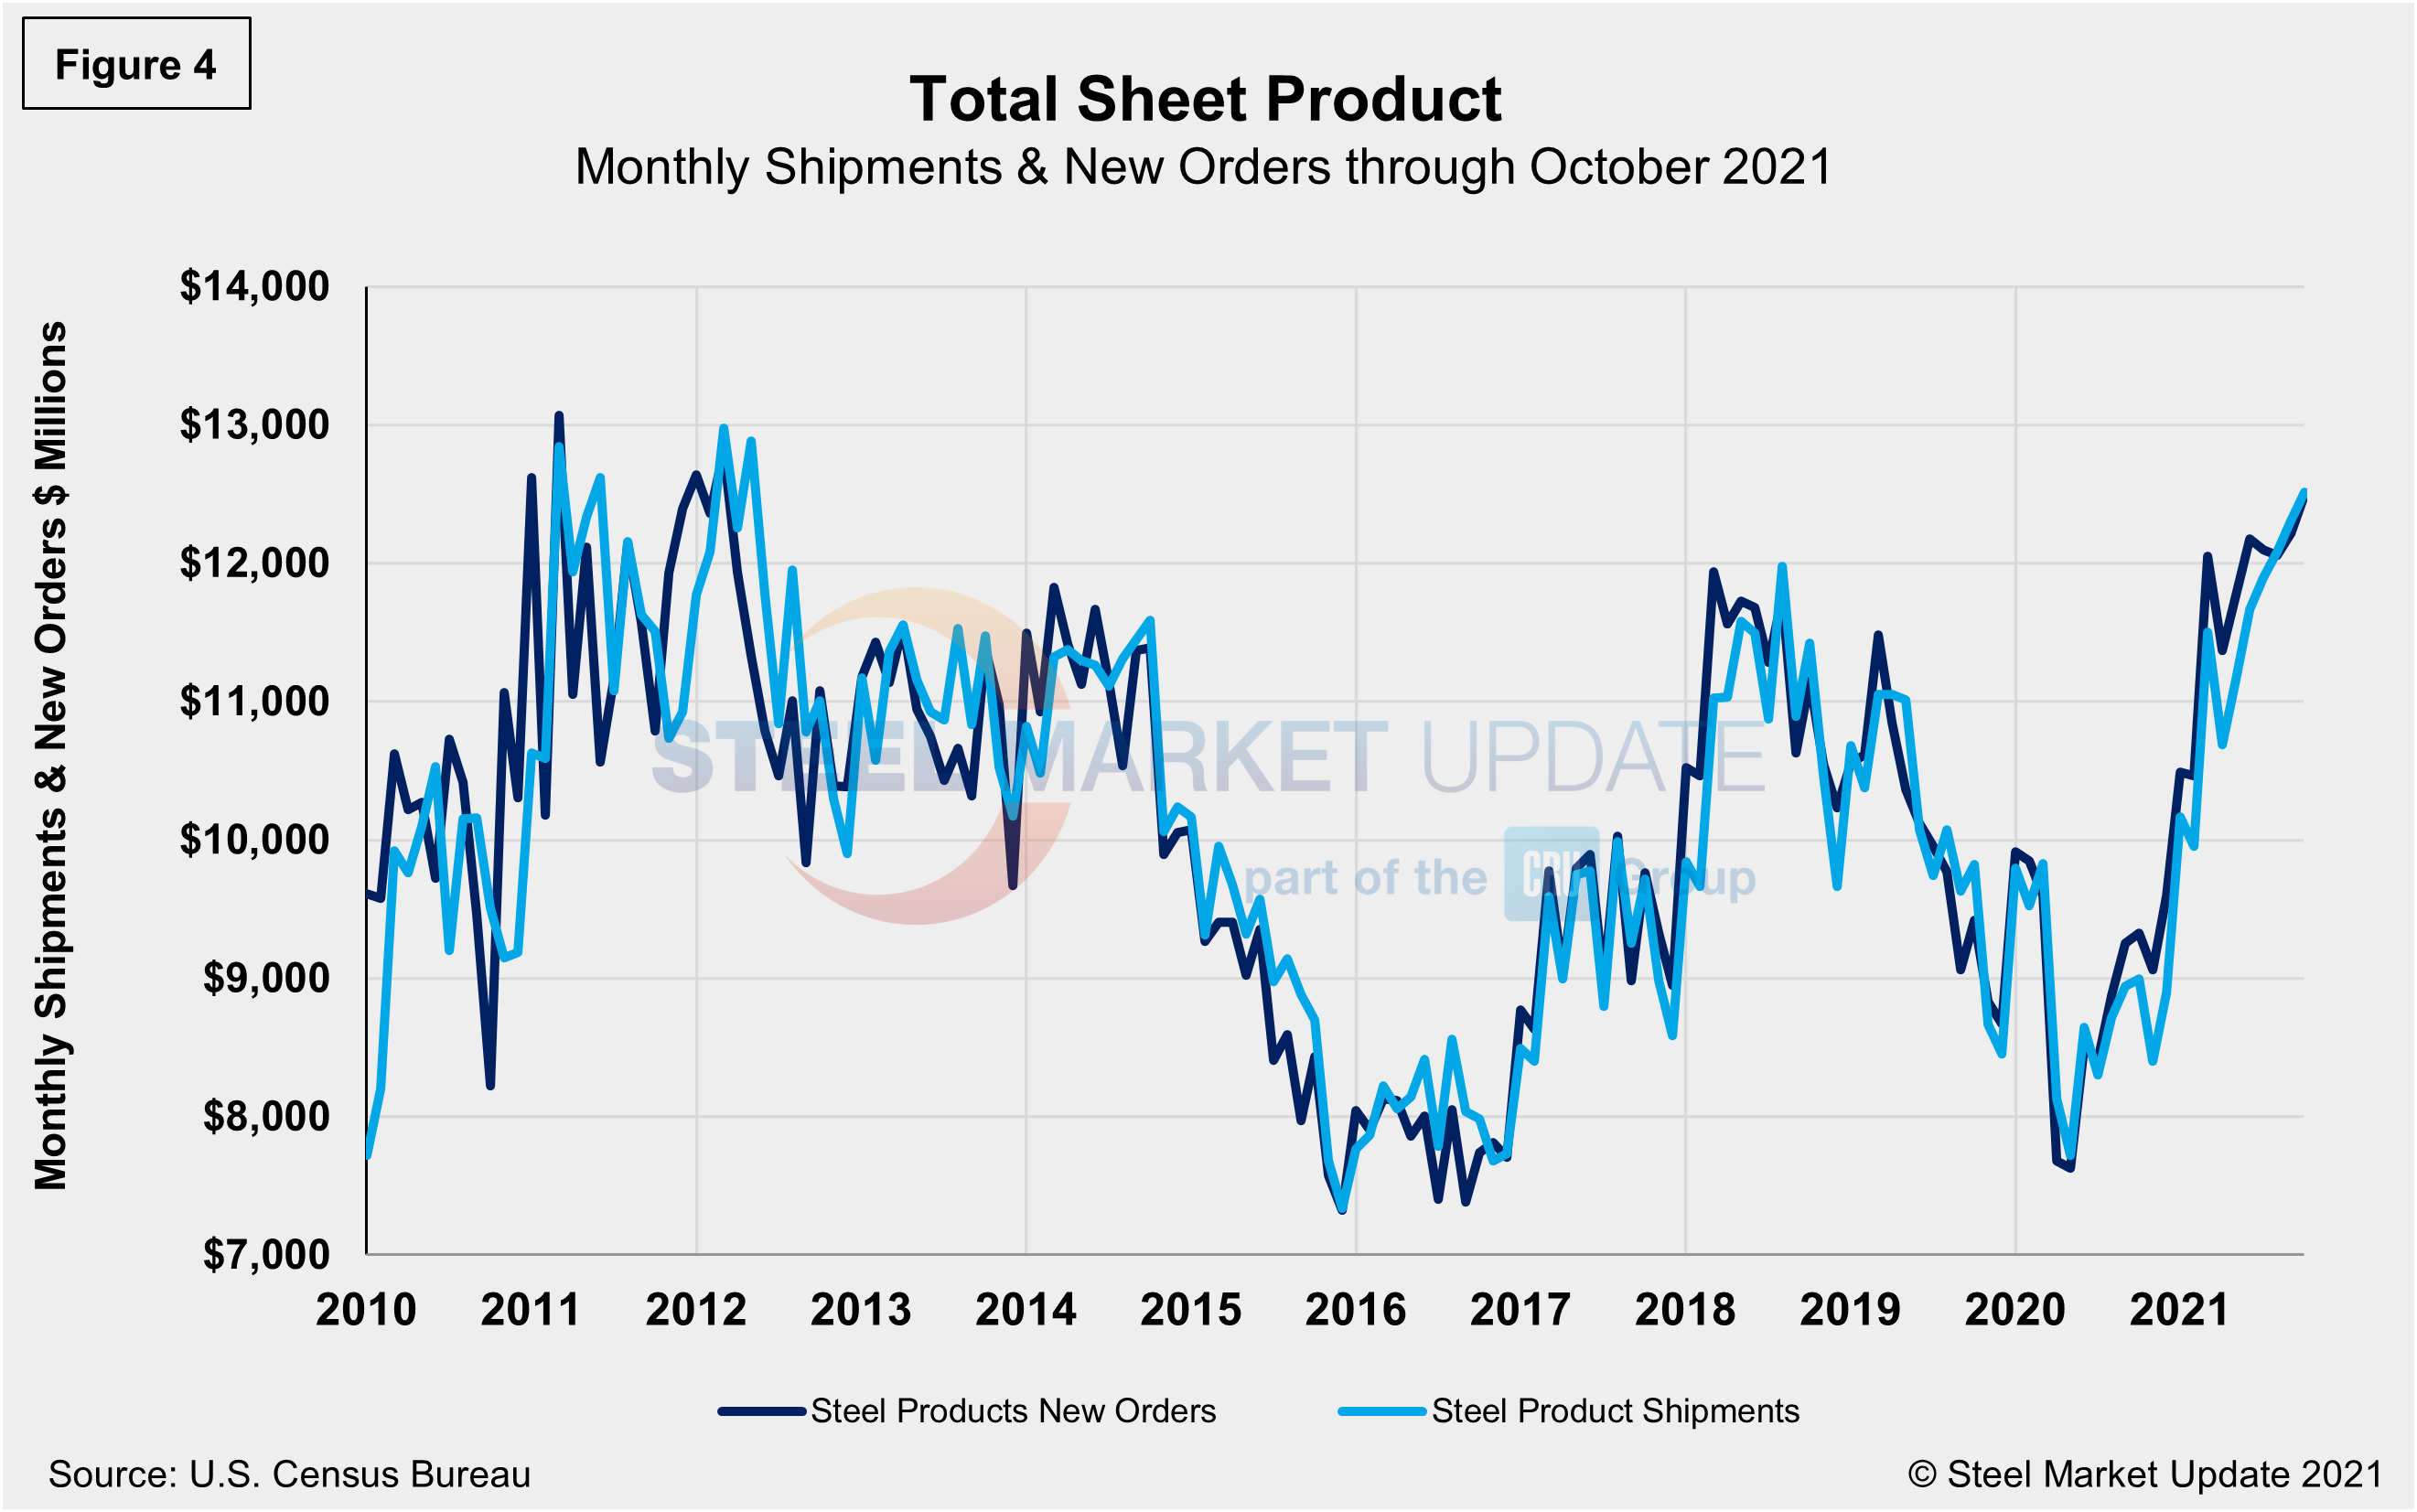
Steel product shipments and new orders on a monthly basis since 2010 are shown in Figure 4. New orders and shipments saw similar declines last April, but were back in balance by June. Since then, however, new orders have exceeded shipments and continue to steadily outpace them. Yet in October, new orders totaled $21 million less than shipments as steel prices have stabilized.
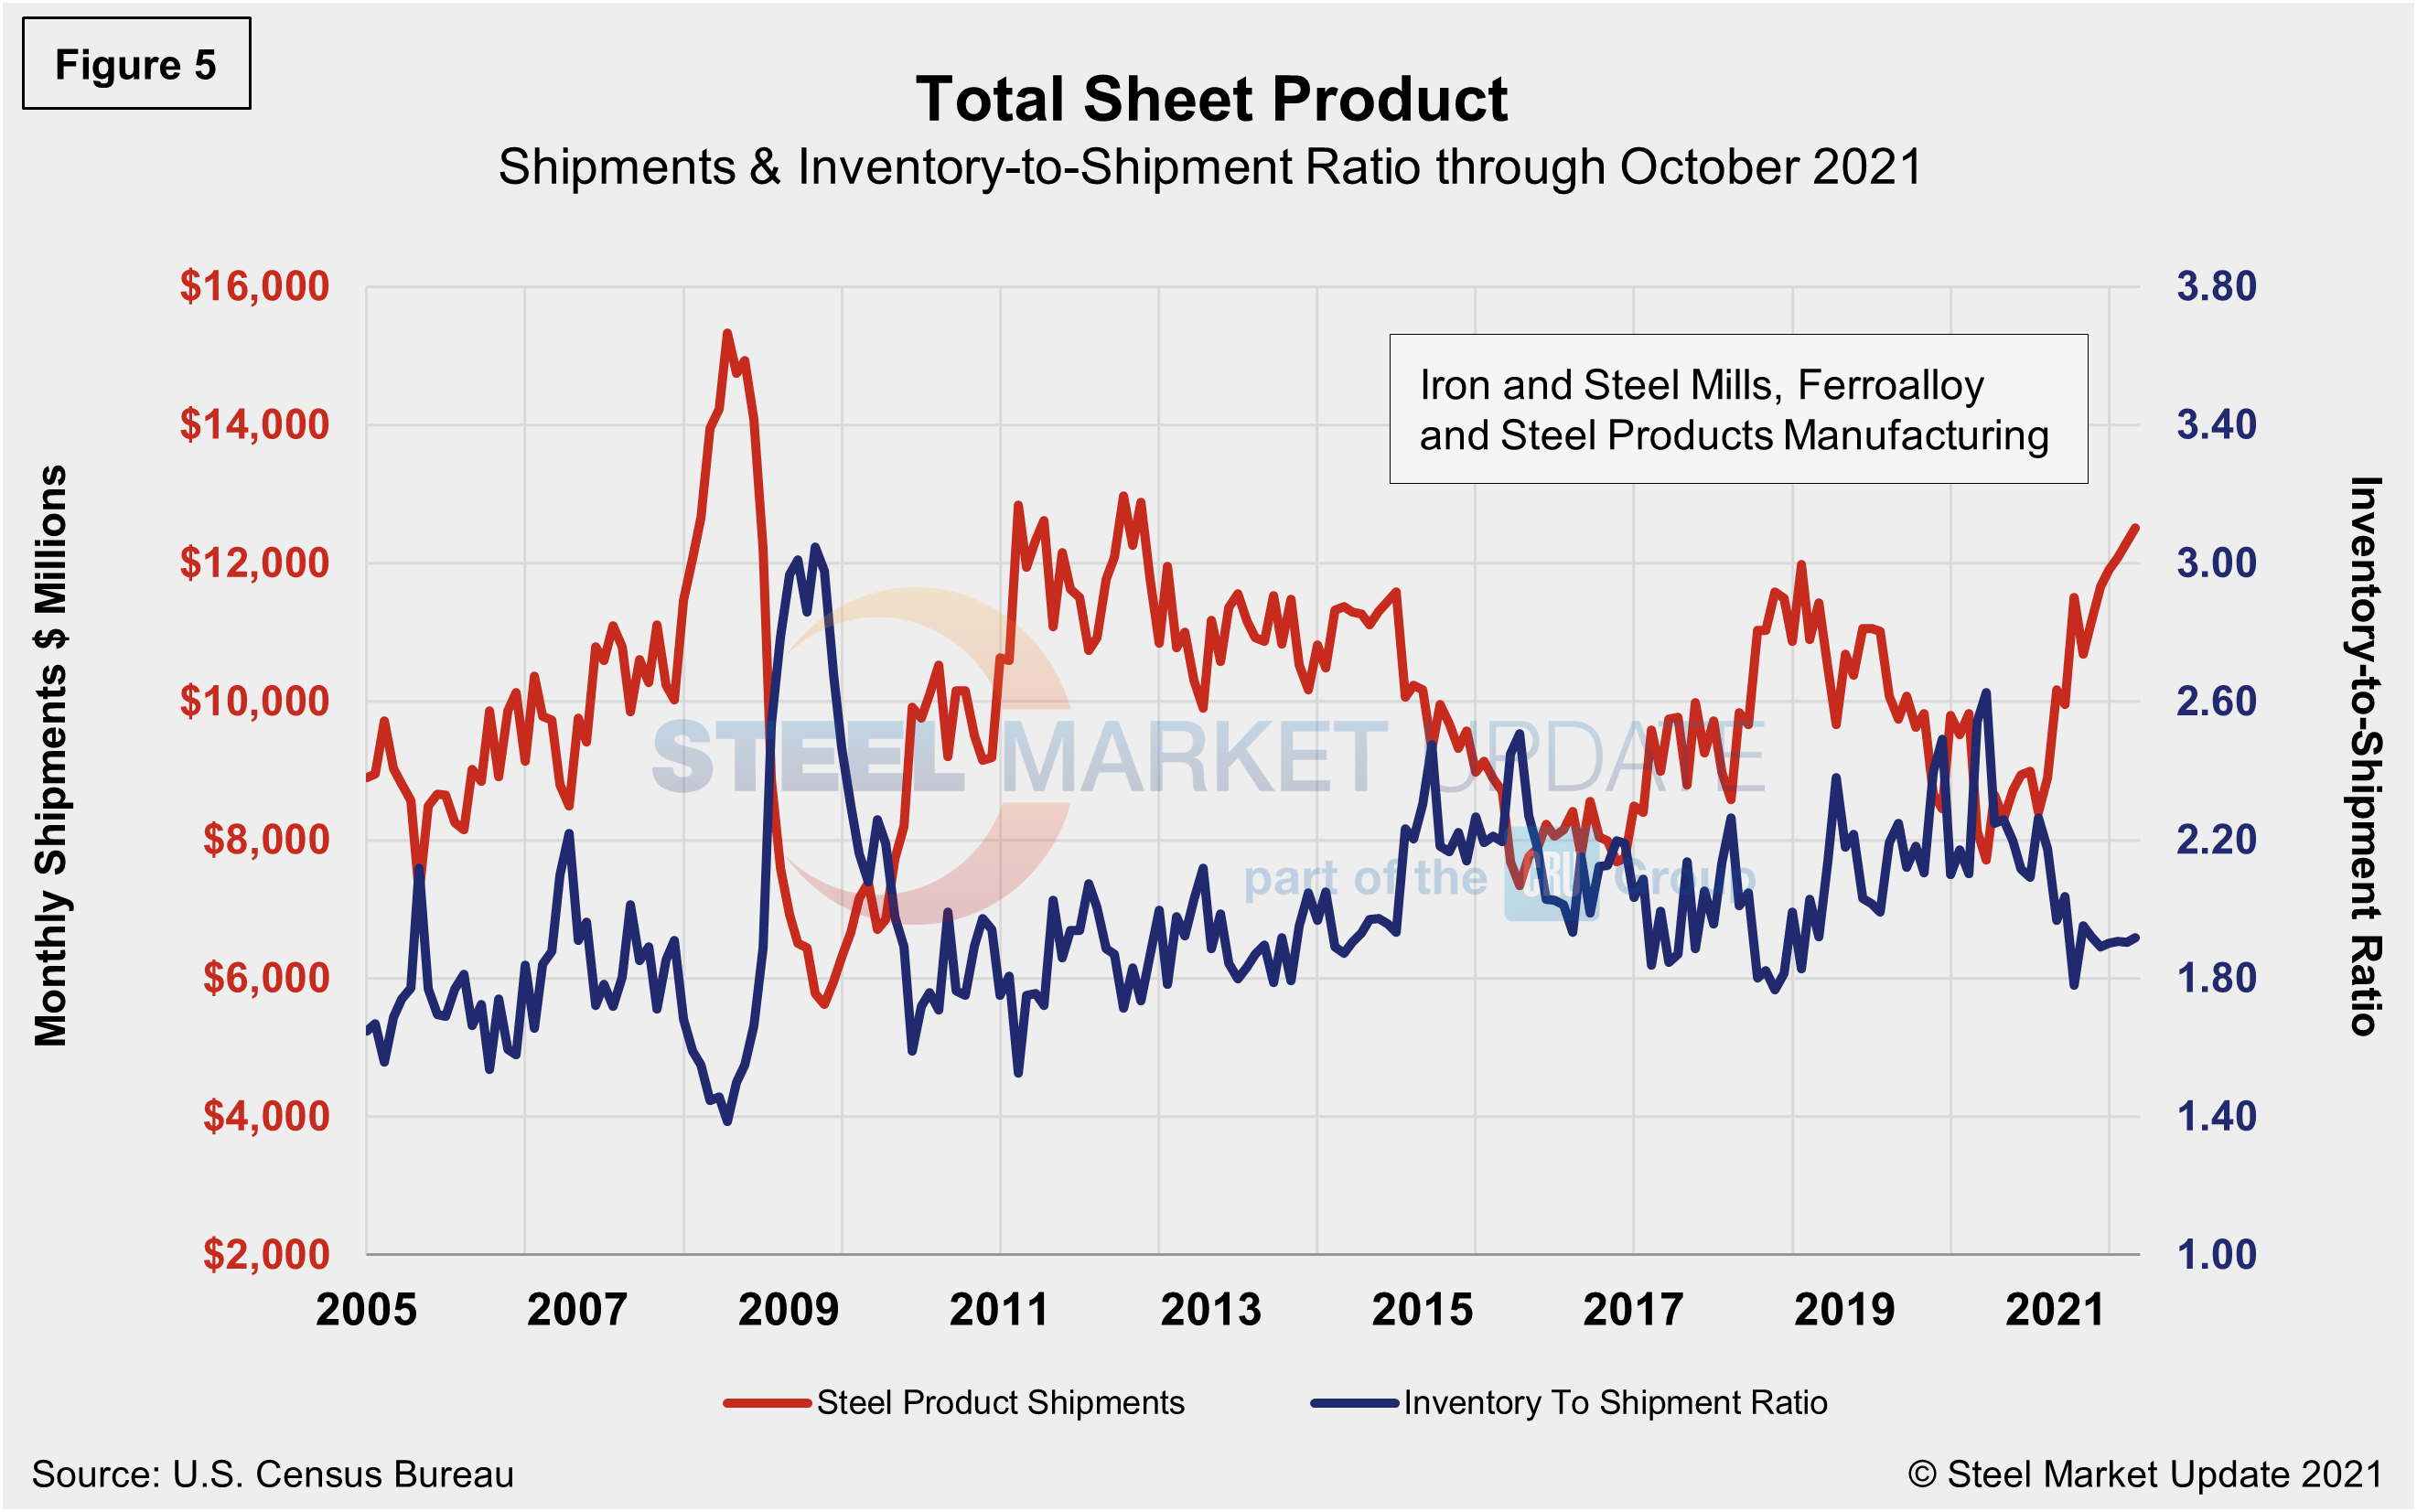
The same total shipment line as in Figure 2 is shown below in Figure 5, but now includes the inventory-to-shipment (IS) ratio. The IS ratio is a measure of how much inventory is necessary to support the level of shipments. Thus the lower the IS ratio, the better. The IS ratio for steel products shot up in May 2020 to 2.62% as shipments declined due to supply-chain disruptions from COVID-19-related closures. Now, nearly approaching the two-year mark since the onset of the pandemic, the IS ratio was at 1.92%, up a fraction of a percentage point, as demand was still outpacing supply through October.
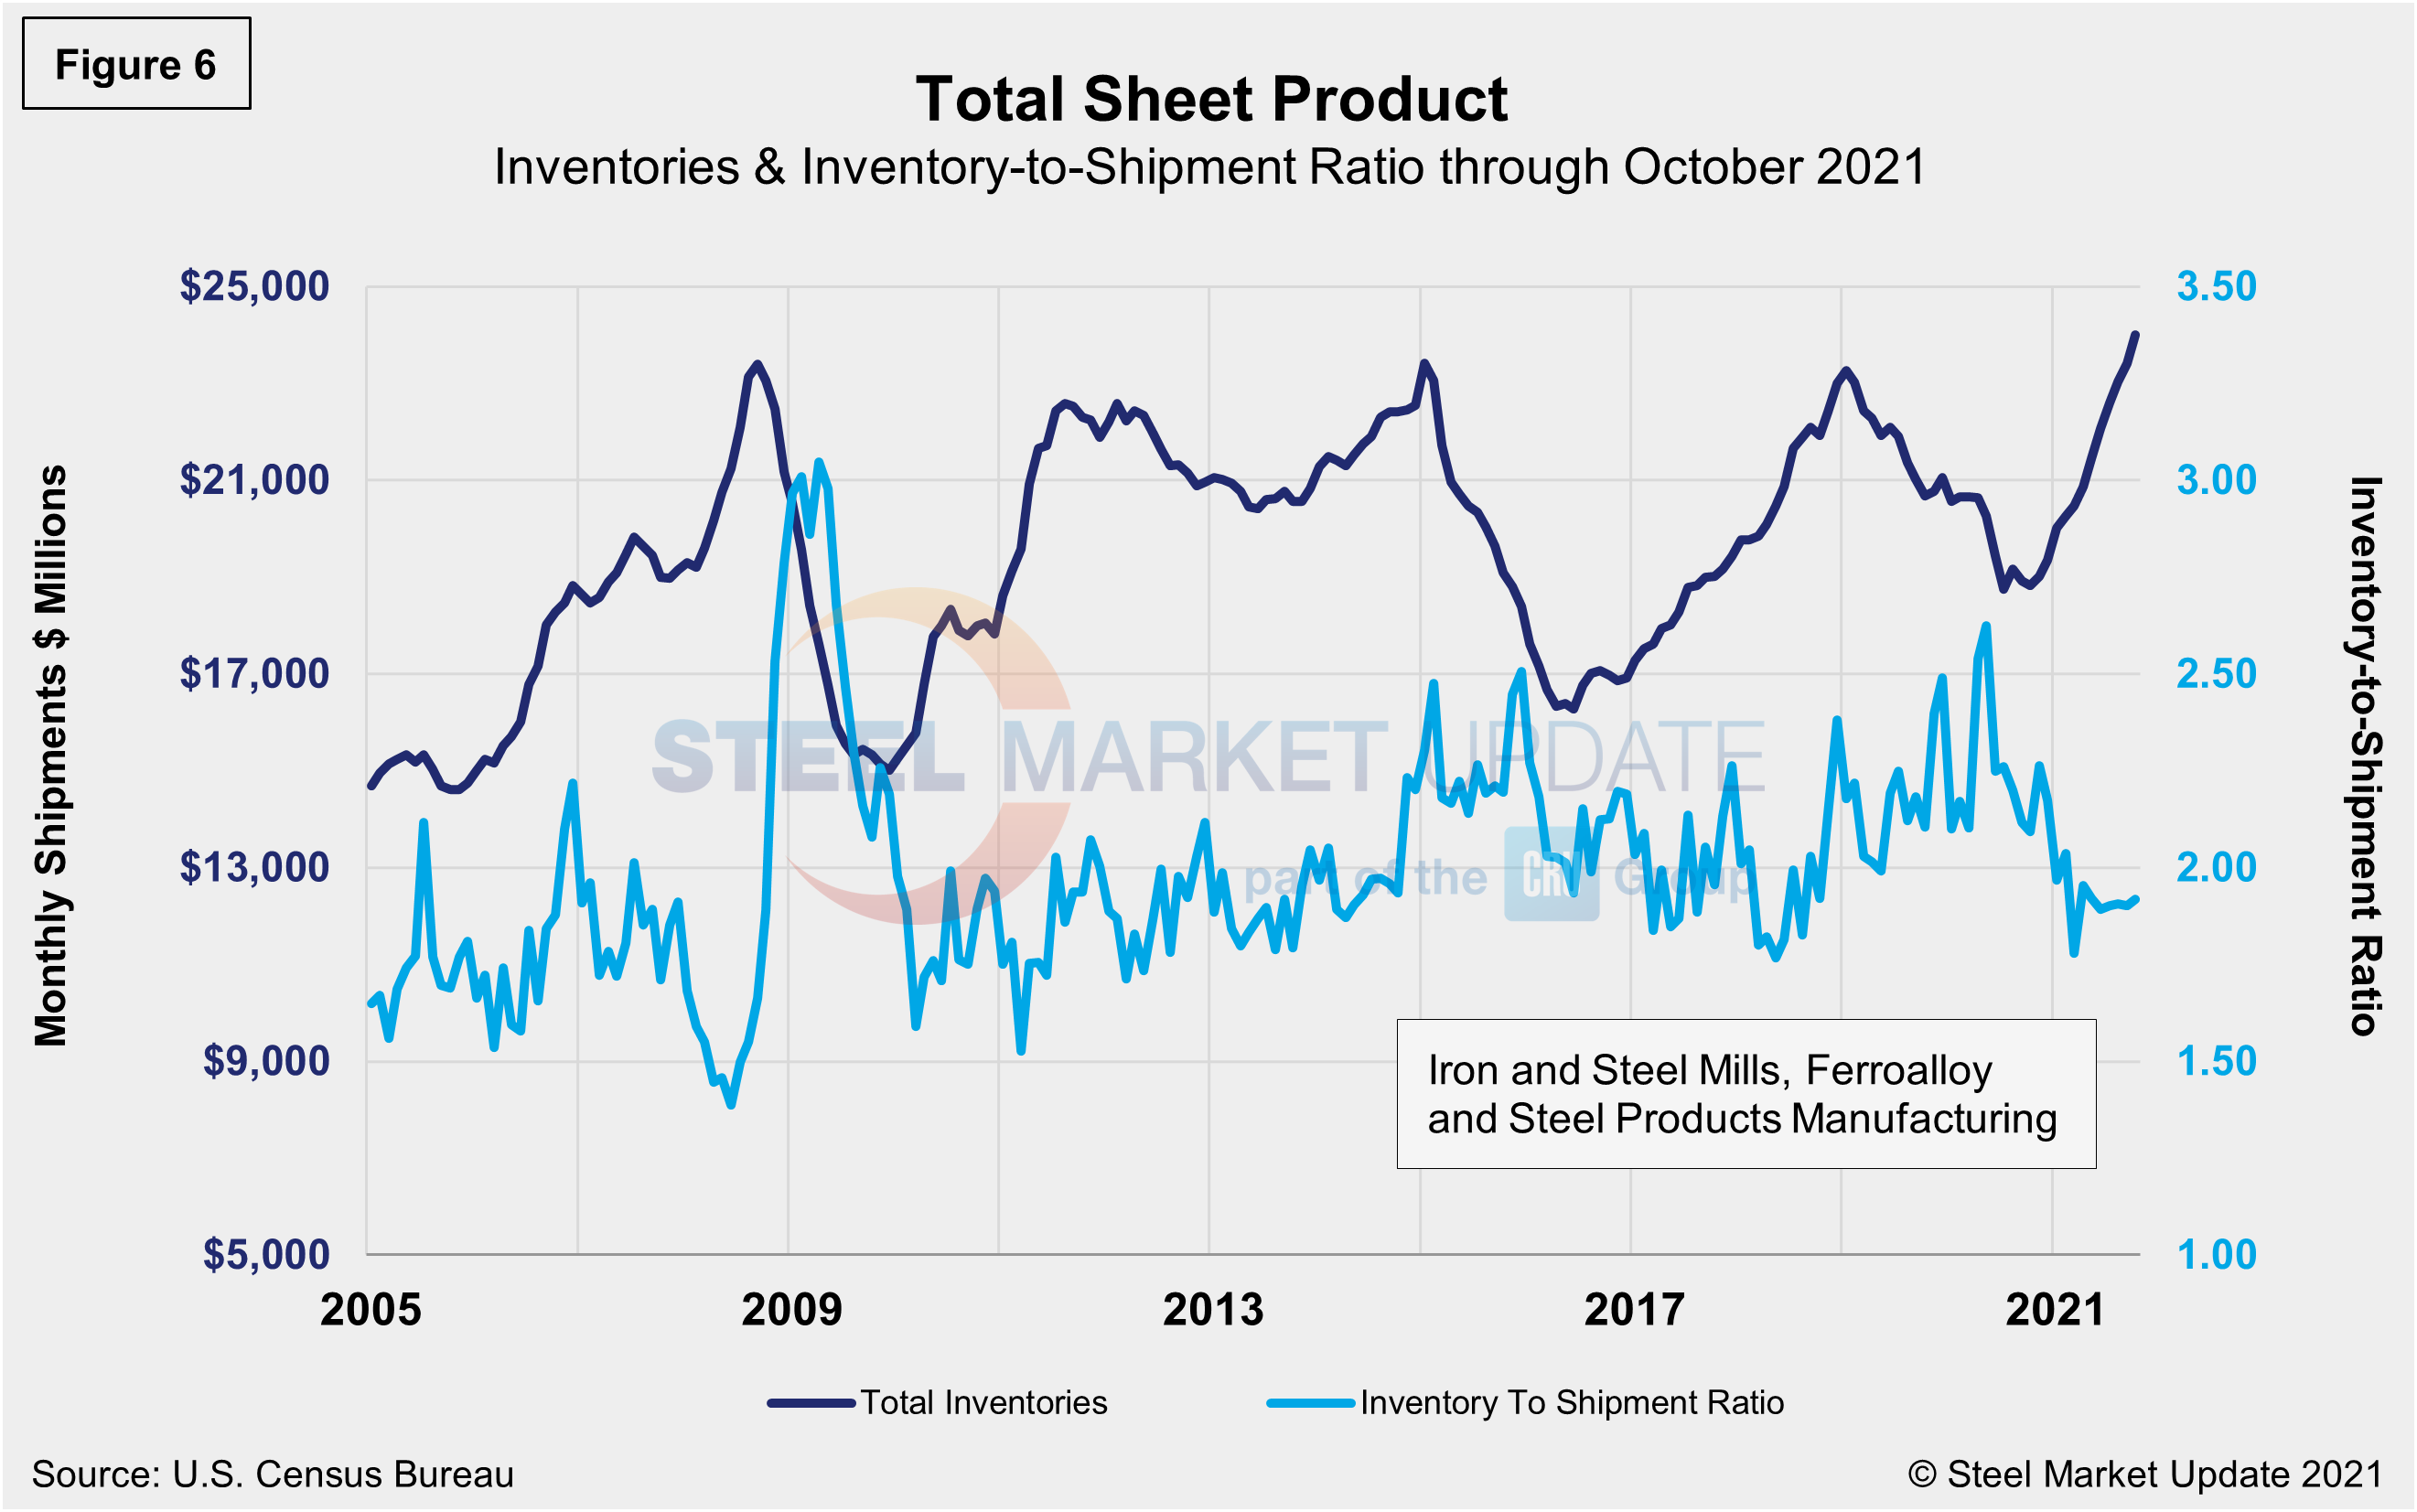
The IS ratio had been inconsistent through the first few months in 2021, reflecting weather-related delays, temporary disruptions, and maintenance outages. Total inventories were up just 8.7% in October, when compared to the same year-ago period, while shipments were up 10.3% during the same period. These dynamics highlight the steady demand and controlled inventories across the steel spot market. Overall, steel shipments have improved by 62.2% since May 2020, when the market reached bottom. Total inventory in millions of dollars is displayed in Figure 6 and echoes the inventory-to-shipment ratio shown in Figure 5.
By David Schollaert, David@SteelMarketUpdate.com


