

Market Data

February 23, 2022
January ABI Shows More Growth for Construction
Written by David Schollaert
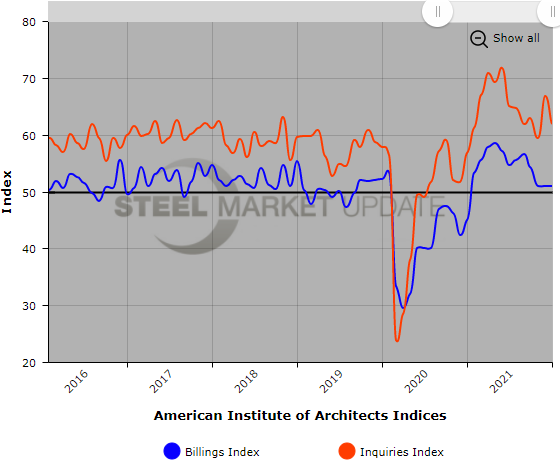
Demand for design services from architecture firms in the U.S. strengthened for the 12th straight month in January, with AIA’s Architecture Billings Index registering 51.0, according to the latest report from the American Institute of Architects. The ABI is an advance economic indicator for nonresidential construction activity with a lead time of 9-12 months. A score above 50 indicates an increase in activity and a score below 50 a decrease.
The pace of growth of the ABI has moderated, however, the report noted. For the first nine months of the current design recovery, the average ABI score was almost 56, while the past three months the average score was barely over 51.
“This more modest growth in the ABI no doubt reflects challenges in the construction sector – supply challenges for both labor and materials – as well as ongoing staffing constraints at architecture firms,” said AIA.
The index for new project inquiries contracted by 4.0 points to 62.0, while the new design contracts index rose from a reading of 55.5 in December to 56.1 last month.
“Business conditions at architecture firms entering 2022 were essentially the same as when they ended 2021. New project inquiries remain very strong, and new design projects continue to come into architecture firms at a healthy pace. The monthly new design contracts score has exceeded the billings score at firms in 10 of the 12 months since the design upturn got underway, suggesting that project backlogs at firms continue to grow. This expanding backlog will serve as a cushion to ensure healthy future workloads over the coming quarters,” said AIA.
Key ABI highlights for January include:
- Regional averages: Midwest (51.5); South (61.2); West (47.6); Northeast (46.8)
- Sector index breakdown: mixed practice (46.3); commercial/industrial (54.2); multifamily residential (50.1); institutional (47.3)
Regional and sector scores are calculated as three-month averages.
Below is a graph showing the history of the AIA Architecture Billings Index. You will need to view the graph on our website to use its interactive features; you can do so by clicking here. If you need assistance logging into or navigating the website, please contact us at info@SteelMarketUpdate.com.
By David Schollaert, David@SteelMarketUpdate.com


