

Analysis

March 18, 2022
Heating and Cooling Equipment Shipments Decline Slightly in January
Written by Brett Linton
U.S. heating and cooling equipment shipments in January slipped 1.7% from December to 1.82 million units, according to recent data from the Air-Conditioning, Heating, and Refrigeration Institute (AHRI). Total shipment levels were down 1.3% from those seen one year prior. The highest level was seen last June when 2.32 million units were shipped in a single month.
Recall that total 2021 shipments were 24.3 million units, up 9.8% compared to 22.2 million units shipped in the same period of 2020. In 2020, shipments were somewhat erratic. Shipments in the second quarter were significantly impacted by the coronavirus shutdowns, resulting in a surge in Q3/Q4 shipments as manufacturers ramped up production.
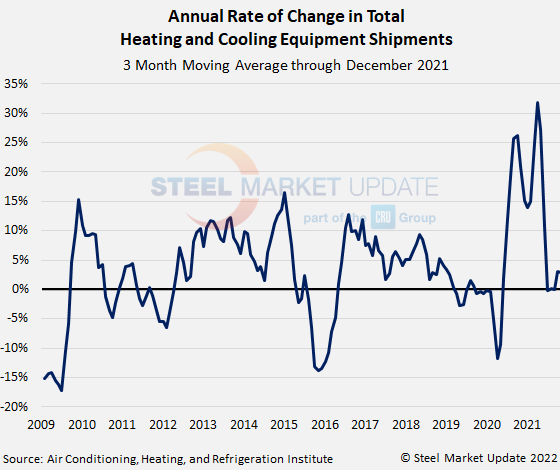
As shown in the chart below, total heating and cooling shipments on a three-month moving average (3MMA) basis are up 2.8% year over year. May and June 2021 hold the record high 3MMA annual rates of change at 31.9% and 27.2%, respectively. The record high prior to 2020 was 16.6% in February 2015.
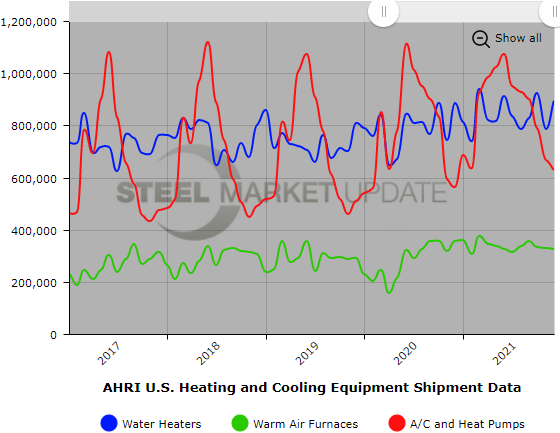
Residential and commercial storage water heater shipments decreased 6.6% year over year to a combined 757,877 units in January; 746,013 units were shipped for residential use and 11,864 units for commercial use. The number of commercial water heater units shipped in January fell to the lowest rate seen since November 2013. The sum of all water heater shipments in January was the lowest seen since February 2021. Prior to this month, water heater shipments had increased on a year-over-year basis for the prior four months.
January shipments of warm air furnaces totaled 309,644 units, a decrease of 13.7% compared to the same month last year.
Central air conditioners and air-source heat pump shipments were up 10.4% from levels one year ago to 757,278 total units in January; 431,835 air conditioners and 325,443 heat pumps were shipped. This marks the third consecutive month that shipments have increased on a year-over-year basis.
The full press release is available on the AHRI website here.
Below is a graph showing the history of total water heater, warm air furnace and air conditioner shipments through January data. To use its interactive features, view the graph on our website by clicking here. For assistance with either logging in or navigating the website, contact Info@SteelMarketUpdate.com.
By Brett Linton, Brett@SteelMarketUpdate.com


