

Market Data

May 31, 2022
SMU Steel Buyers Sentiment Index Dips, Future Expectations Fall
Written by Brett Linton
Steel Market Update’s Steel Buyers Sentiment Index fell 8 points last week, now at the third-lowest level seen in the past 13 months. Our Future Sentiment Index fell 16 points, the largest survey-to-survey decline since March 2020 (when sentiment fell in response to the Covid pandemic).
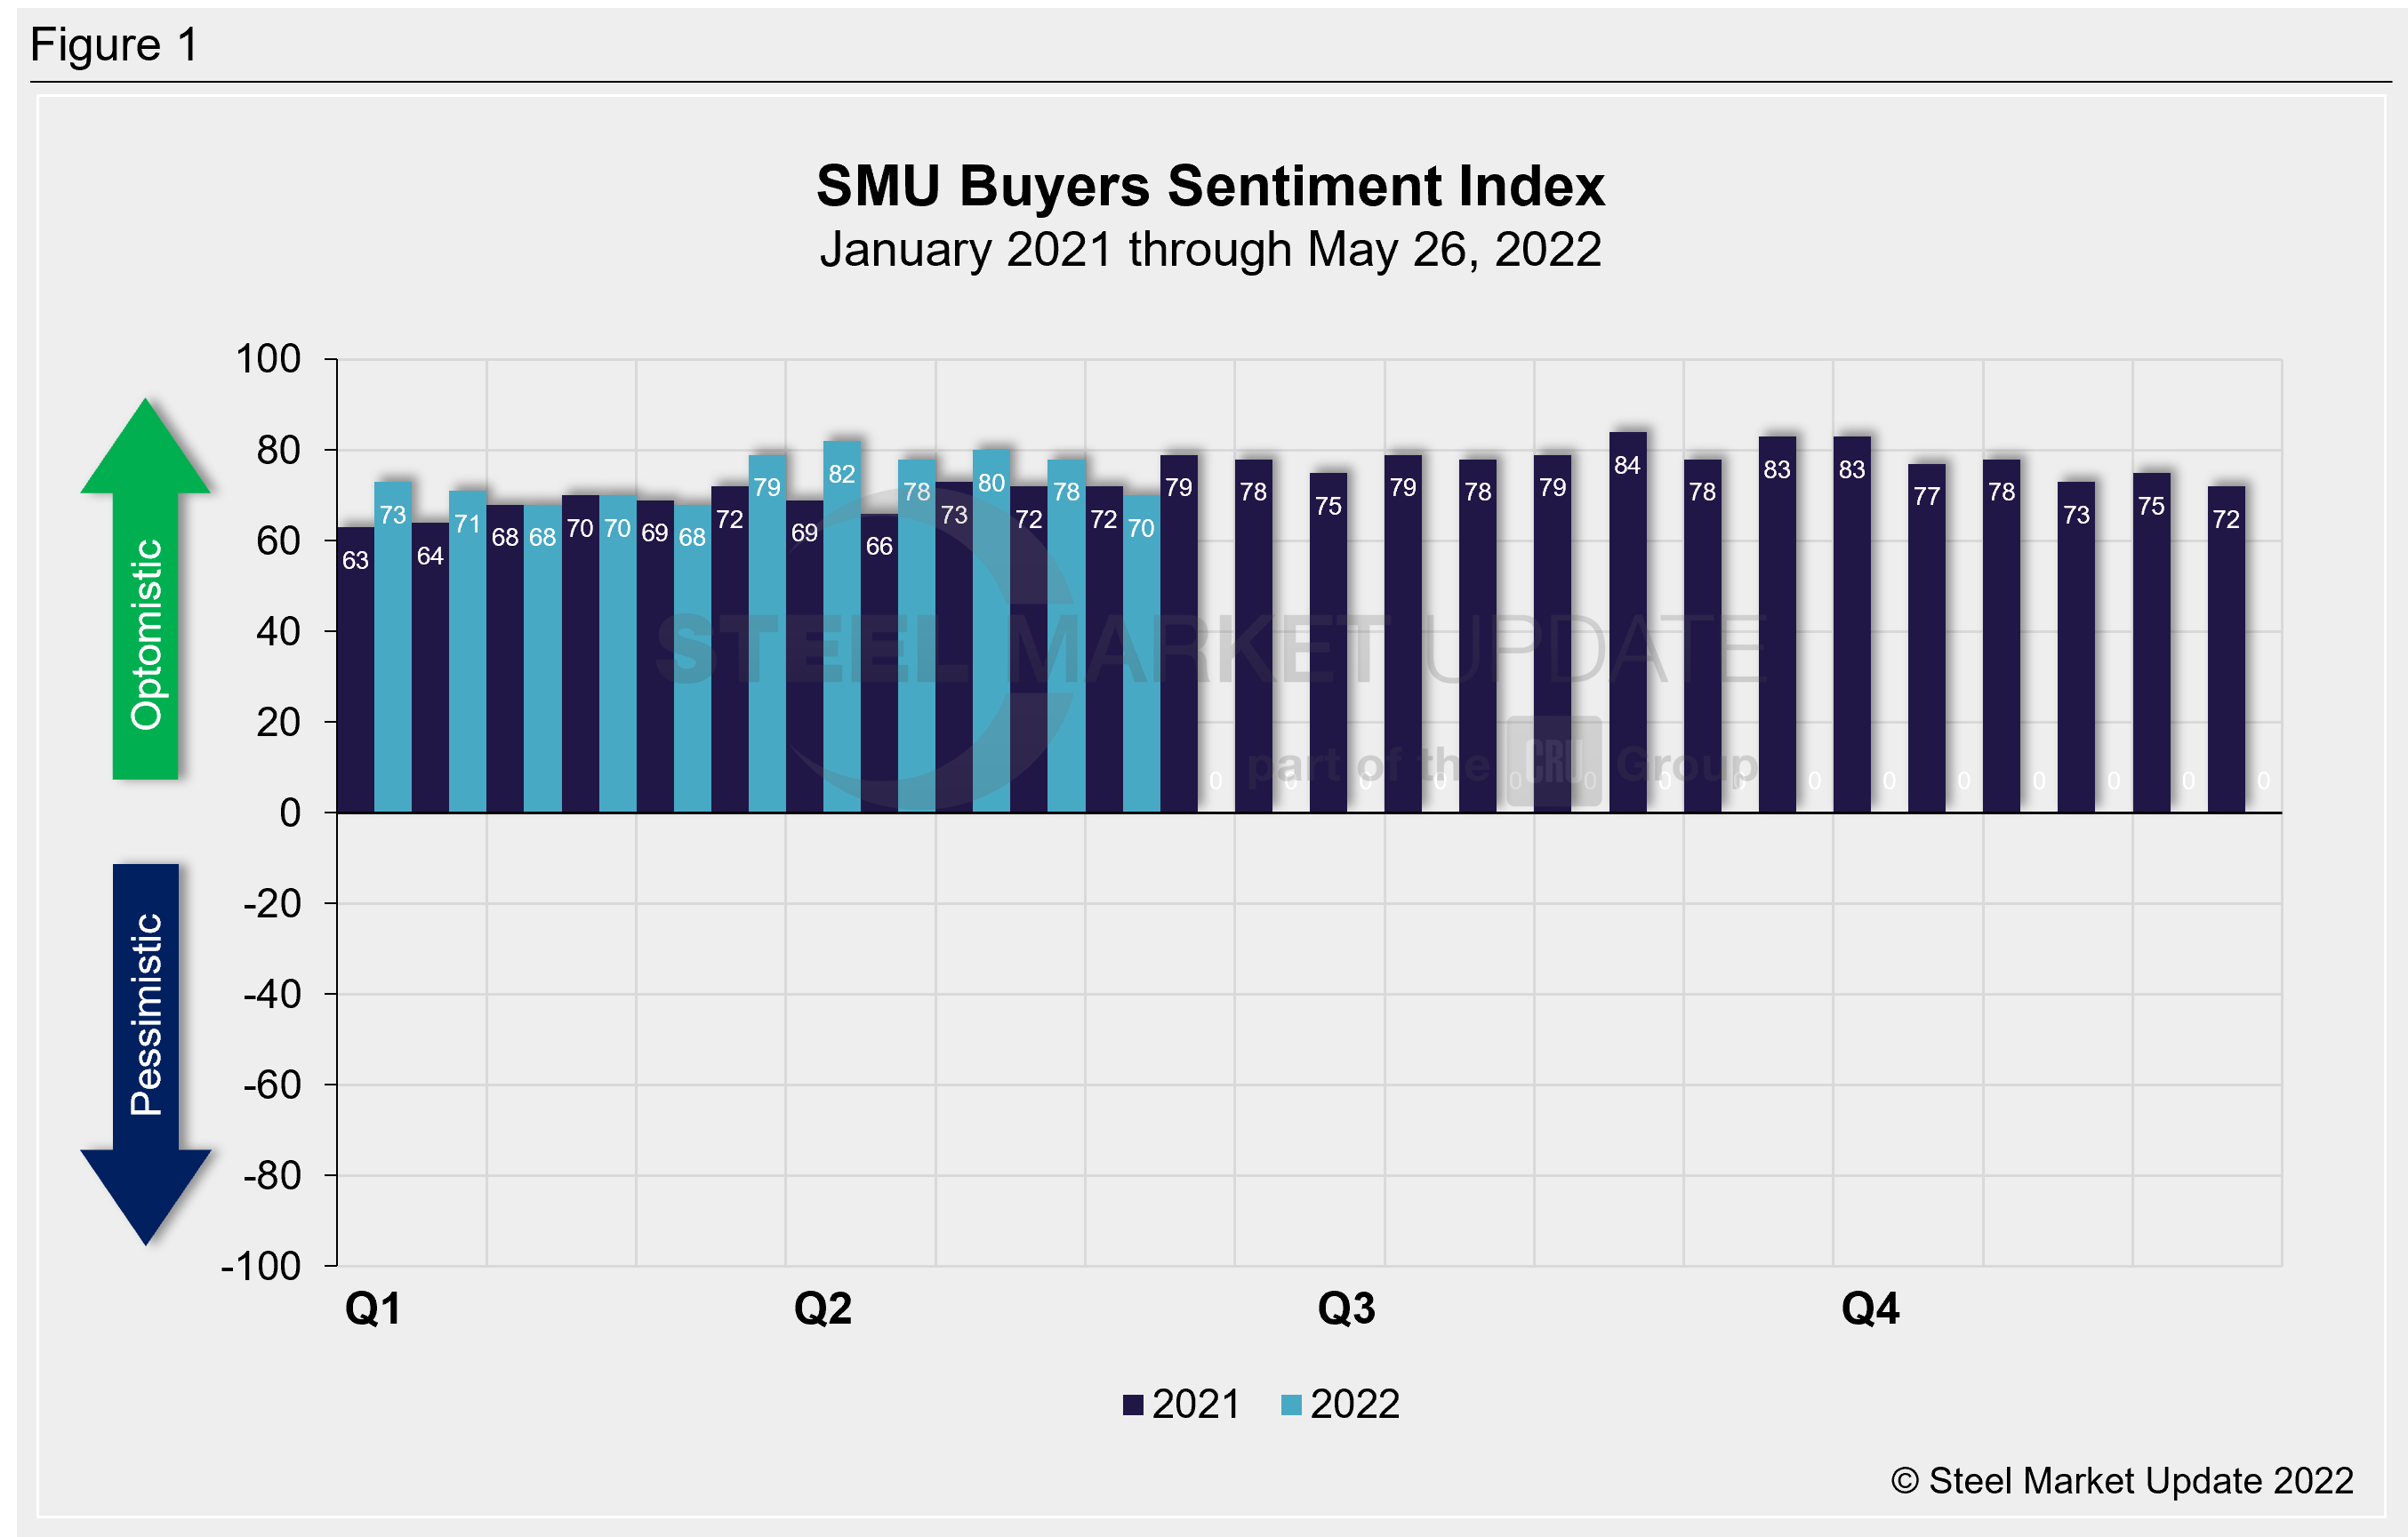
SMU surveys buyers every two weeks and asks how they view their chances of success in the near and longer term. SMU’s Current Sentiment Index registered +70 last week, now the lowest reading since early March.
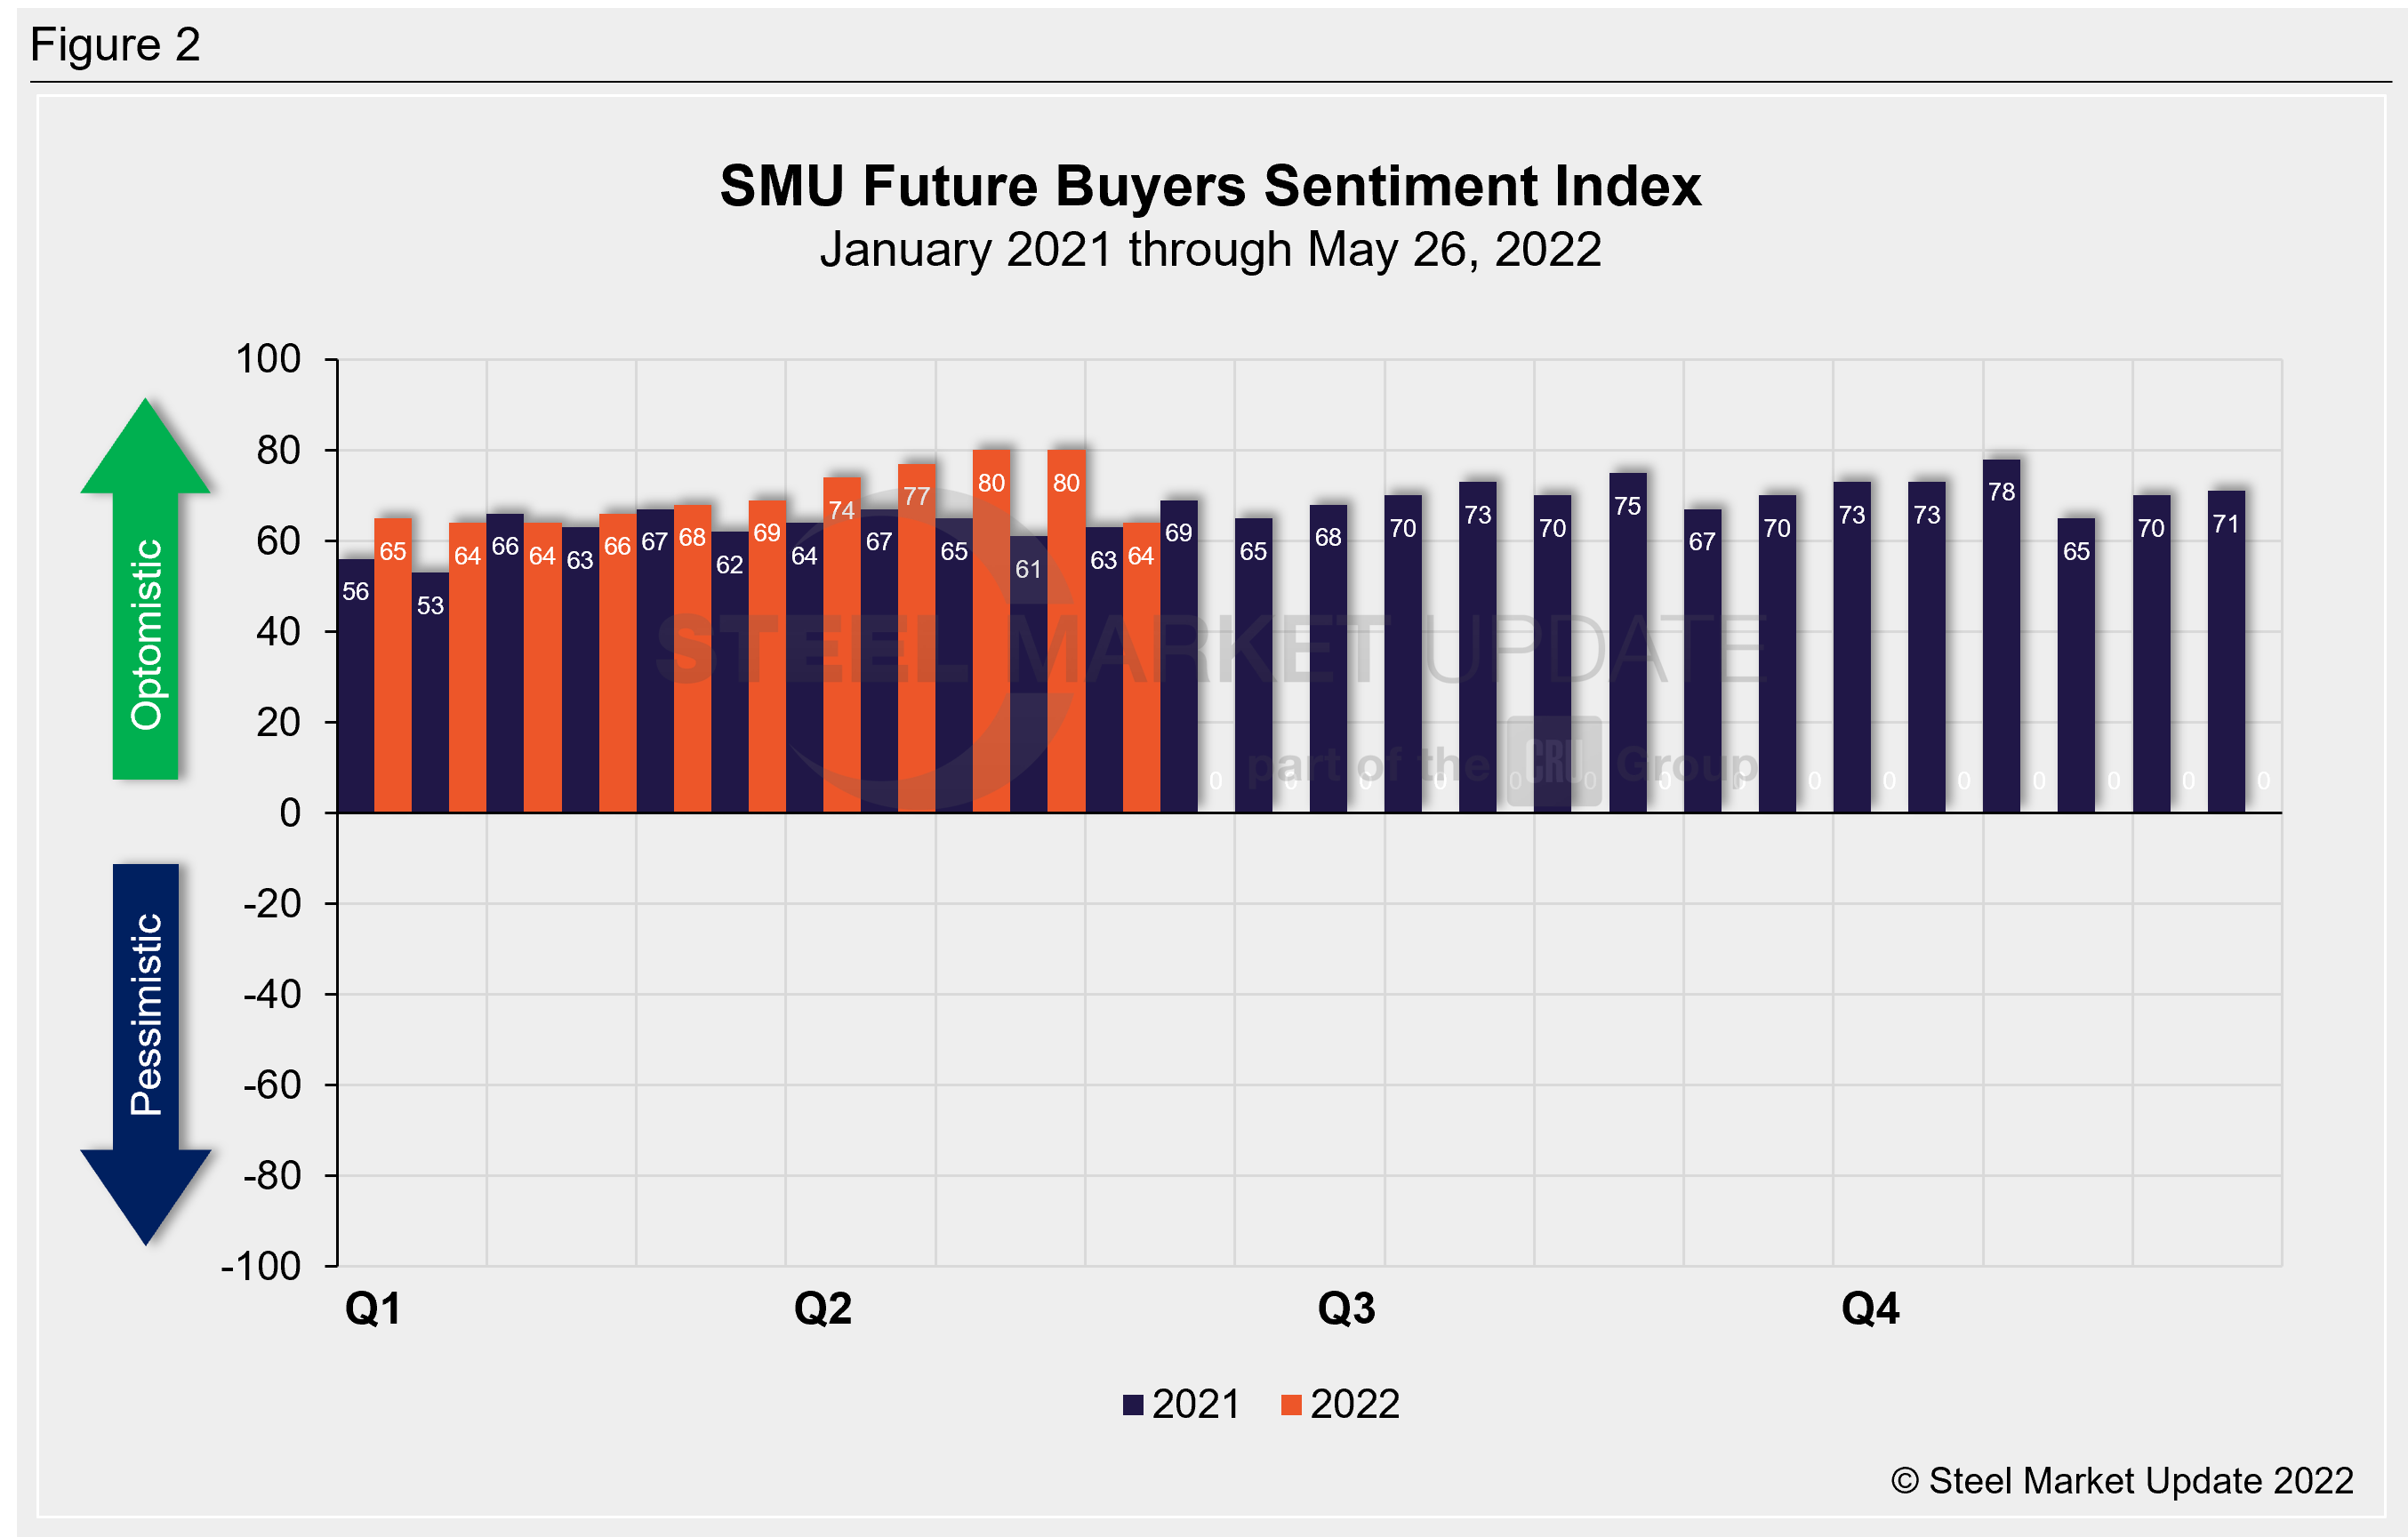
SMU’s Future Sentiment Index, which measures buyers’ feelings about their prospects three to six months in the future, decreased 16 points to +64, now in line with early-February levels. Recall that the previous two readings were the highest recorded in our 13.5-year history.
Recall that as steel prices had peaked last September, Current Sentiment reached an all-time high of +84, while Future Sentiment peaked two months later at +78. The lowest levels over the past decade both occurred in April 2020, at -8 and +10 respectively.
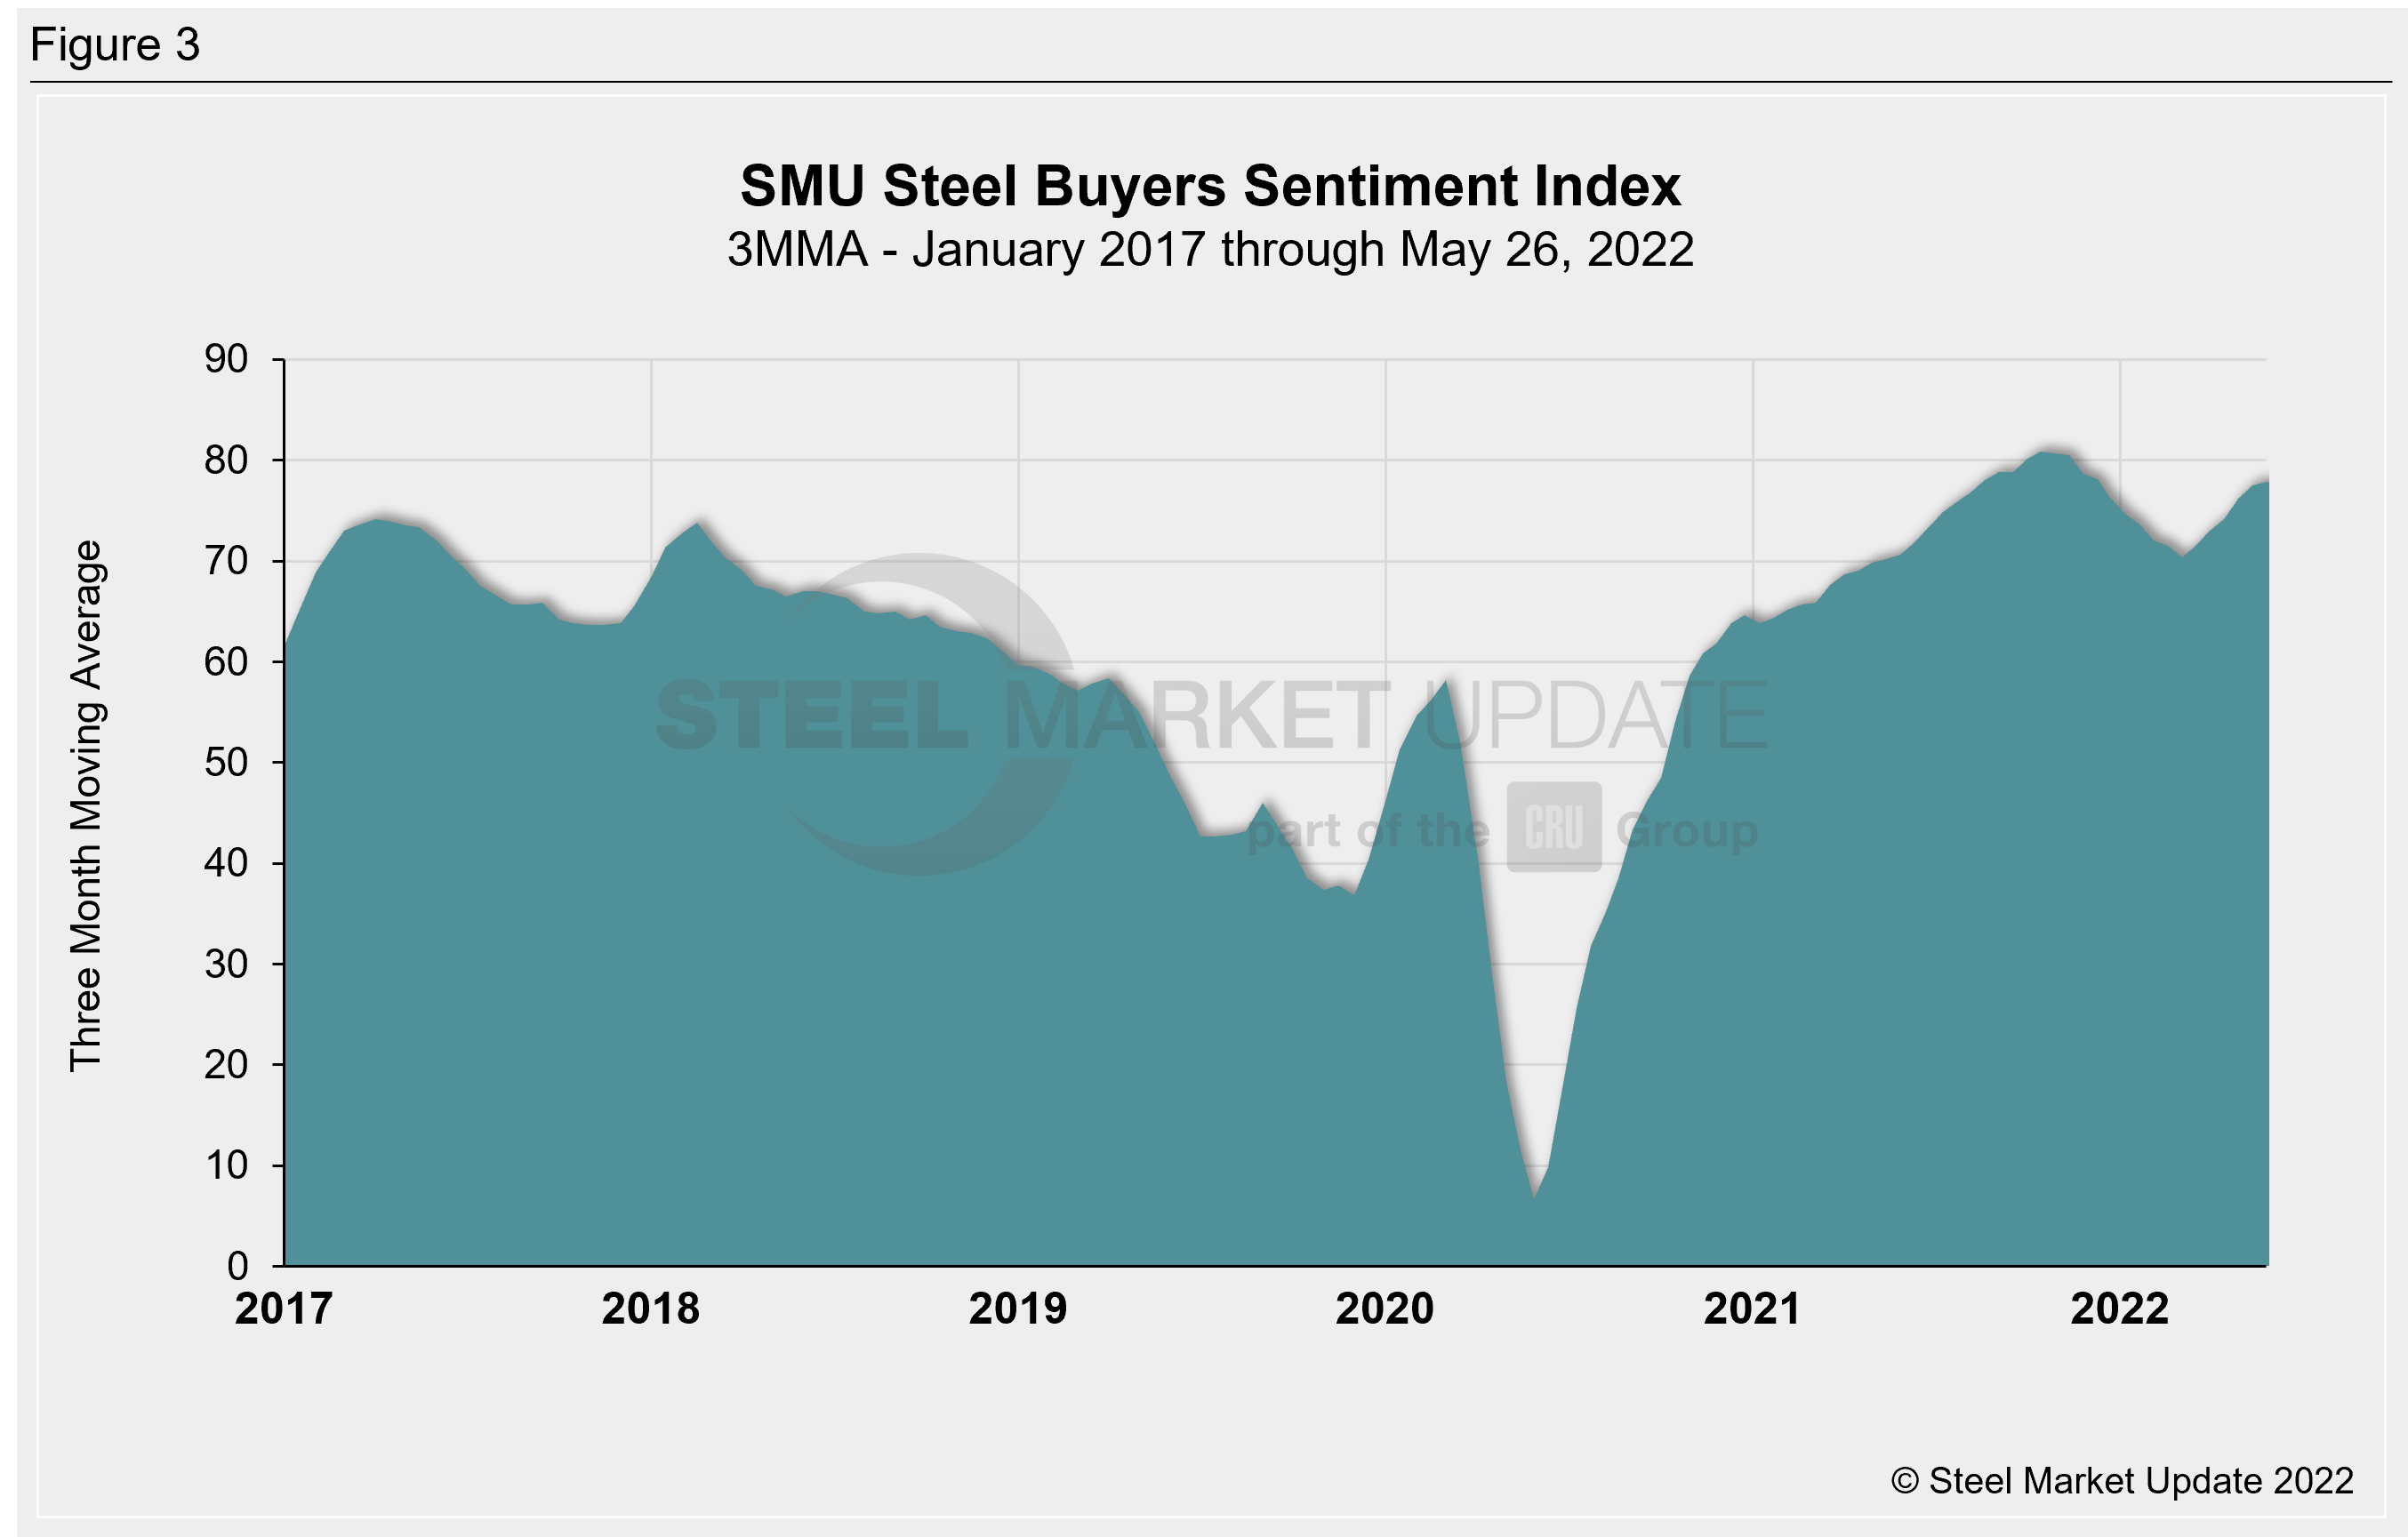
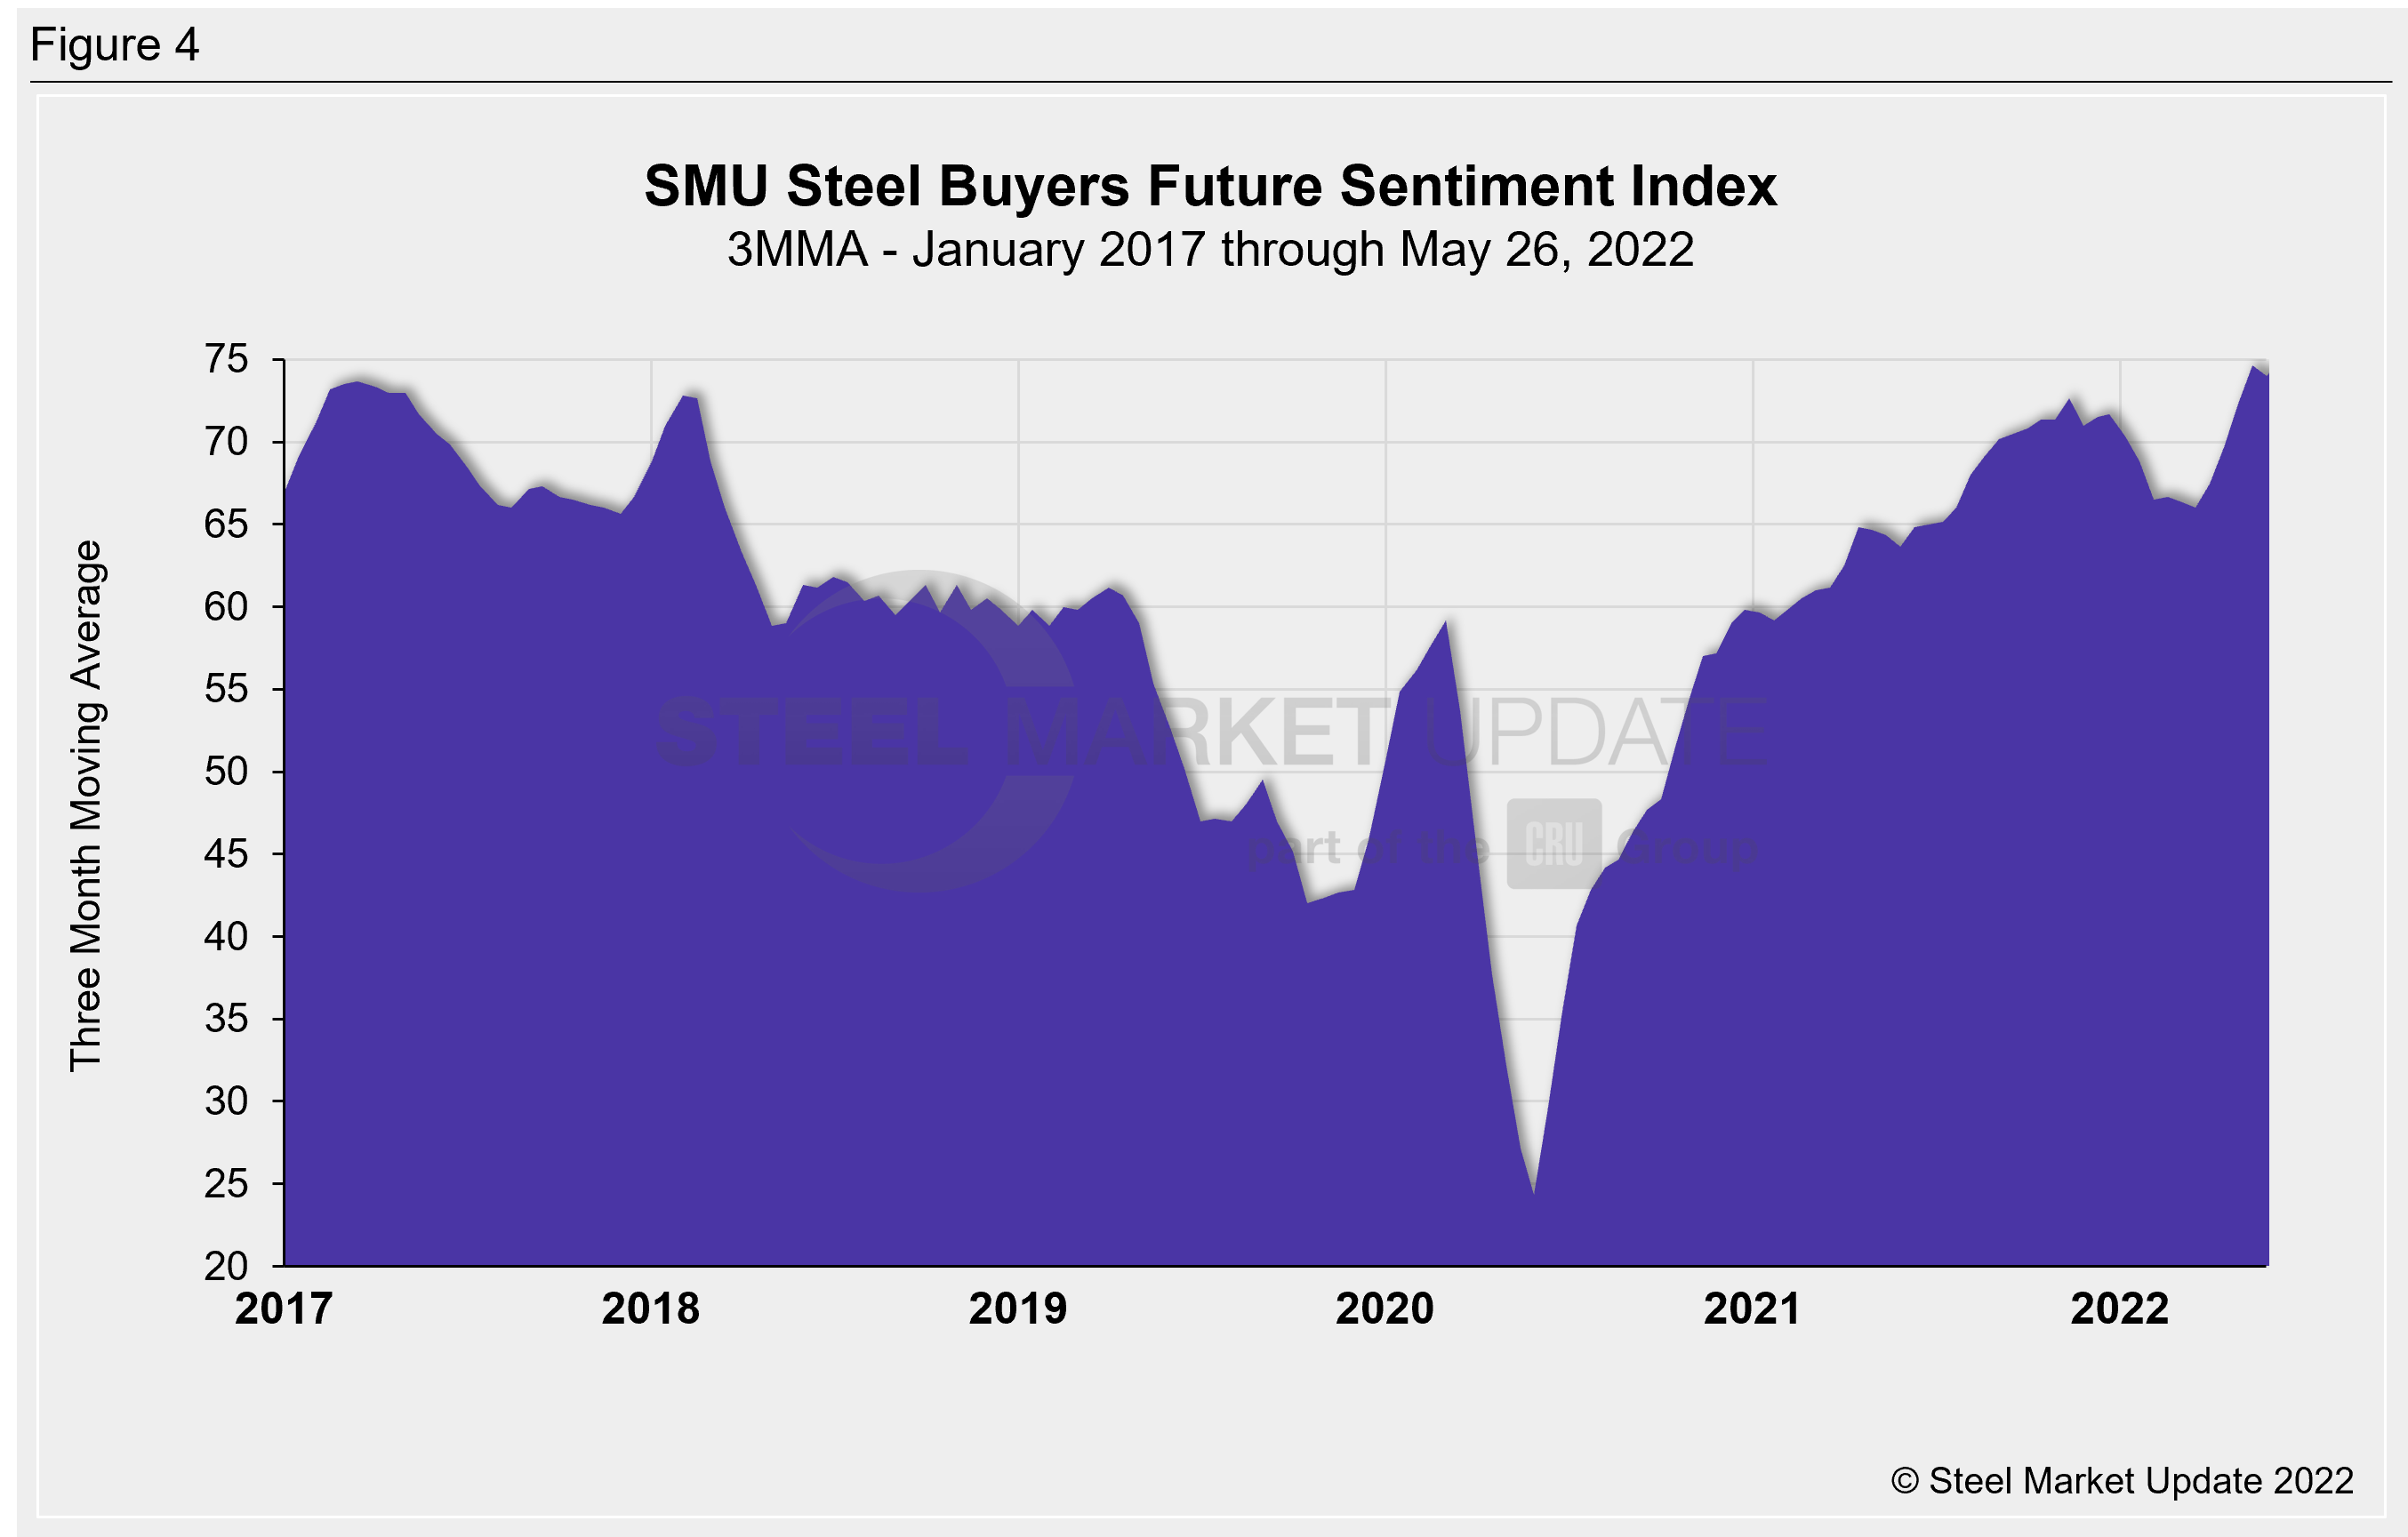
Measured as a three-month moving average, the Current Sentiment 3MMA has inched up to +77.83, and the Future Sentiment 3MMA declined to +74.00. The Current Sentiment 3MMA is now at the highest level seen since December 2021. Recall that the Future Sentiment 3MMA reached a record high of +74.67 in mid-May, surpassing the previous record of +73.67 in March 2017.
What SMU Survey Respondents Had to Say
“I think pricing will continue to erode, customers may see that trend and hold off on purchases.”
“Lots of uncertainty and concerns about Fed. aggressive raising interest rates and putting the economy into recession.”
“Too many unknown external factors to stay as positive six months from now versus today.”
“Worried about inflation, demand and amount of available inventory creating price wars.”
“Prices are dropping once again just as we are getting shipments of higher cost material we placed six weeks ago.”
“We are able to still deal with the downward price trends like we always do. Ride it up and ride it down.”
Tracking steel buyers’ sentiment is helpful in predicting their future behavior.
About the SMU Steel Buyers Sentiment Index
SMU Steel Buyers Sentiment Index is a measurement of the current attitude of buyers and sellers of flat-rolled steel products in North America regarding how they feel about their company’s opportunity for success in today’s market. It is a proprietary product developed by Steel Market Update for the North American steel industry.
Positive readings run from +10 to +100. A positive reading means the meter on the right-hand side of our home page will fall in the green area indicating optimistic sentiment. Negative readings run from -10 to -100. They result in the meter on our homepage trending into the red, indicating pessimistic sentiment. A reading of “0” (+/- 10) indicates a neutral sentiment (or slightly optimistic or pessimistic), which is most likely an indicator of a shift occurring in the marketplace. Sentiment is measured via Steel Market Update surveys that are conducted twice per month. We display the meter on our home page.
We send invitations to participate in our survey to more than 600 North American companies. Our normal response rate is 100-150 companies. Approximately 40 percent are manufacturers, 40 percent are service centers/distributors, and the remainder are steel mills, trading companies or toll processors involved in the steel business.
Click here to view an interactive graphic of the SMU Steel Buyers Sentiment Index or the SMU Future Steel Buyers Sentiment Index.
By Brett Linton, Brett@SteelMarketUpdate.com


