

Market Data

September 1, 2022
SMU Steel Buyers Sentiment Index Remains Optimistic
Written by Brett Linton
Steel Market Update’s (SMU) Steel Buyers Sentiment Index inched up through the end of August data, while our Future Steel Buyers Sentiment Index slightly declined.
The latest Sentiment Index is in line with our two previous readings over the last month. Future Sentiment is now at the fourth lowest level of the year, just behind the late June and July readings. Comments from buyers remain overall optimistic, yet cautious as recession fears and weakening demand worries linger.
SMU polls hundreds of steel buyers every other week, asking how they view their chances of success in the current market, as well as a few months down the road.
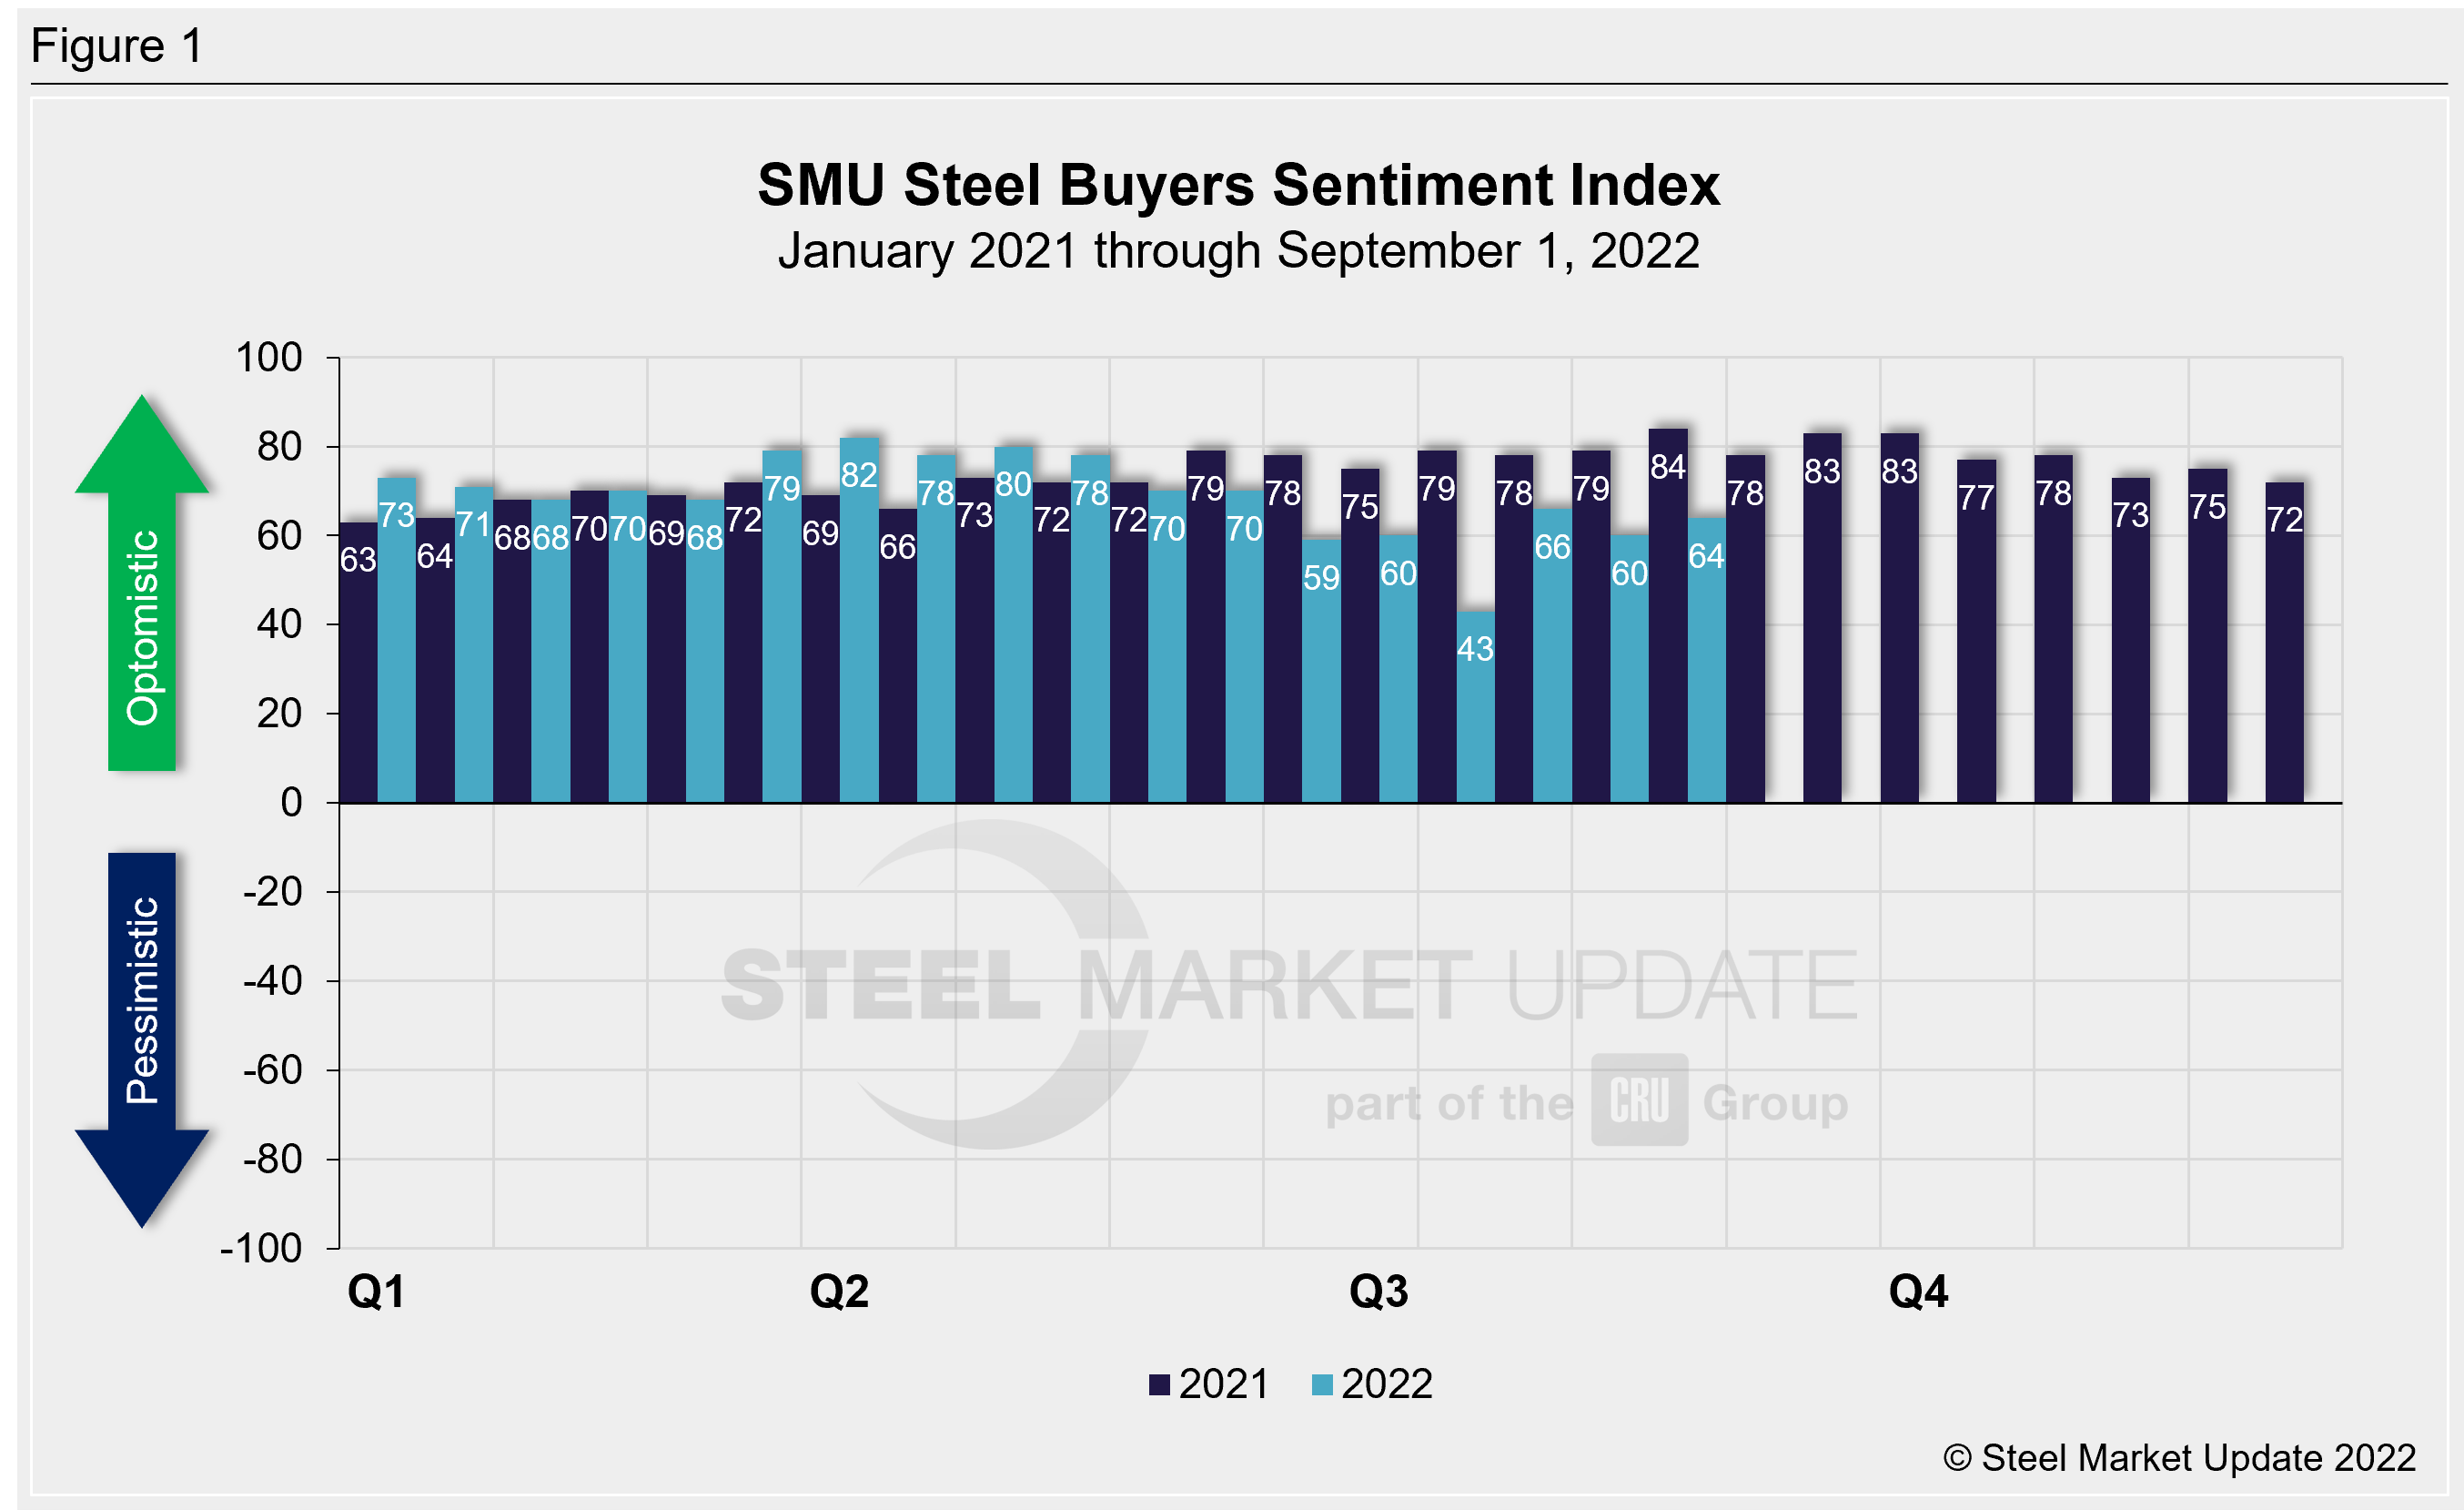
SMU’s Buyers Sentiment Index registered +64 this week, up four points from our previous market check, but down two points from one month ago (Figure 1). Recall that Buyers Sentiment dipped by 17 points to +43 in mid-July, the lowest level seen since August 2020, then quickly rebounded in early August. Our Buyers Sentiment Index peaked at +82 in March of this year.
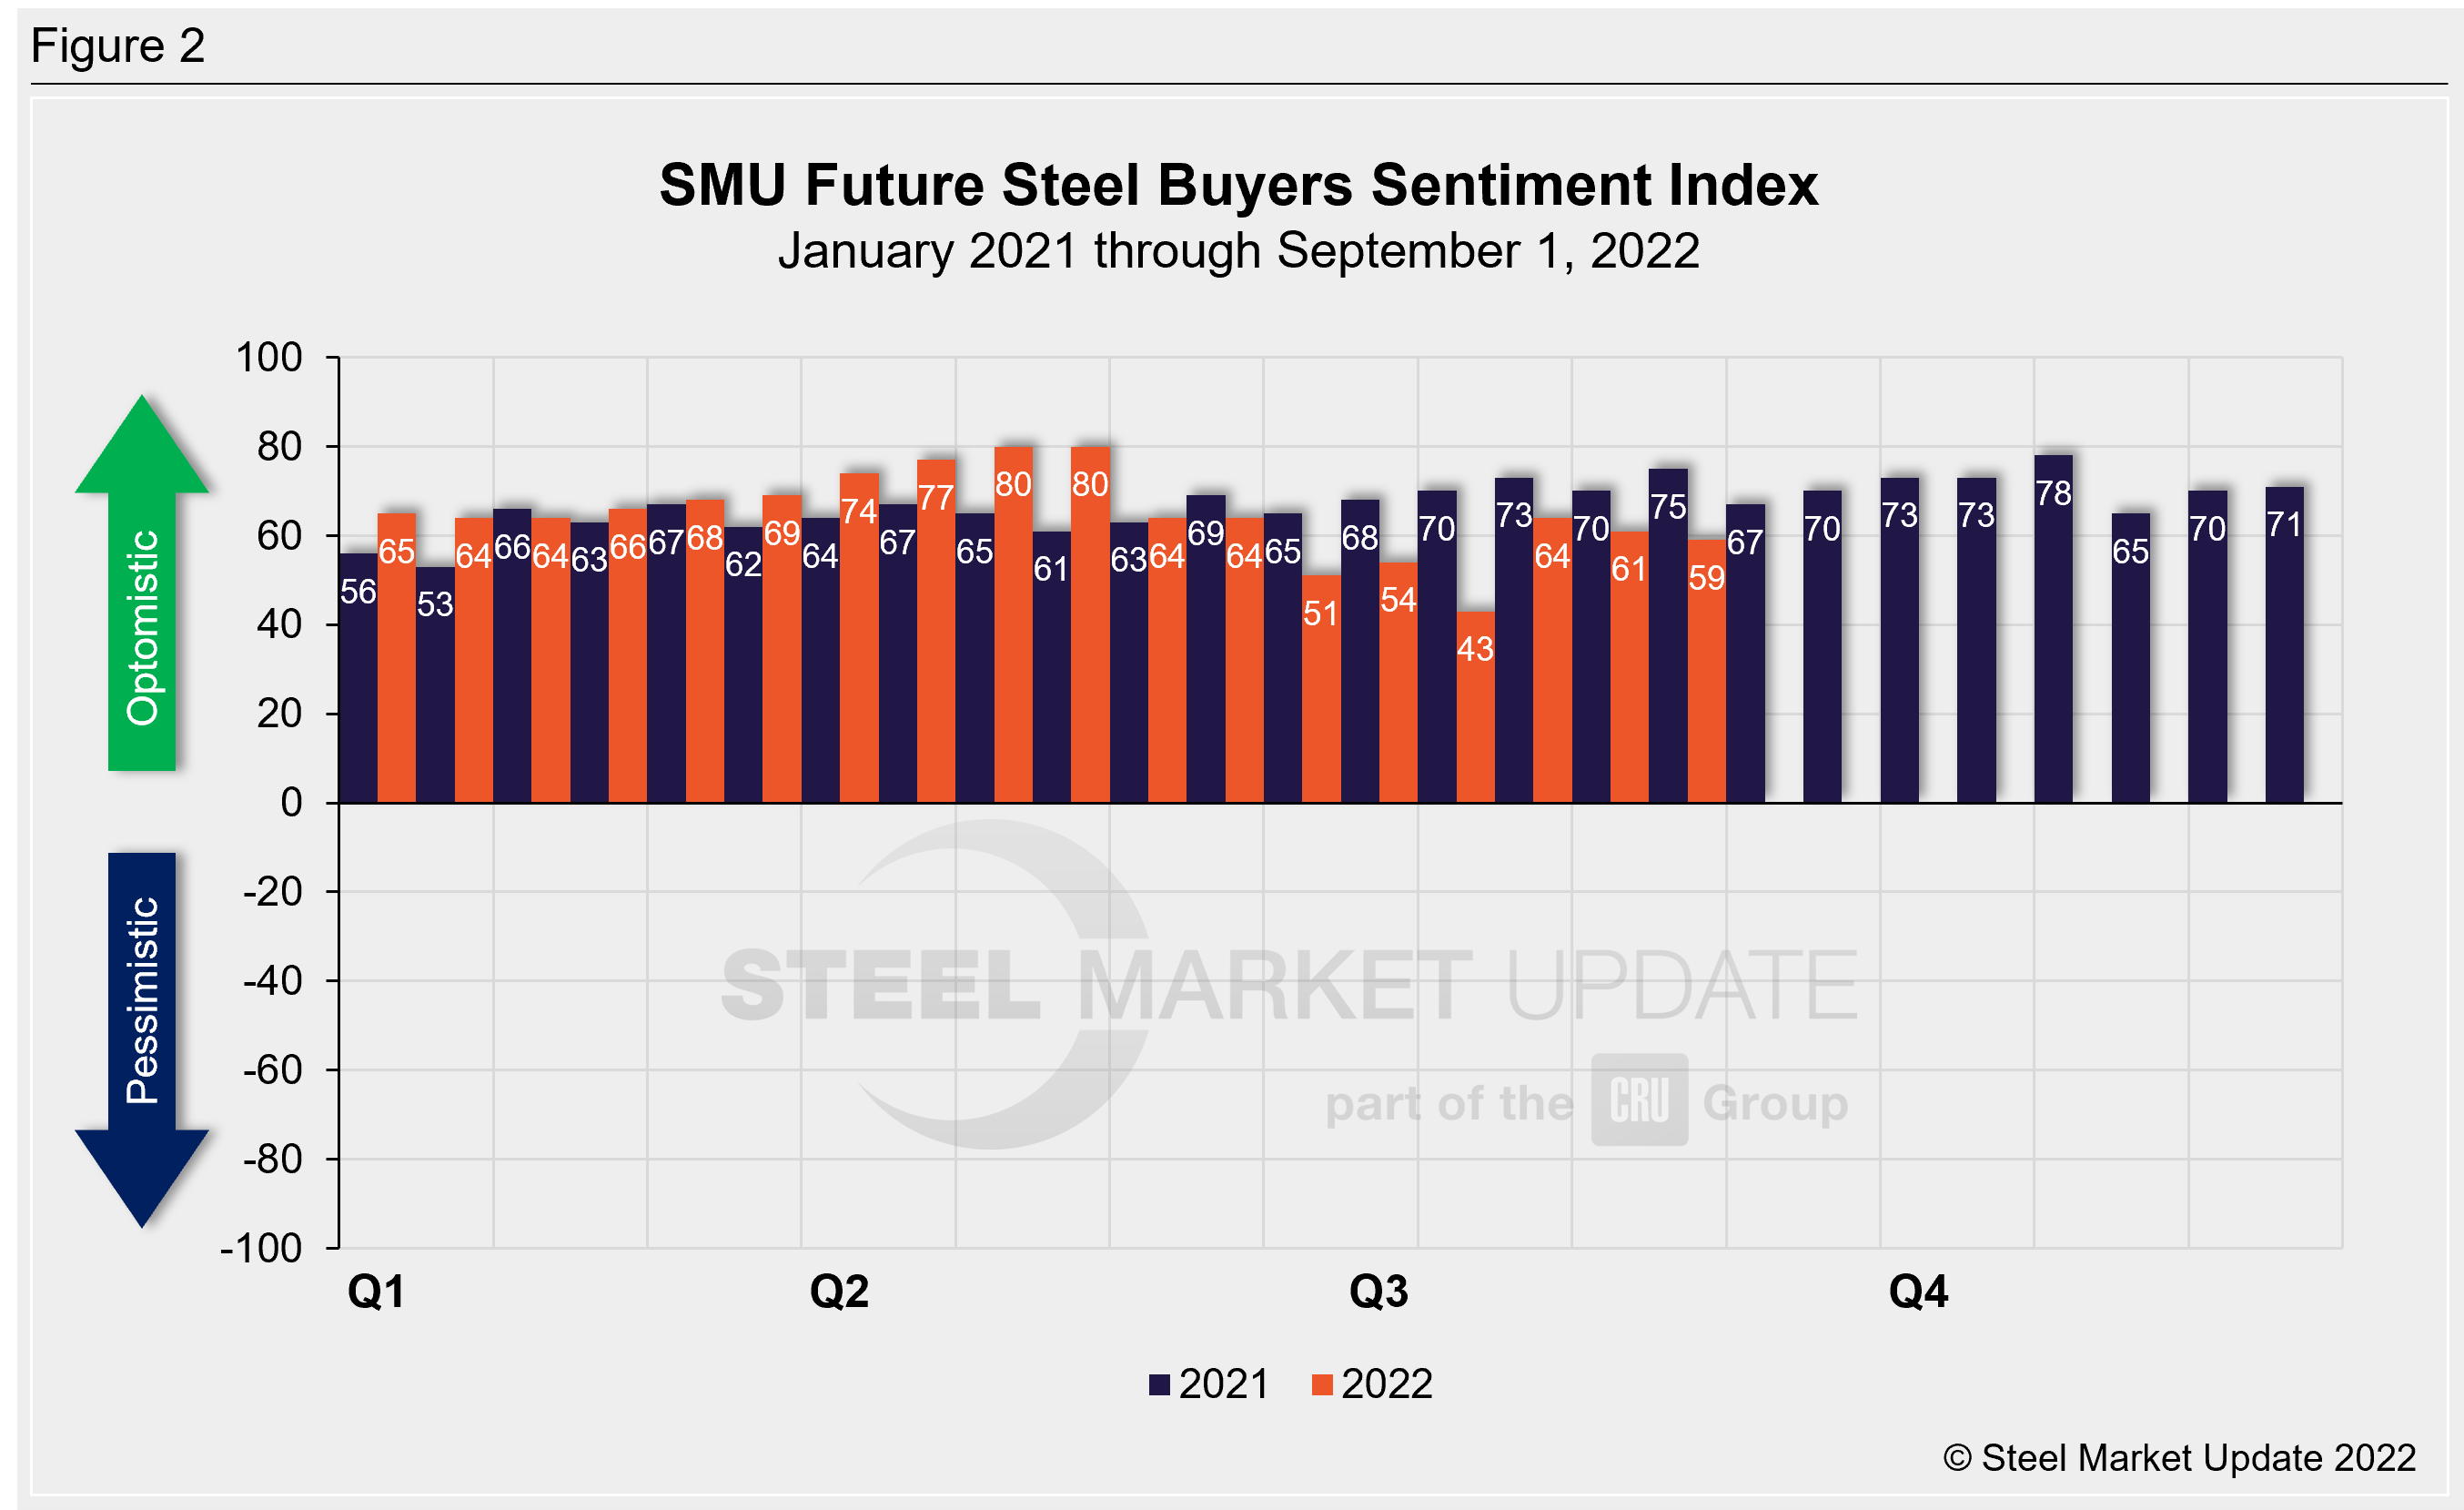
SMU’s Future Buyers Sentiment Index, which measures buyers’ feelings about business conditions three to six months in the future, declined two points from our previous survey. Future Buyers Sentiment now stands at +59, down five points from levels one month prior (Figure 2). In mid-July, our Future Sentiment Index had fallen to near a two-year low at +43, bouncing back in early August. Earlier this year we saw the highest Future Sentiment readings recorded in our 13.5-year history: late April and early May both registered +80.
Recall that as steel prices peaked last September, Current Sentiment reached an all-time high of +84, while Future Sentiment peaked two months later at +78. The lowest levels over the past decade both occurred in April 2020, at -8 and +10 respectively.
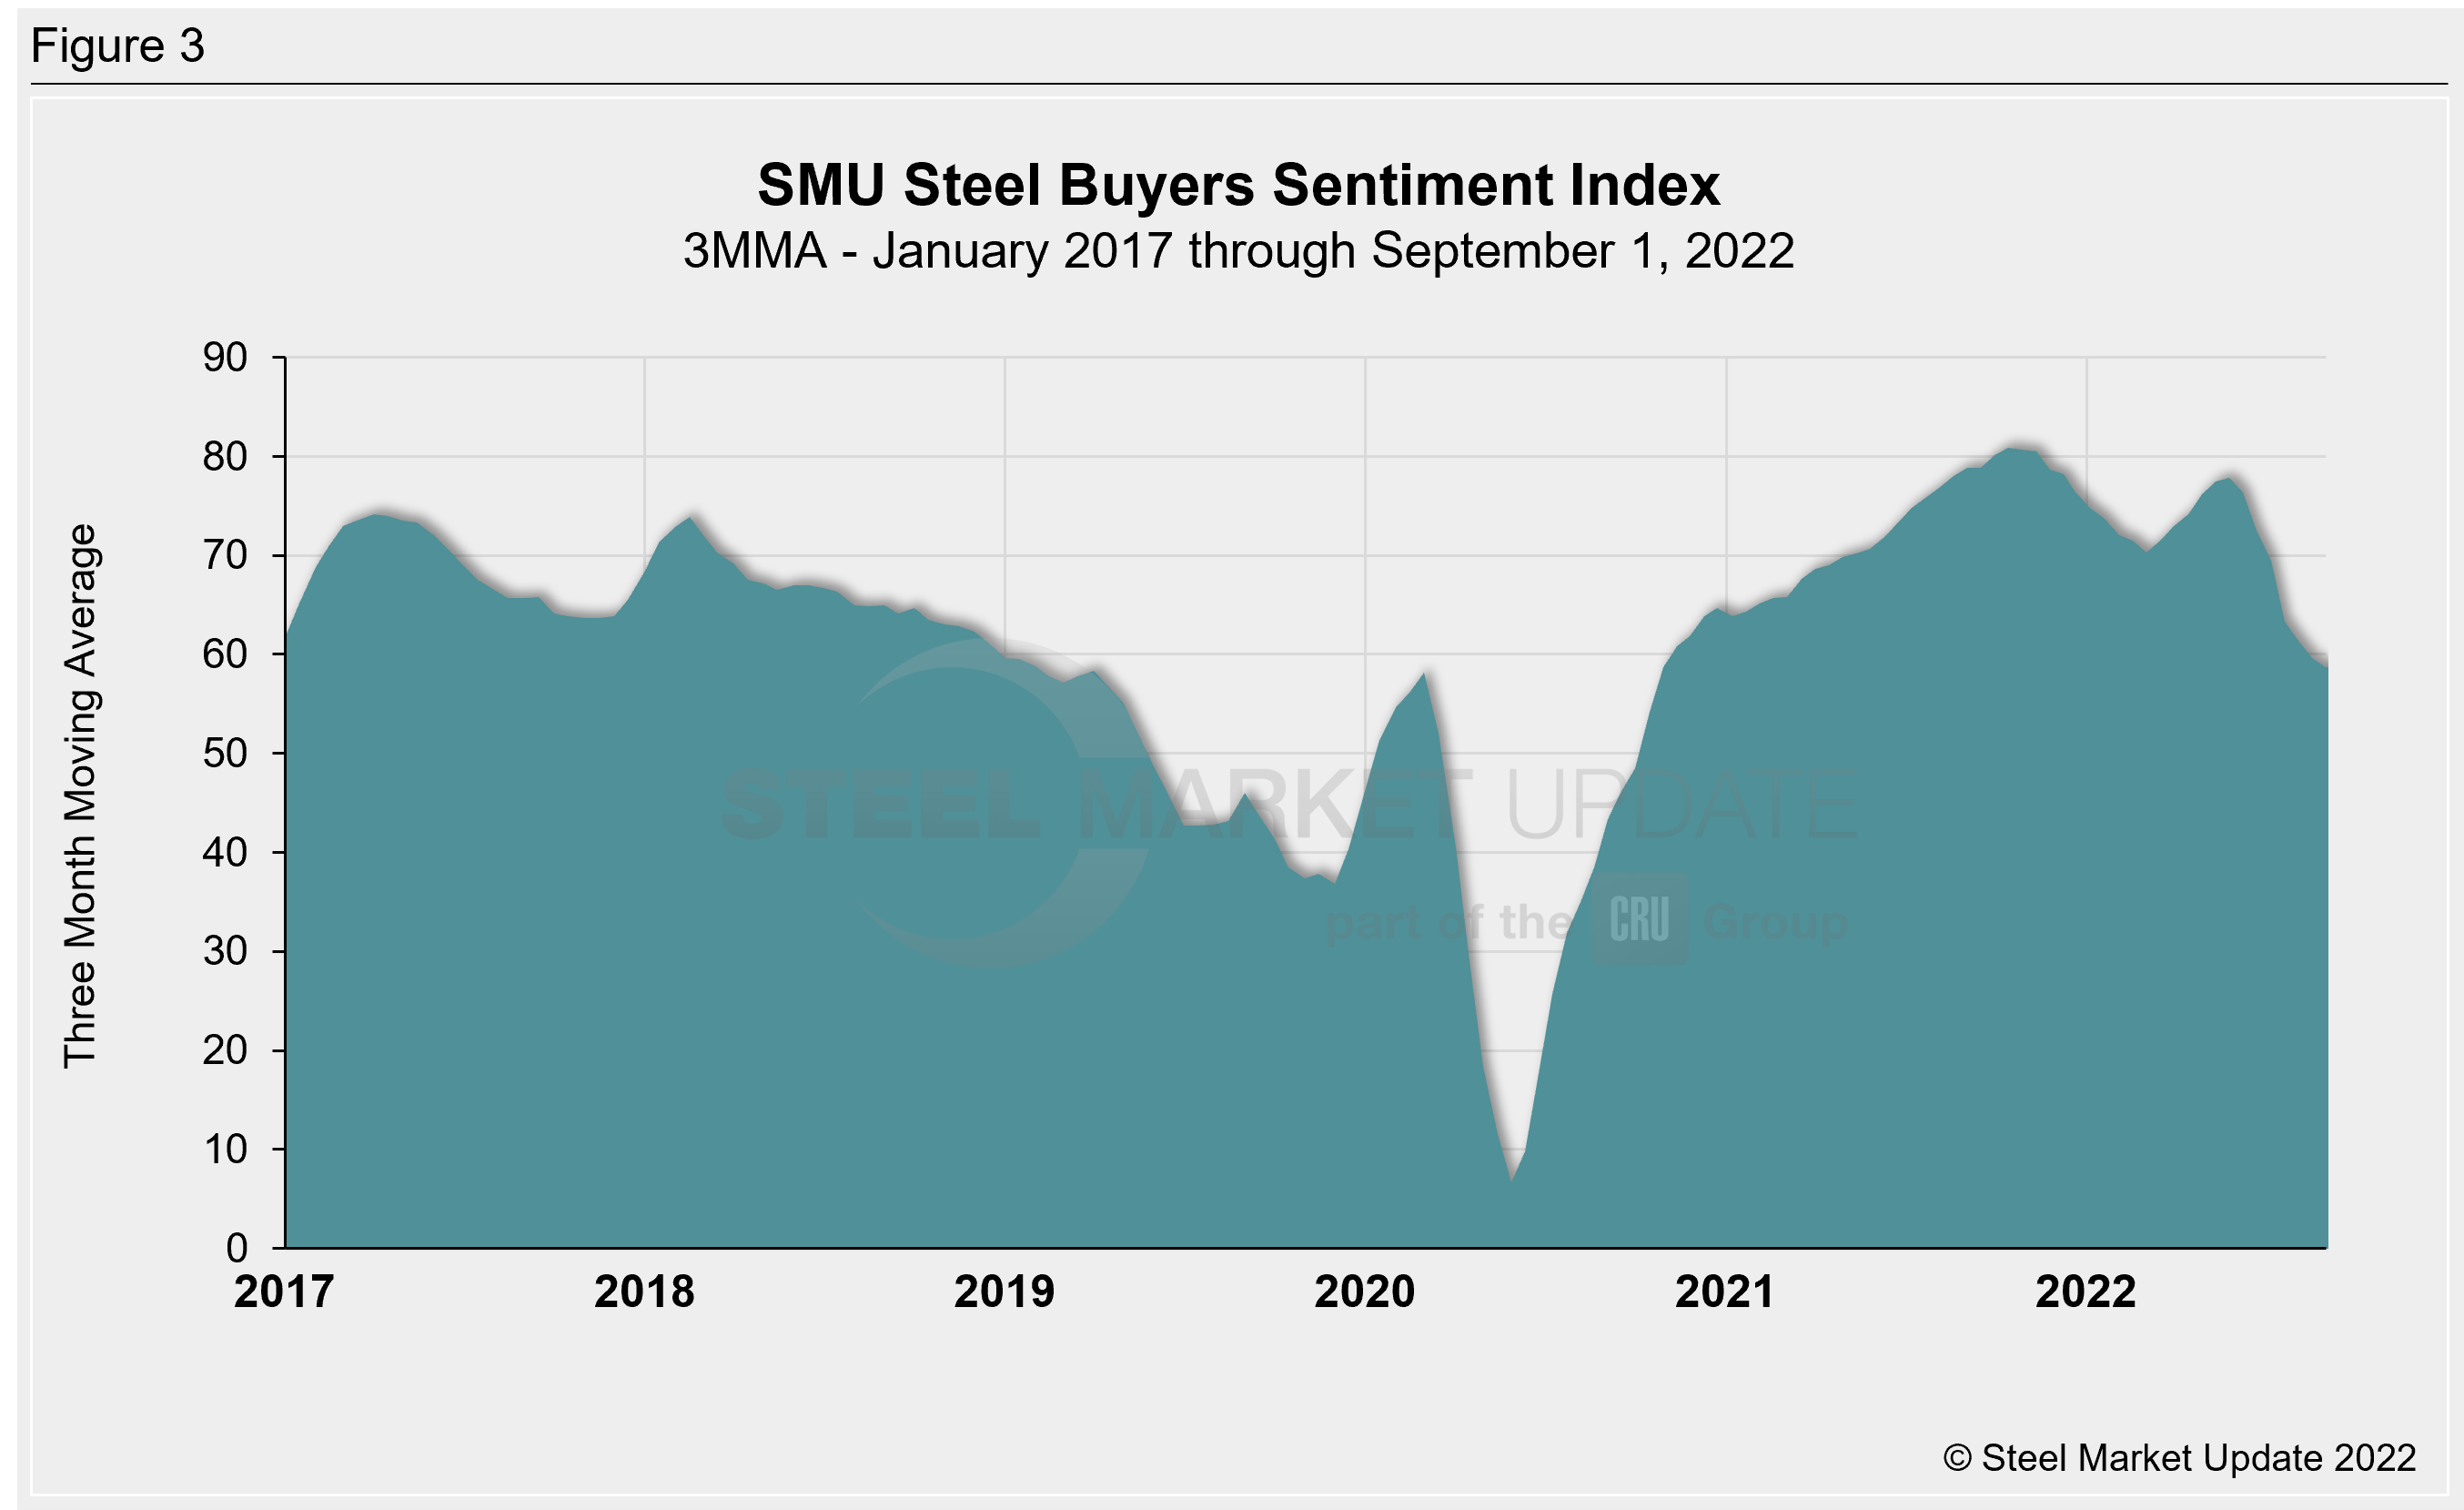
Measured as a three-month moving average, the Current Sentiment 3MMA decreased one point to +58.67 last week, a three-point decline compared to one month earlier (Figure 3). This reading is now the lowest recorded number since October 2020, when it was at this same level. Three months ago, the Current Sentiment 3MMA peaked at +77.83, the highest level since December 2021.
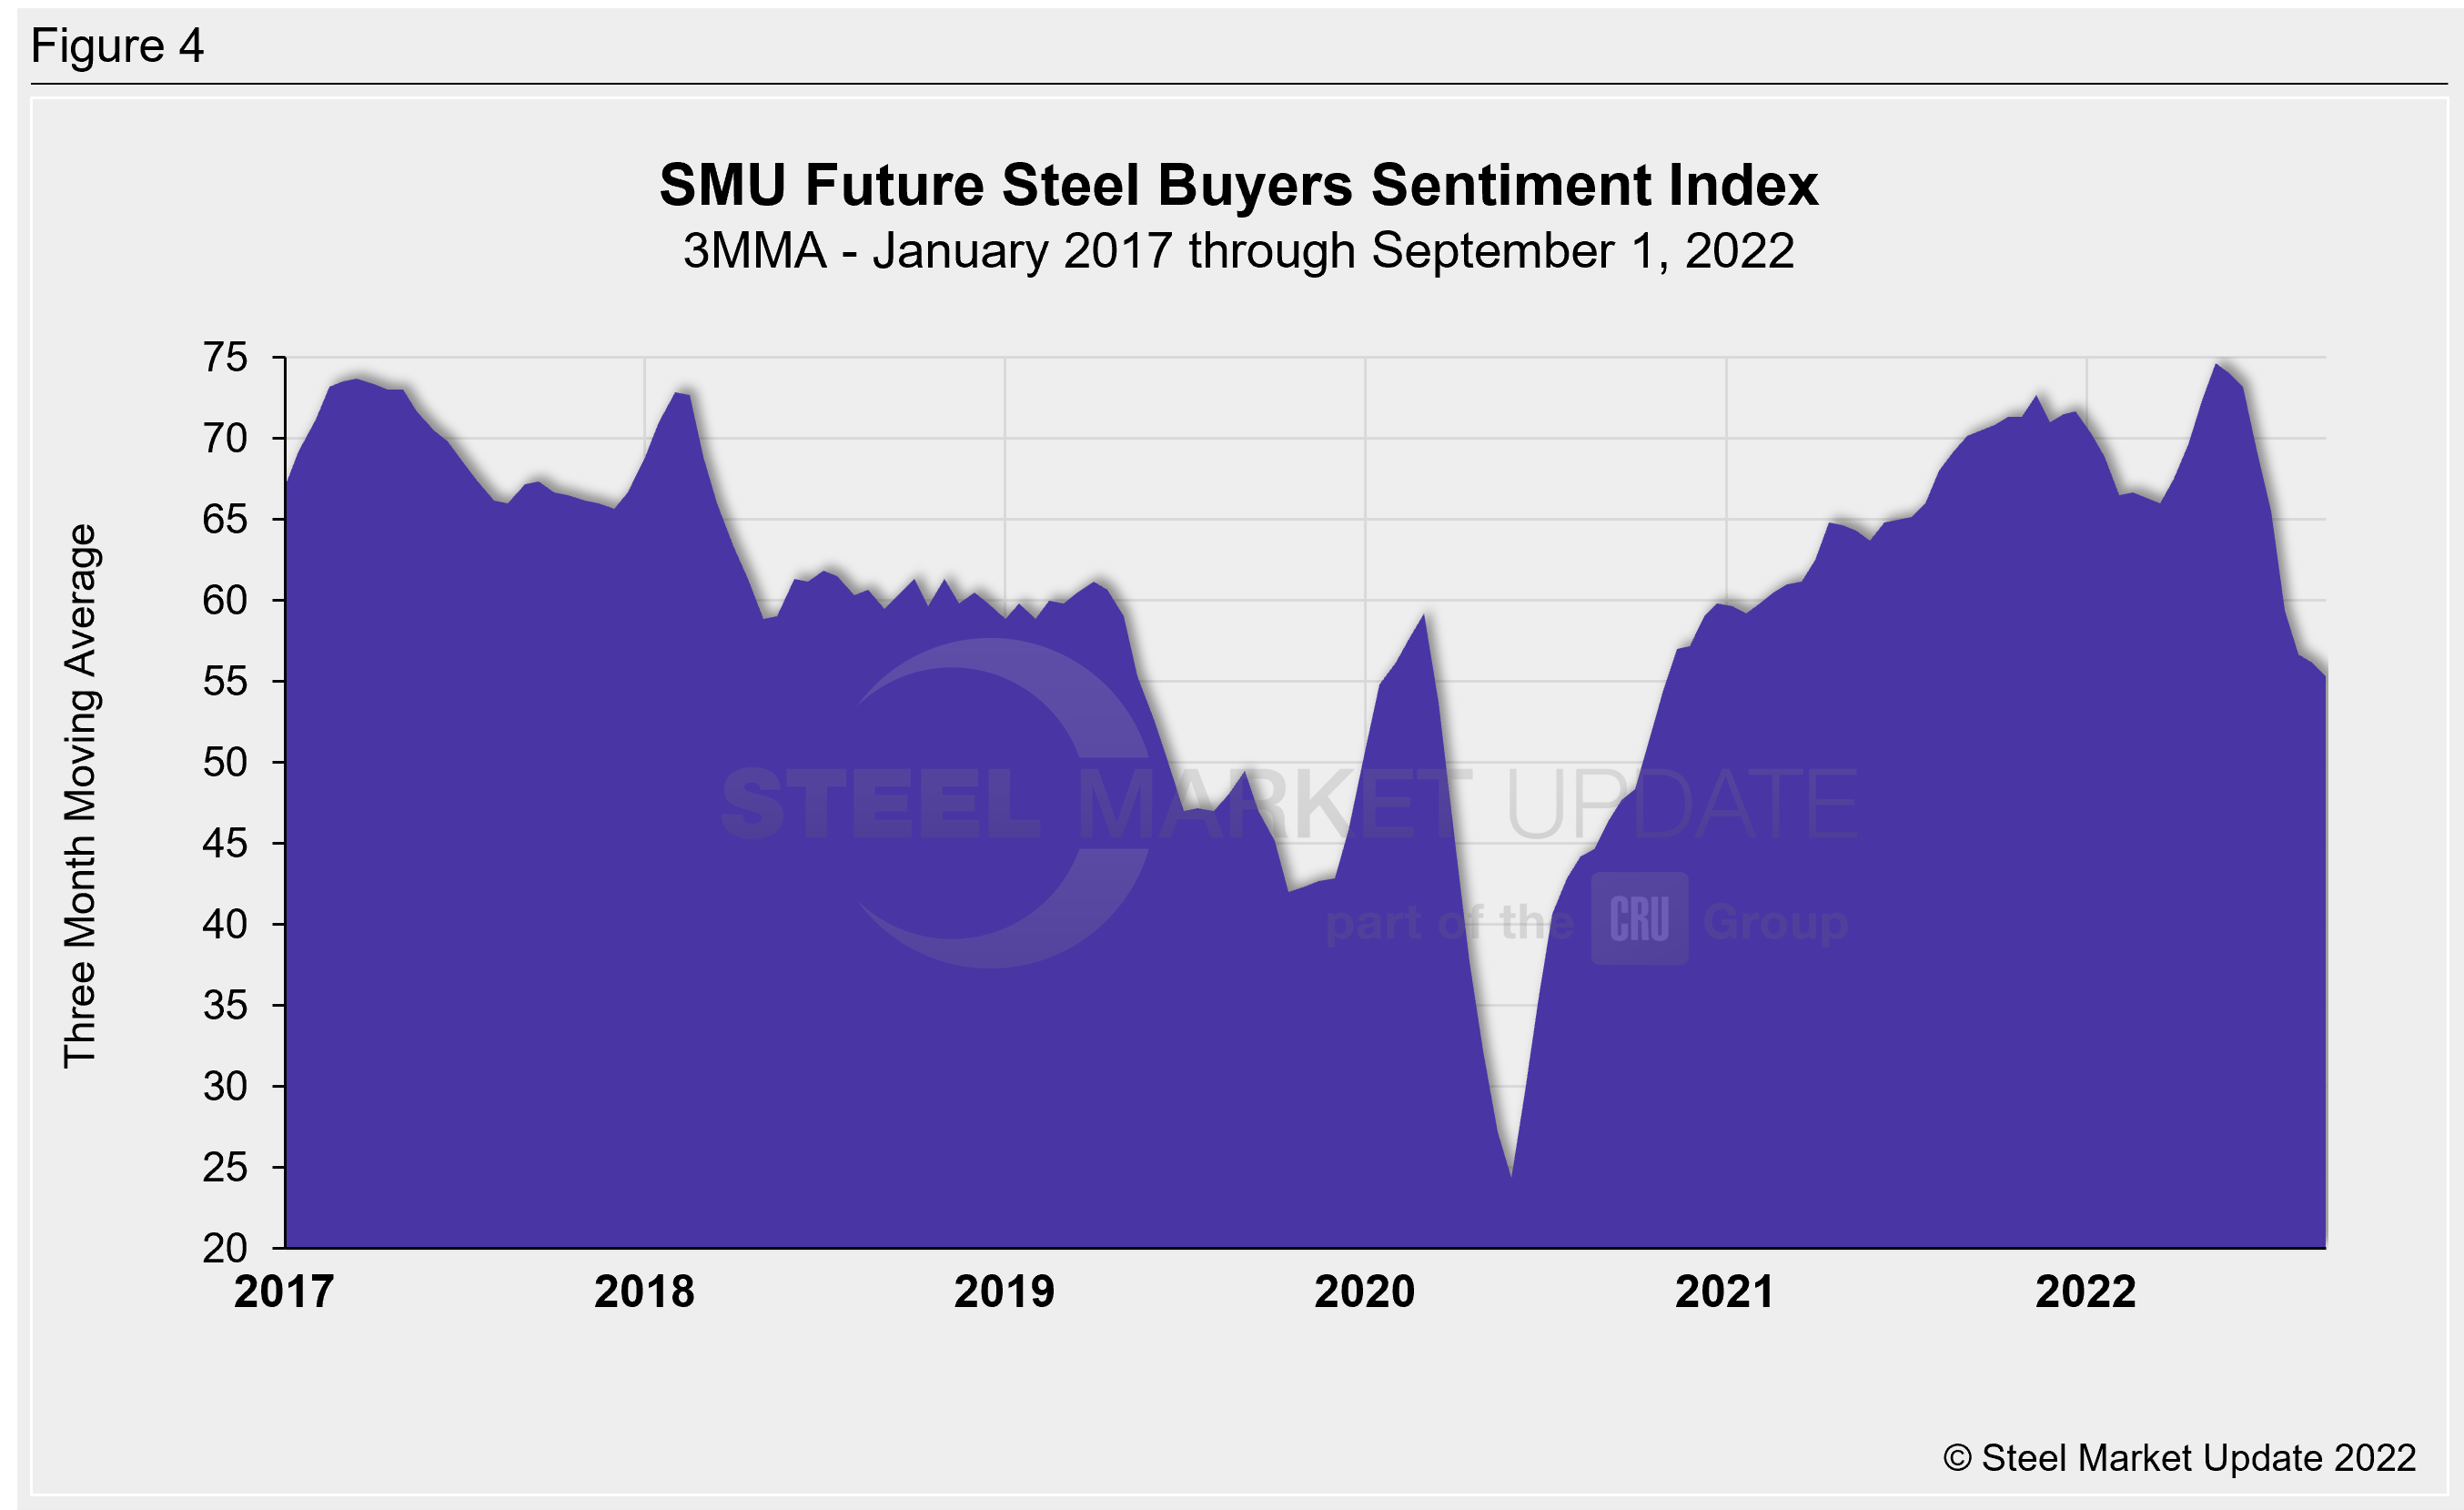
The Future Sentiment 3MMA declined less than one point this week to +55.33, down nearly 1.5 points from one month prior (Figure 4). This is also the lowest reading seen since October 2020 when it was +54.50. Three months ago, the Future Sentiment 3MMA reached a record high of +74.67, surpassing the previous record of +73.67 set in March 2017.
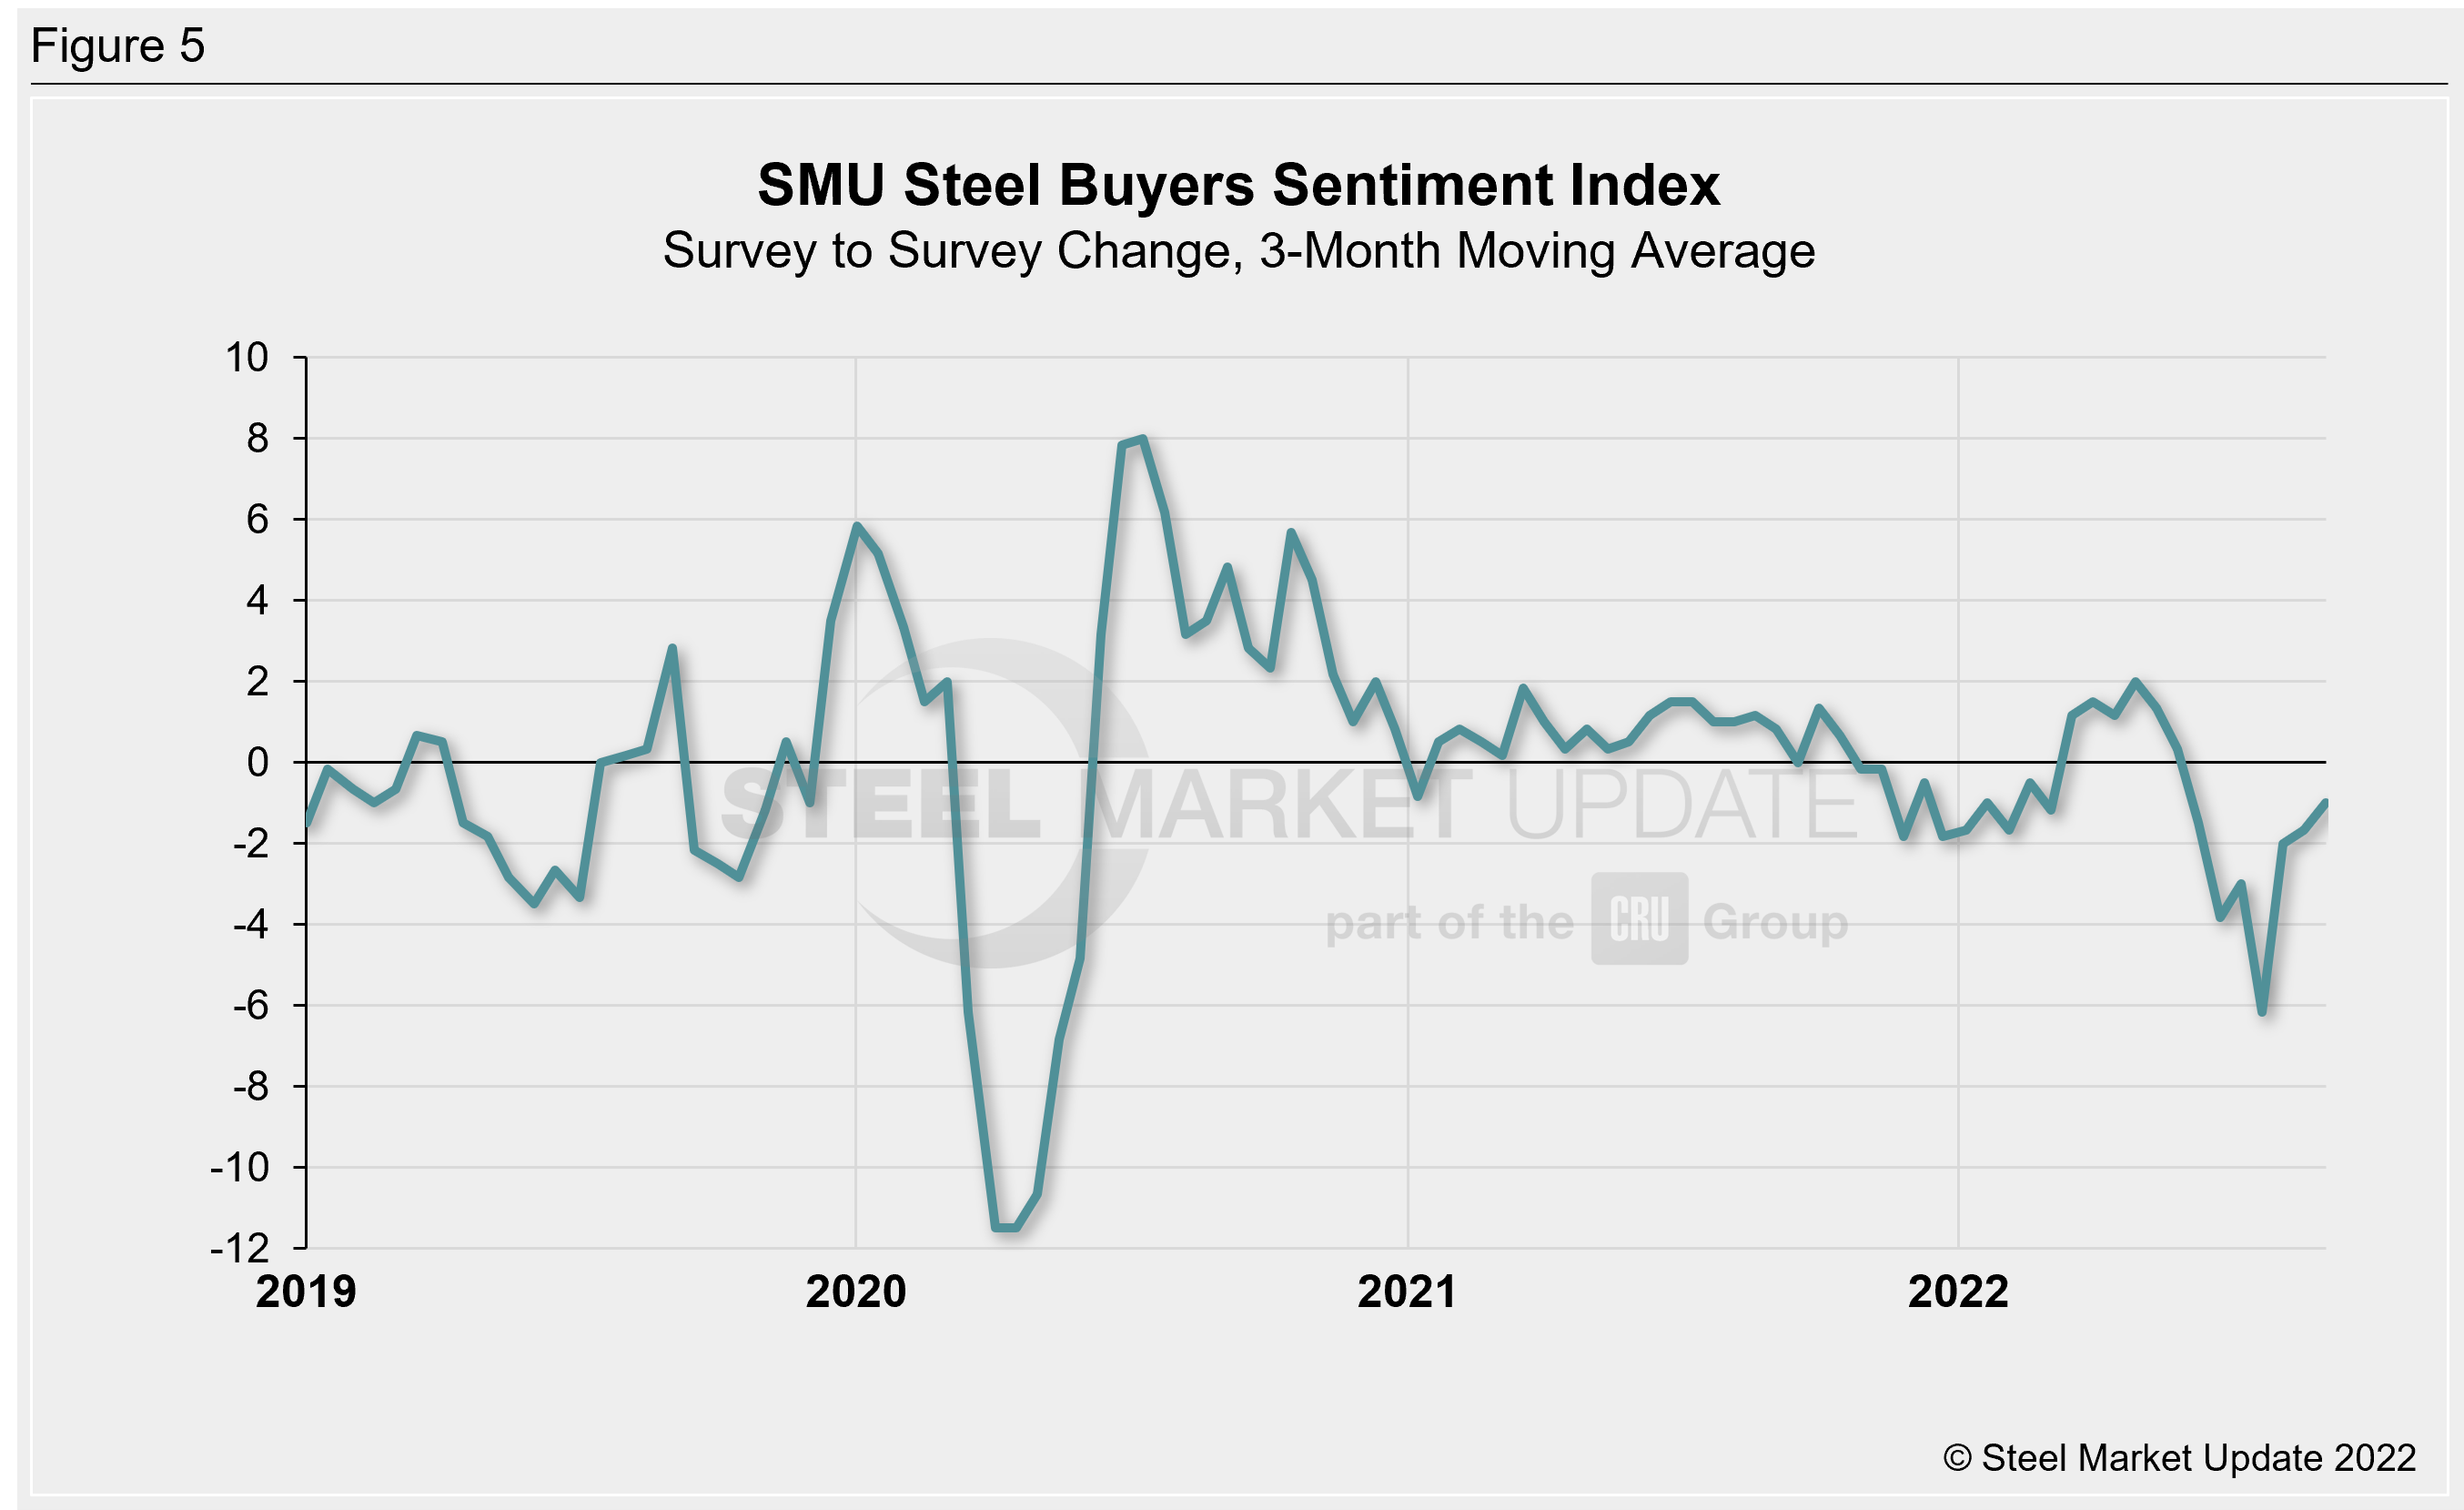
One helpful way to measure changes in Sentiment is to graph the survey-to-survey change in the Current Sentiment Index to measure the severity of Sentiment movements (Figure 5). On a 3MMA basis, the survey-to-survey change through last week is down one point compared to mid August. Six weeks ago, we saw a six-point decline, which was the largest change seen since April 2020. Between November 2020 and June 2022, the survey-to-survey change in our 3MMA Sentiment readings was steady, never exceeding two points. In late June of this year, it began to exceed that range and did so through July.
What SMU Survey Respondents Had to Say
“Demand is better than people suggest.”
“Very tough conditions when the spot resale market continues to fall and our on-hand costs remain elevated. Ouchie.”
“Inventories for the most part should now be in-line so it’s time to buy albeit cautiously.”
“Prices are weak and sales prices are not healthy for steel producers.”
“Inventory positions (and costs!) will improve and the much ballyhooed 2023 trifecta of auto, energy and infrastructure will have arrived!”
“We are experiencing many low-priced offers which are impossible to accept.”
“I am optimistic as a buyer, but a more “real” recession is on the horizon where we will see more demand destruction.”
“The longer that the economy stalls, the more apprehensive people are going to be.”
“Customer backlogs are full, into 1st quarter 2023.”
About the SMU Steel Buyers Sentiment Index
SMU Steel Buyers Sentiment Index is a measurement of the current attitude of buyers and sellers of flat-rolled steel products in North America regarding how they feel about their company’s opportunity for success in today’s market. It is a proprietary product developed by Steel Market Update for the North American steel industry. Tracking steel buyers’ sentiment is helpful in predicting their future behavior.
Positive readings run from +10 to +100. A positive reading means the meter on the right-hand side of our home page will fall in the green area indicating optimistic sentiment. Negative readings run from -10 to -100. They result in the meter on our homepage trending into the red, indicating pessimistic sentiment. A reading of “0” (+/- 10) indicates a neutral sentiment (or slightly optimistic or pessimistic), which is most likely an indicator of a shift occurring in the marketplace. Sentiment is measured via Steel Market Update surveys that are conducted twice per month. We display the meter on our home page.
We send invitations to participate in our survey to more than 700 North American companies. Approximately 45% of respondents are service centers/distributors, 30% are manufacturers, and the remainder are steel mills, trading companies or toll processors involved in the steel business.
Click here to view an interactive graphic of the SMU Steel Buyers Sentiment Index or the SMU Future Steel Buyers Sentiment Index.
By Brett Linton, Brett@SteelMarketUpdate.com


