Market Data

September 16, 2022
Energy Market Analysis Through September
Written by Brett Linton
The Energy Information Administration’s August Short-Term Energy Outlook (STEO) was released earlier this month, forecasting spot prices and production for crude oil and natural gas. Crude oil prices are expected to remain at heightened levels for the remainder of this year, rising slightly into 2023. Natural gas prices are forecast to remain near recent highs through the remainder of the year, but to ease into 2023 as production rises. EIA notes a level of uncertainty in its forecast, explaining, “the possibility of petroleum supply disruptions and slower-than-expected crude oil production growth continues to create the potential for higher oil prices, while the possibility of slower-than-forecast economic growth creates the potential for lower prices.”
In this Premium analysis we cover oil and natural gas prices, North American drilling rig activity, active drill rigs by state, and US crude oil stock levels.
Updated last week, you can view the latest EIA Short-Term Energy Outlook here.
Oil and Gas Spot Prices
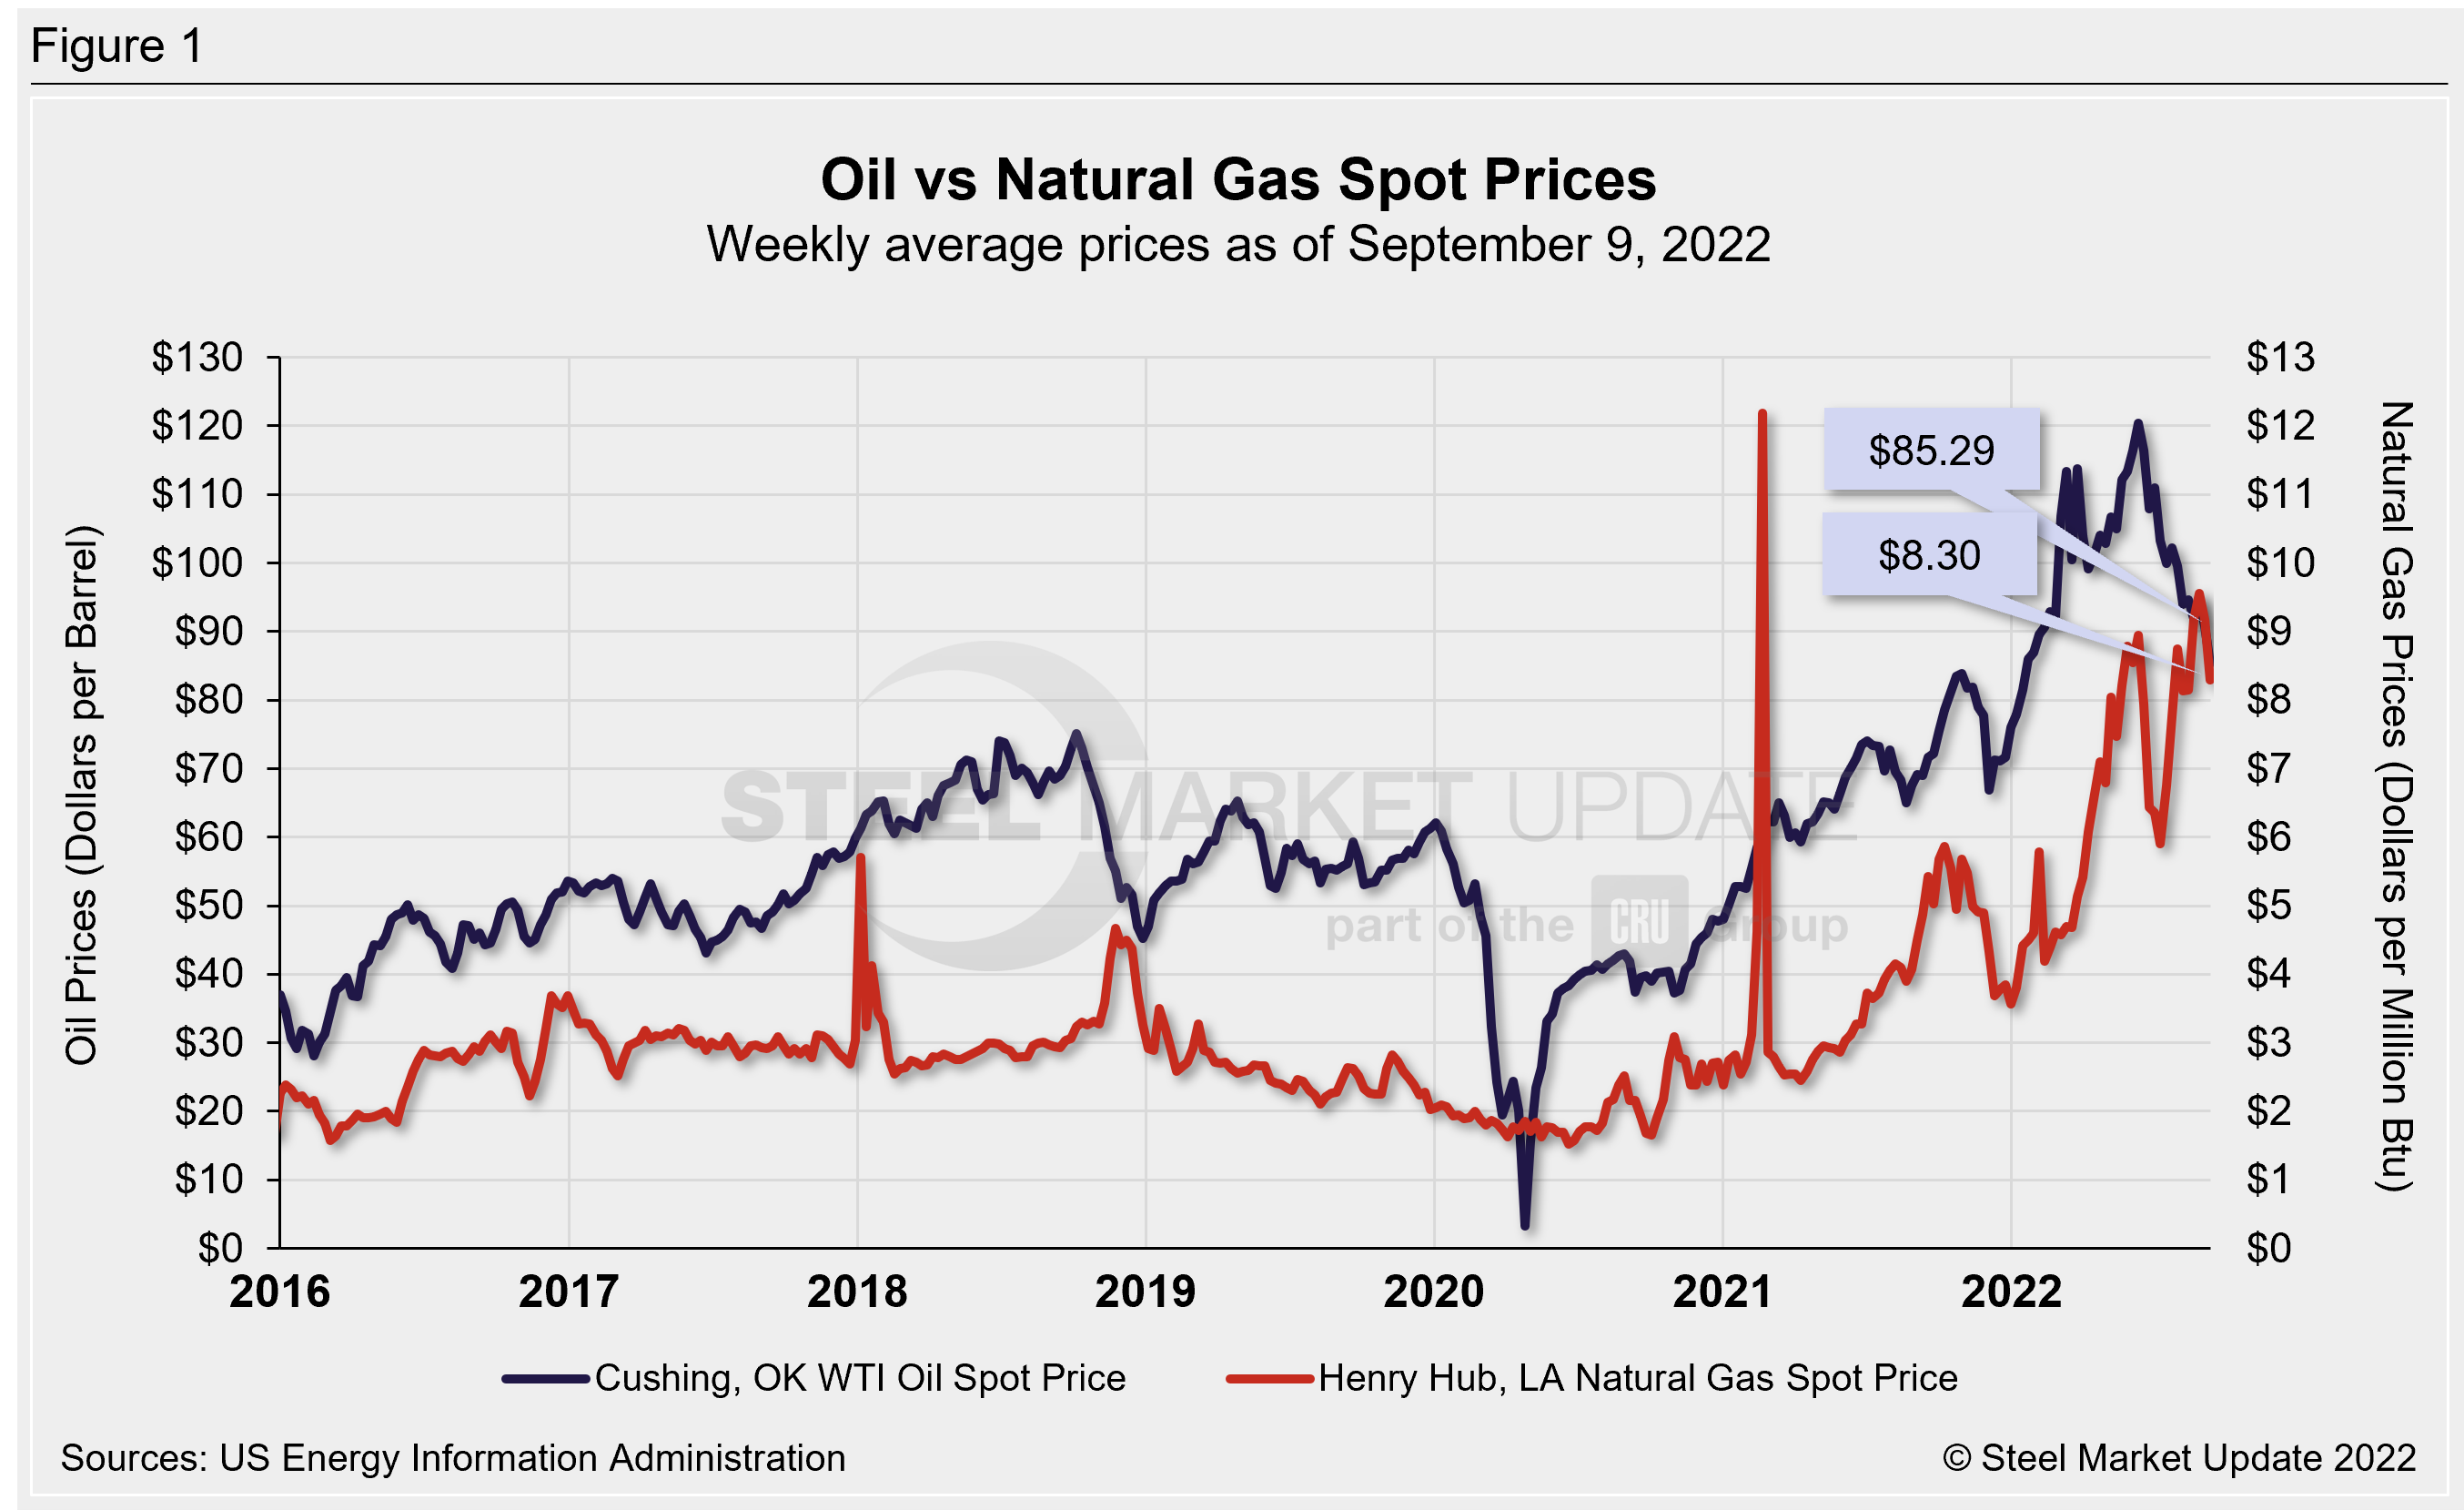
The weekly West Texas Intermediate oil spot market price was $85.29 per barrel as of the week ending Sept. 9 (Figure 1), now the lowest weekly figure seen since January. Oil spot prices have been gradually easing from the 13+ year high of $120.43/b seen in early June. For comparison, the record high in the EIA’s 36-year data history occurred in July 2008 at $142.52/b. Through September, the EIA expects oil spot prices to average $98/b in Q4 2022 and forecasts an average price of $97/b across 2023 (up from $95 in the previous estimate).
Natural gas spot prices continued to soar higher: In the last week of August prices climbed to a 14-year record of $9.56 per Metric Million British Thermal Units (MMBTU). (Note that we are excluding high spot prices in Feb. 2021 resulting from winter storms and supply scarcity). The spot price as of Sept. 9 has eased slightly to $8.30/MMBTU. Back in early June, spot prices peaked at $8.95/MMBTU, which at that time was the highest level since 2008. The record high in the EIA’s 36-year history was $14.49/MMBTU the week of Dec. 16, 2005. EIA expects natural gas prices to average $9.00/MMBTU in Q4 2022 and forecasts 2023 to average $6.00/MMBTU (up from $5.10 in their previous estimate).
Rig Counts
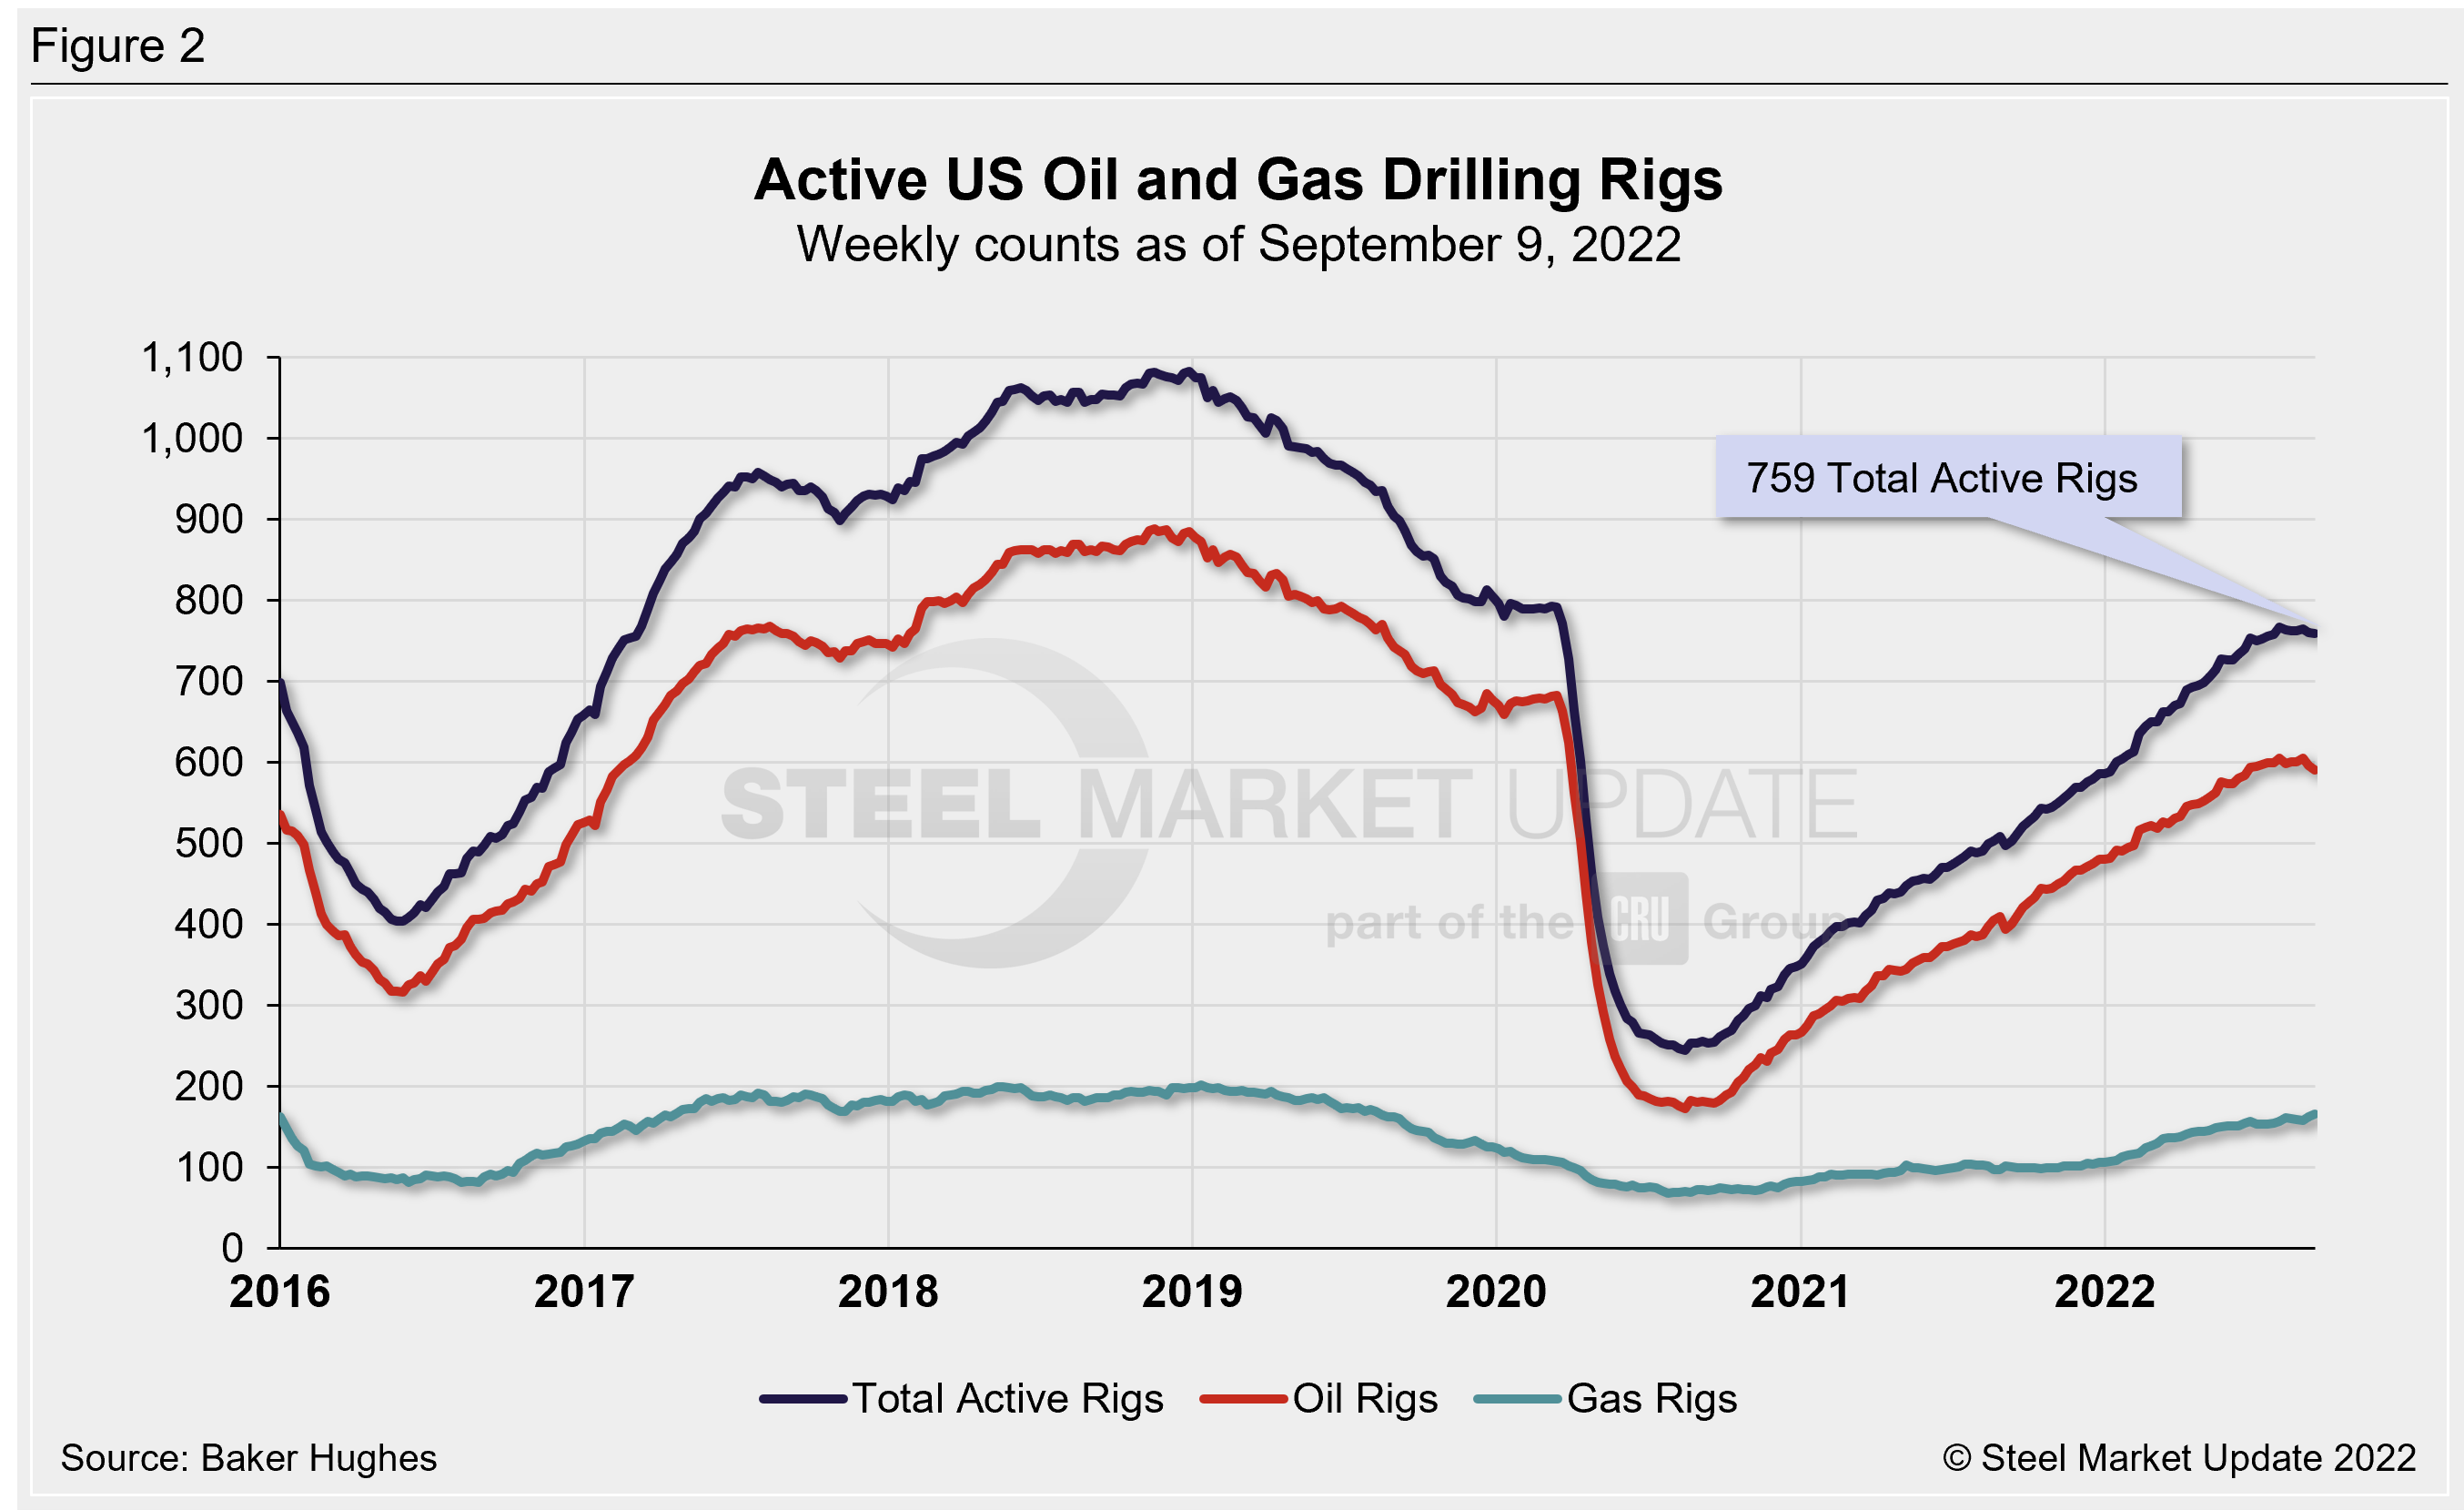
The number of active US oil and gas drill rigs continues to recover from mid-2020 lows. The latest US count was 759 active drill rigs as of the end of last week, comprised of 591 oil rigs, 166 gas rigs, and two miscellaneous rigs, according to Baker Hughes (Figure 2). Active rig counts are up 51% versus this time last year, and down 4% compared to pre-Covid shutdowns in March 2020.
The latest Canadian rig count climbed to 205 rigs, comprised of 140 oil rigs and 65 gas rigs. Canadian rig counts are up 43% compared to one year prior, but down 16% from pre-Covid levels (Figure 3).
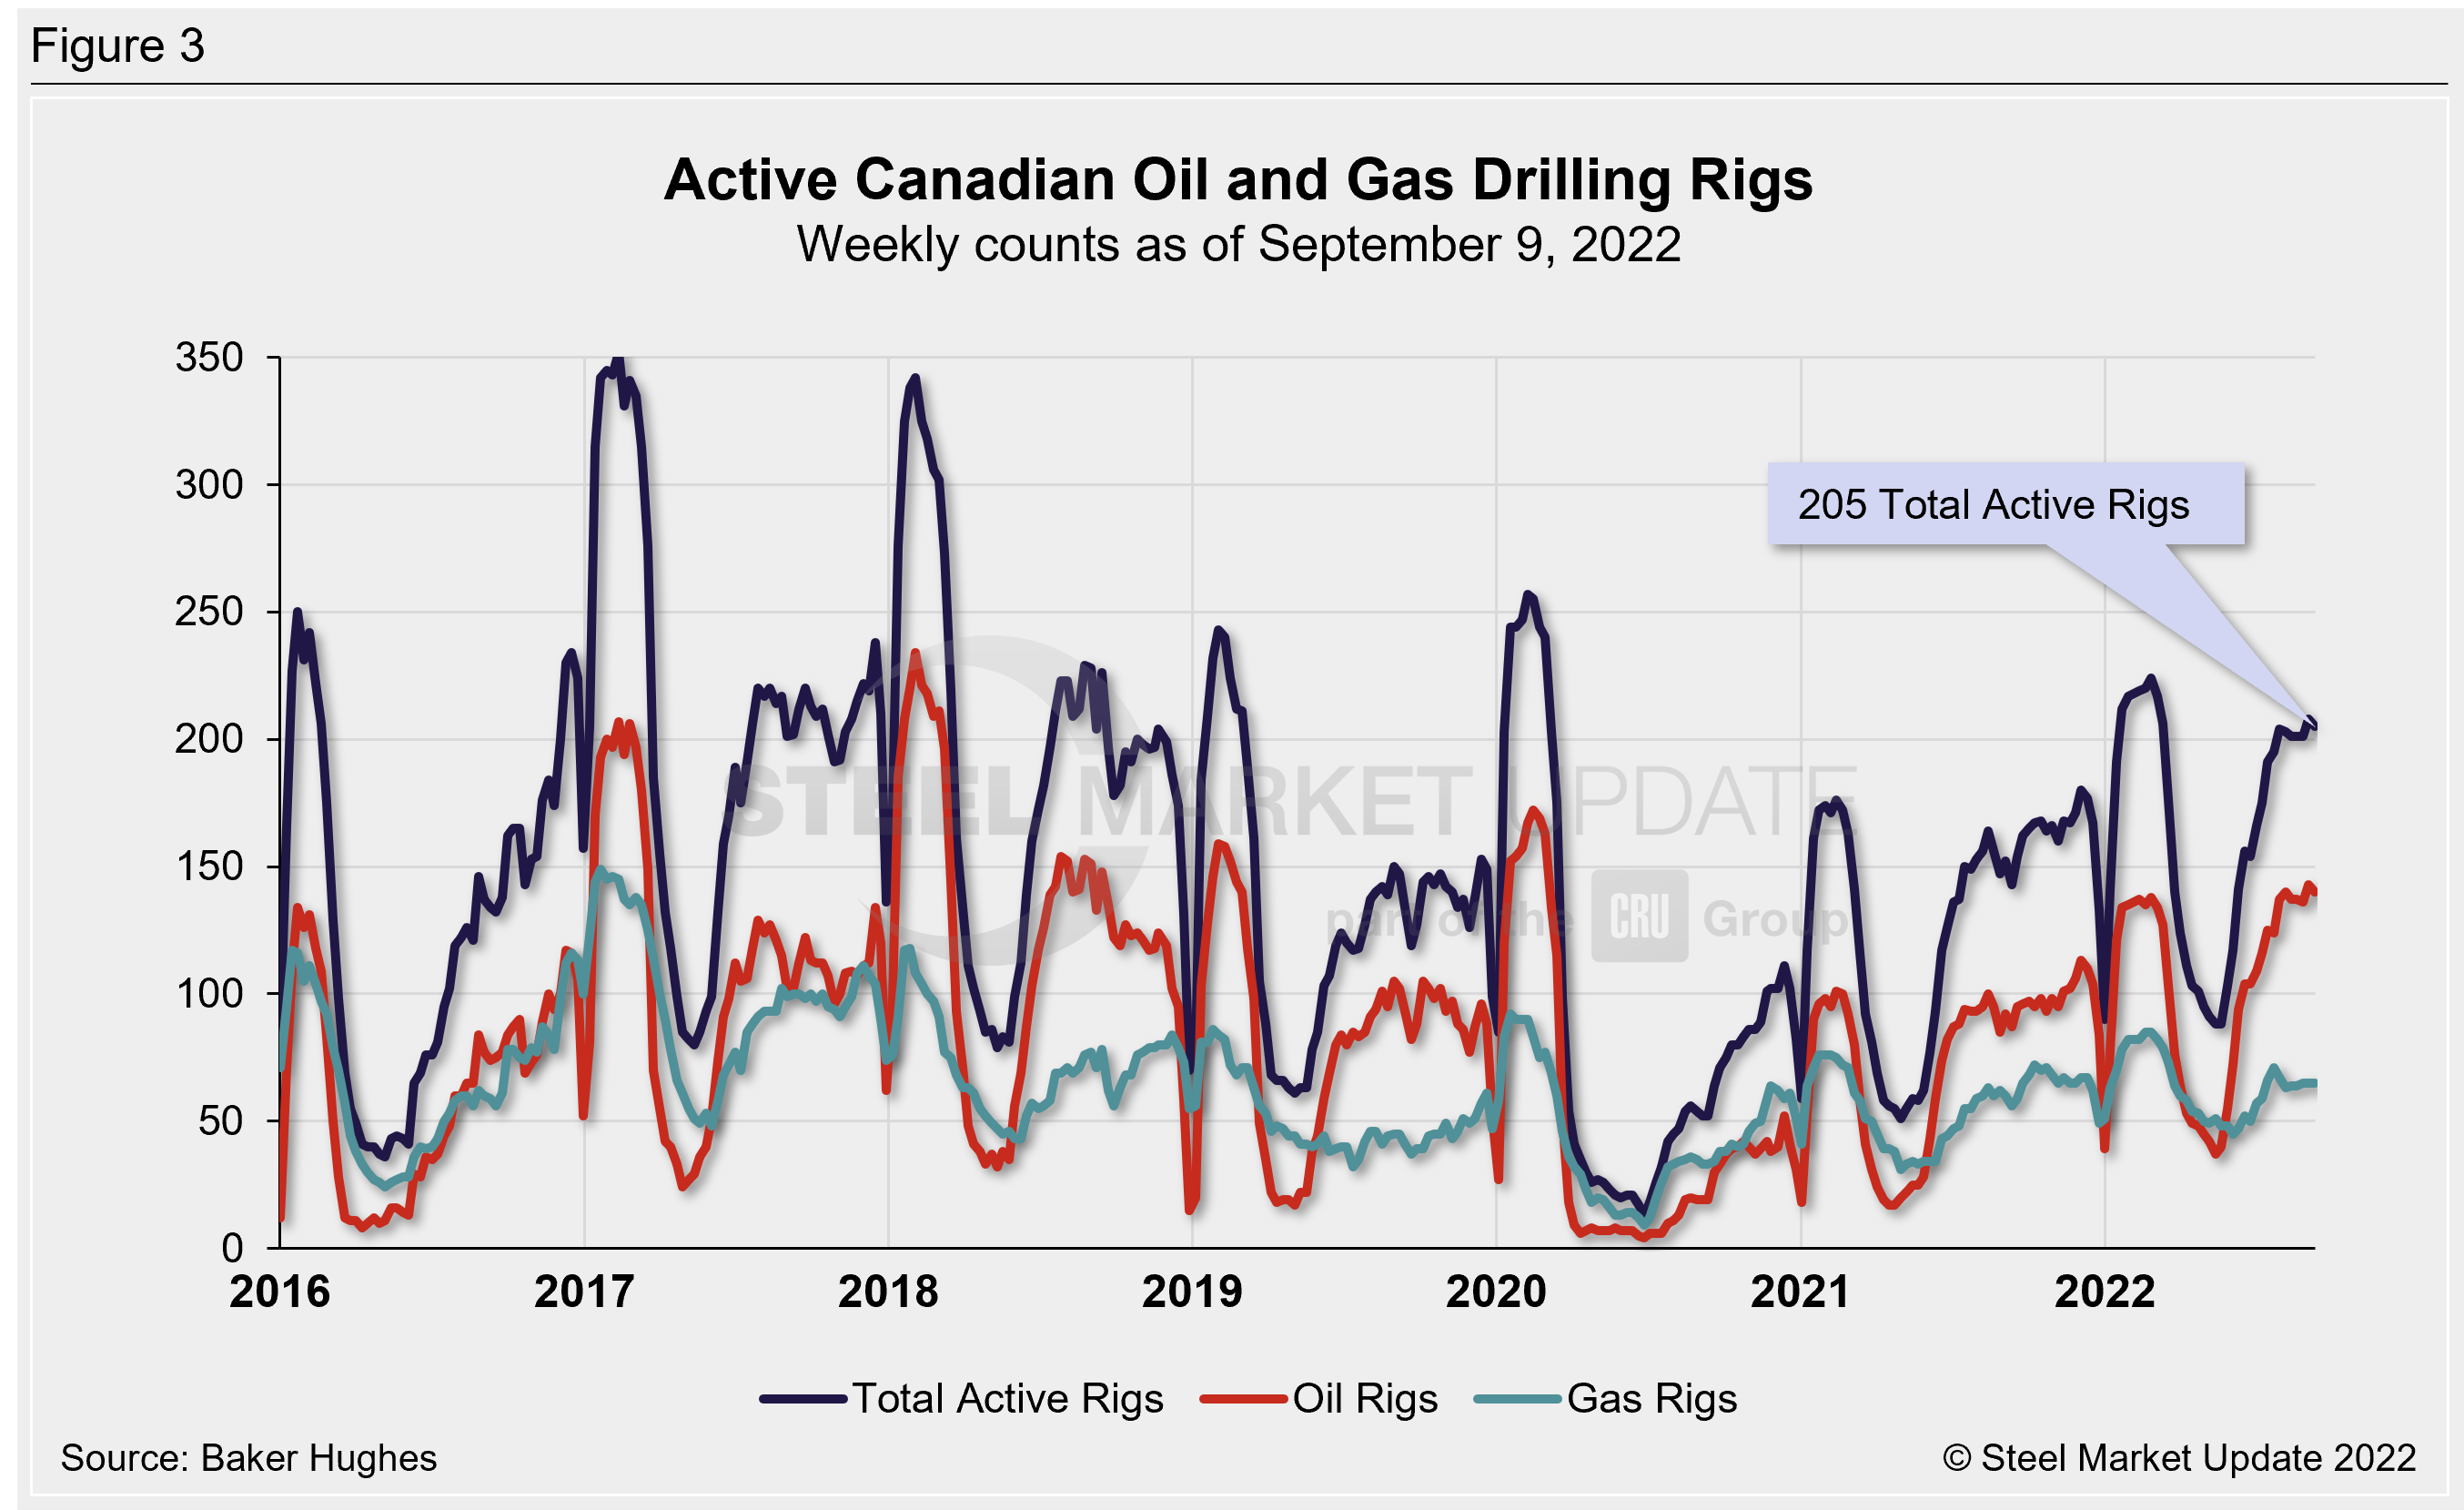
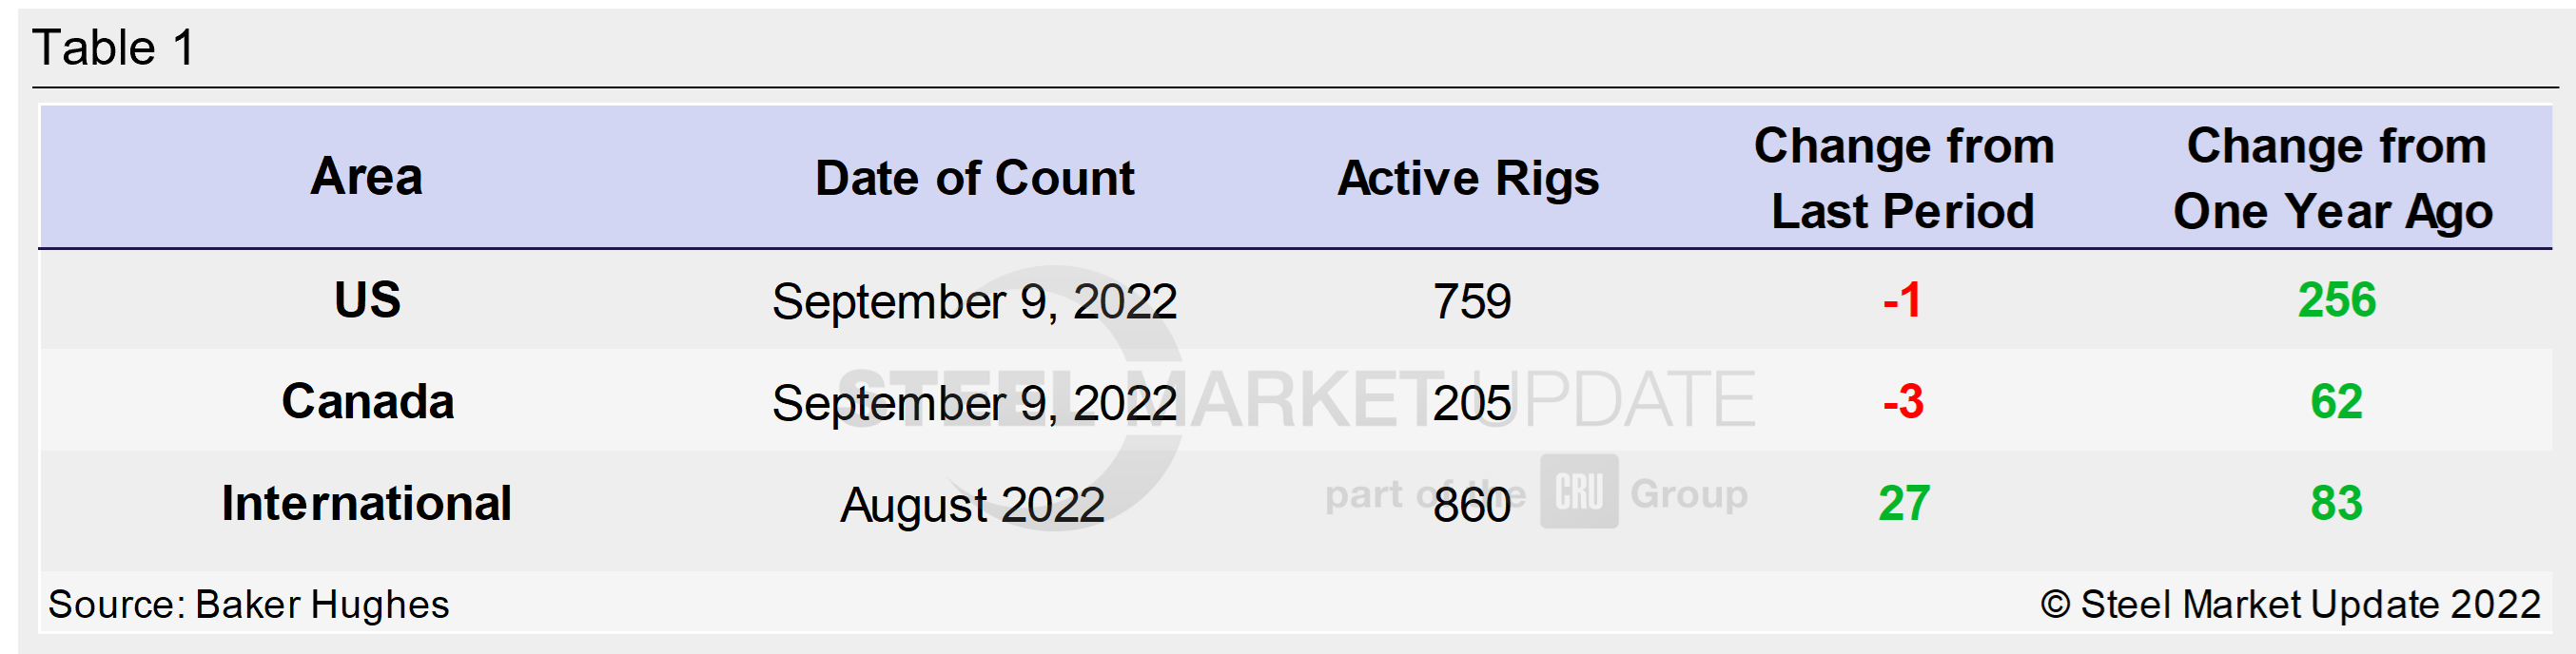
Table 1 below compares the current US, Canadian and international rig counts to historical levels.
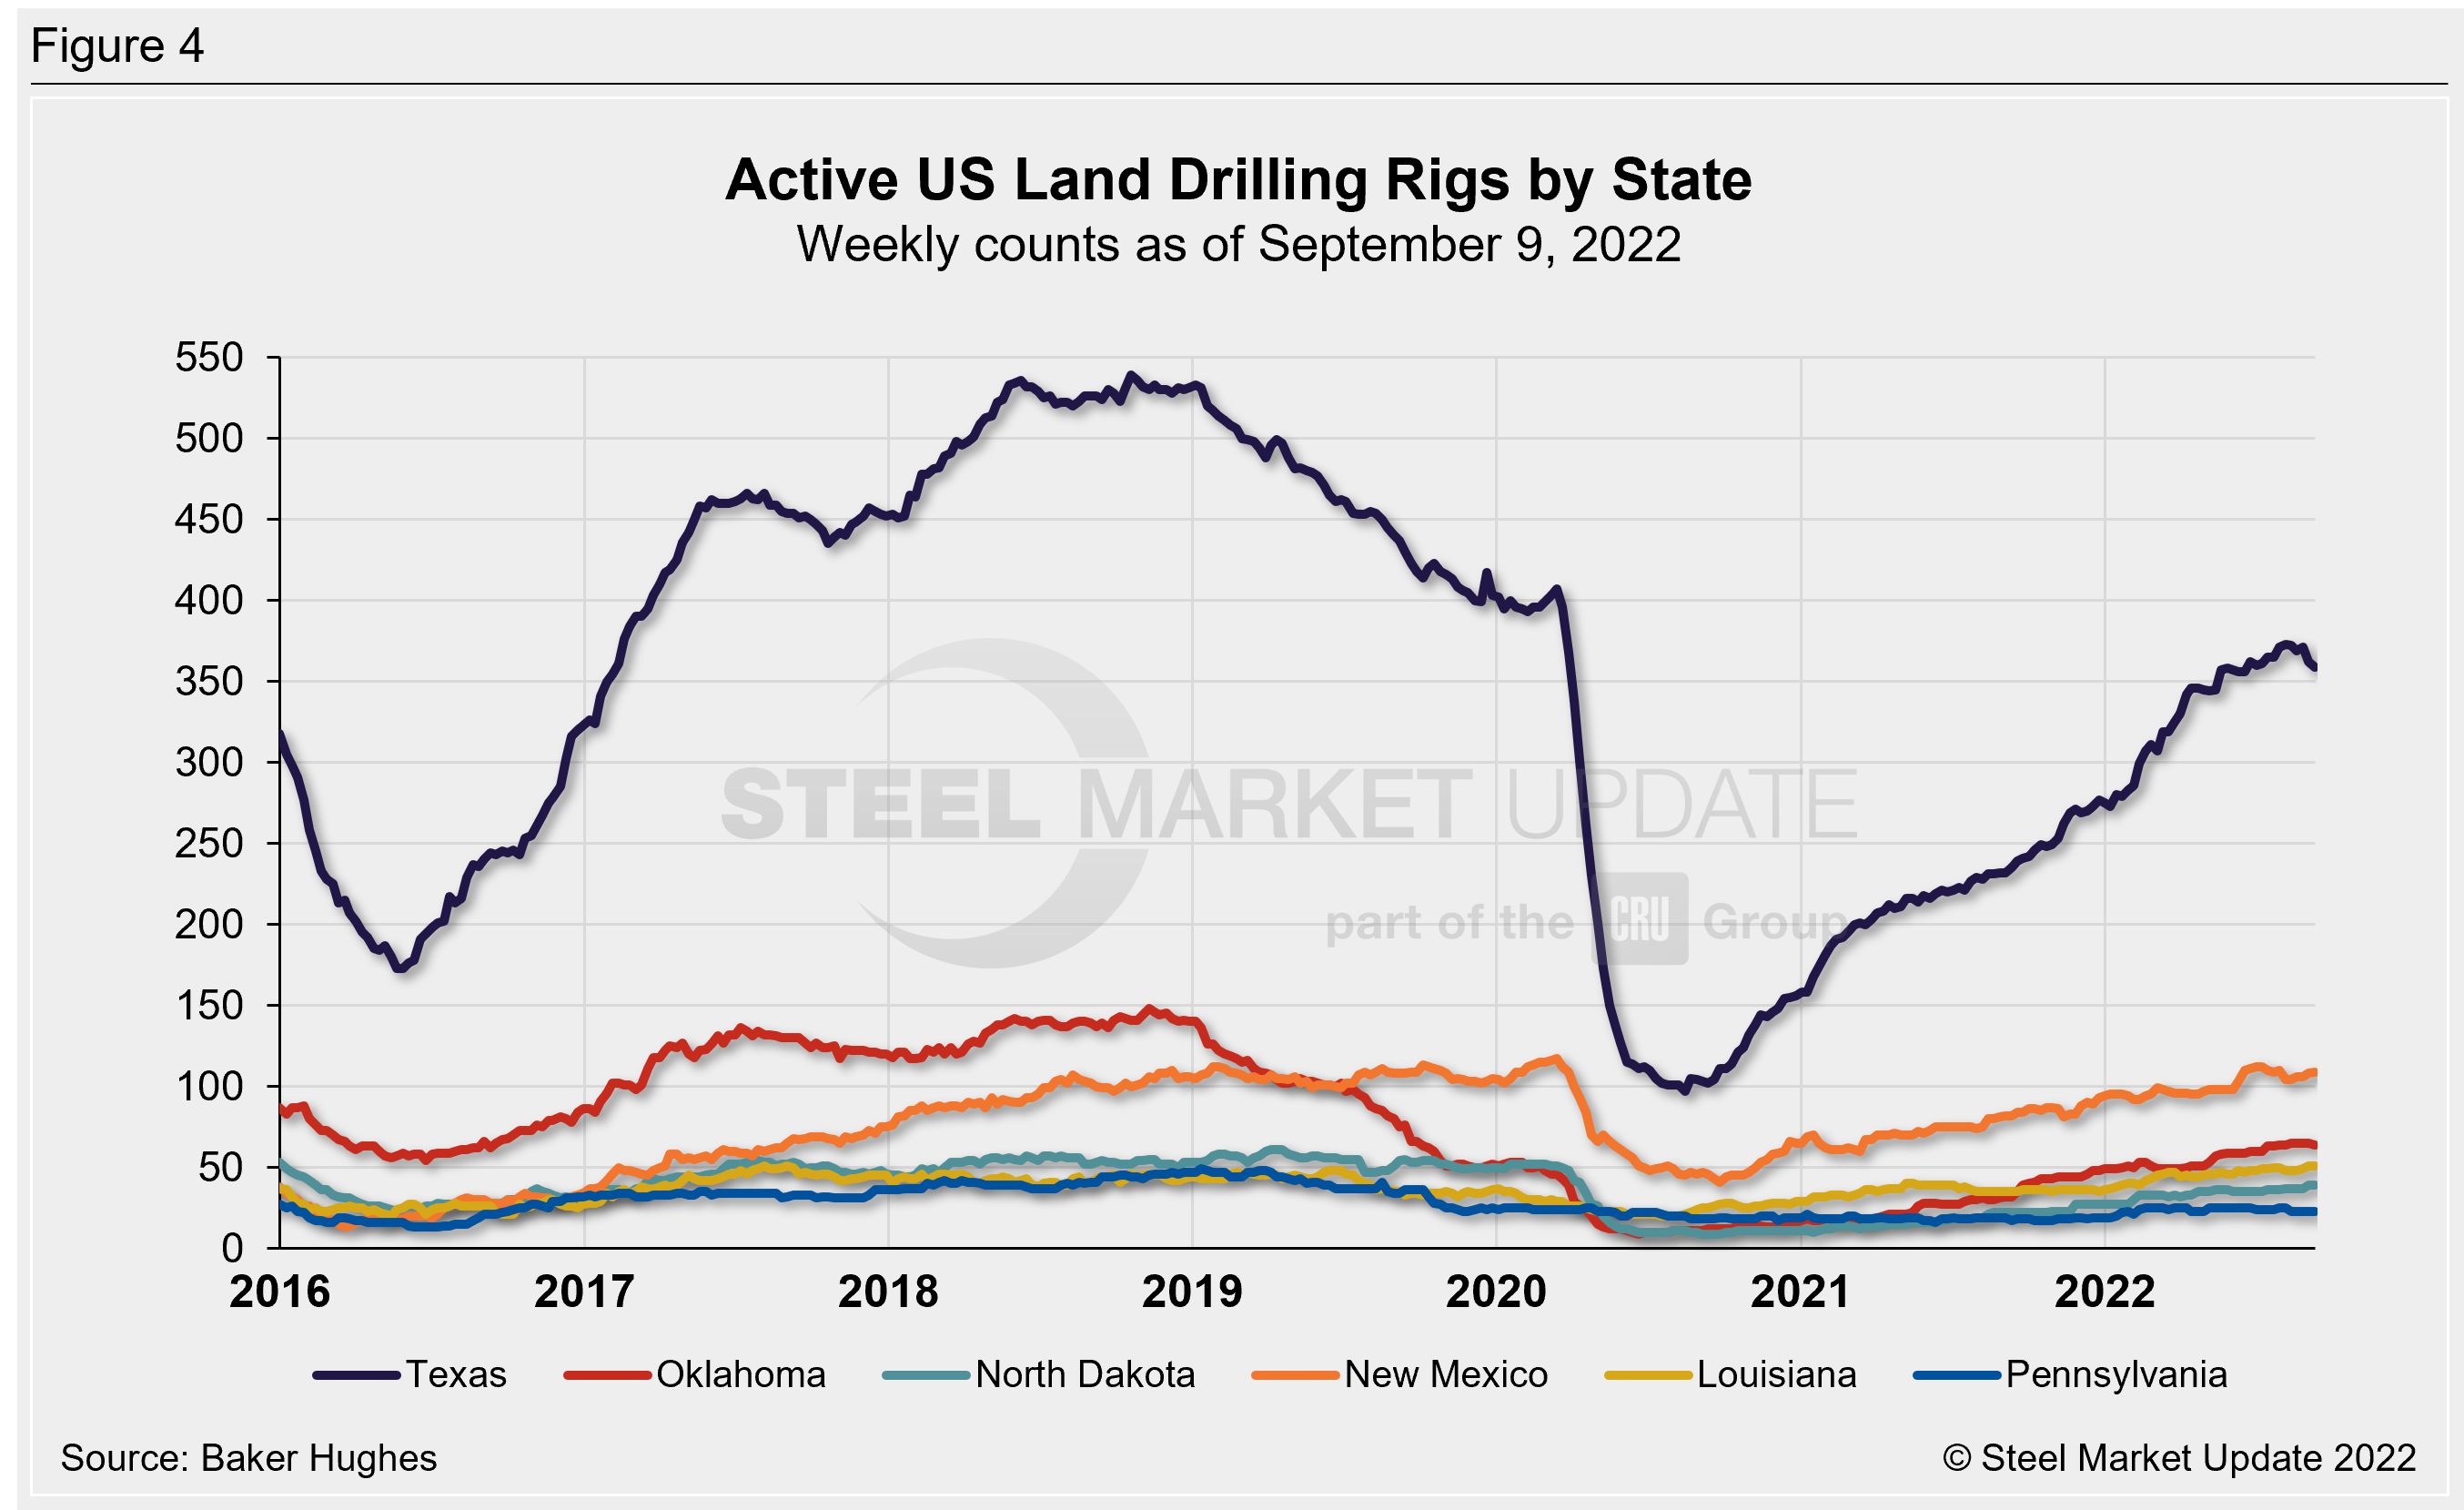
US oil and gas production is heavily concentrated in Texas, Oklahoma, North Dakota, and New Mexico. As of Sept. 9, production remains strong for each state, but has softened slightly in recent weeks (Figure 4). Texas is the most active state with 359 rigs in operation and New Mexico is the second highest with 109 rigs. Recall that the number of active Texas rigs had plummeted 76% in 2020, falling from 407 in April to 97 rigs in August.
Stock Levels
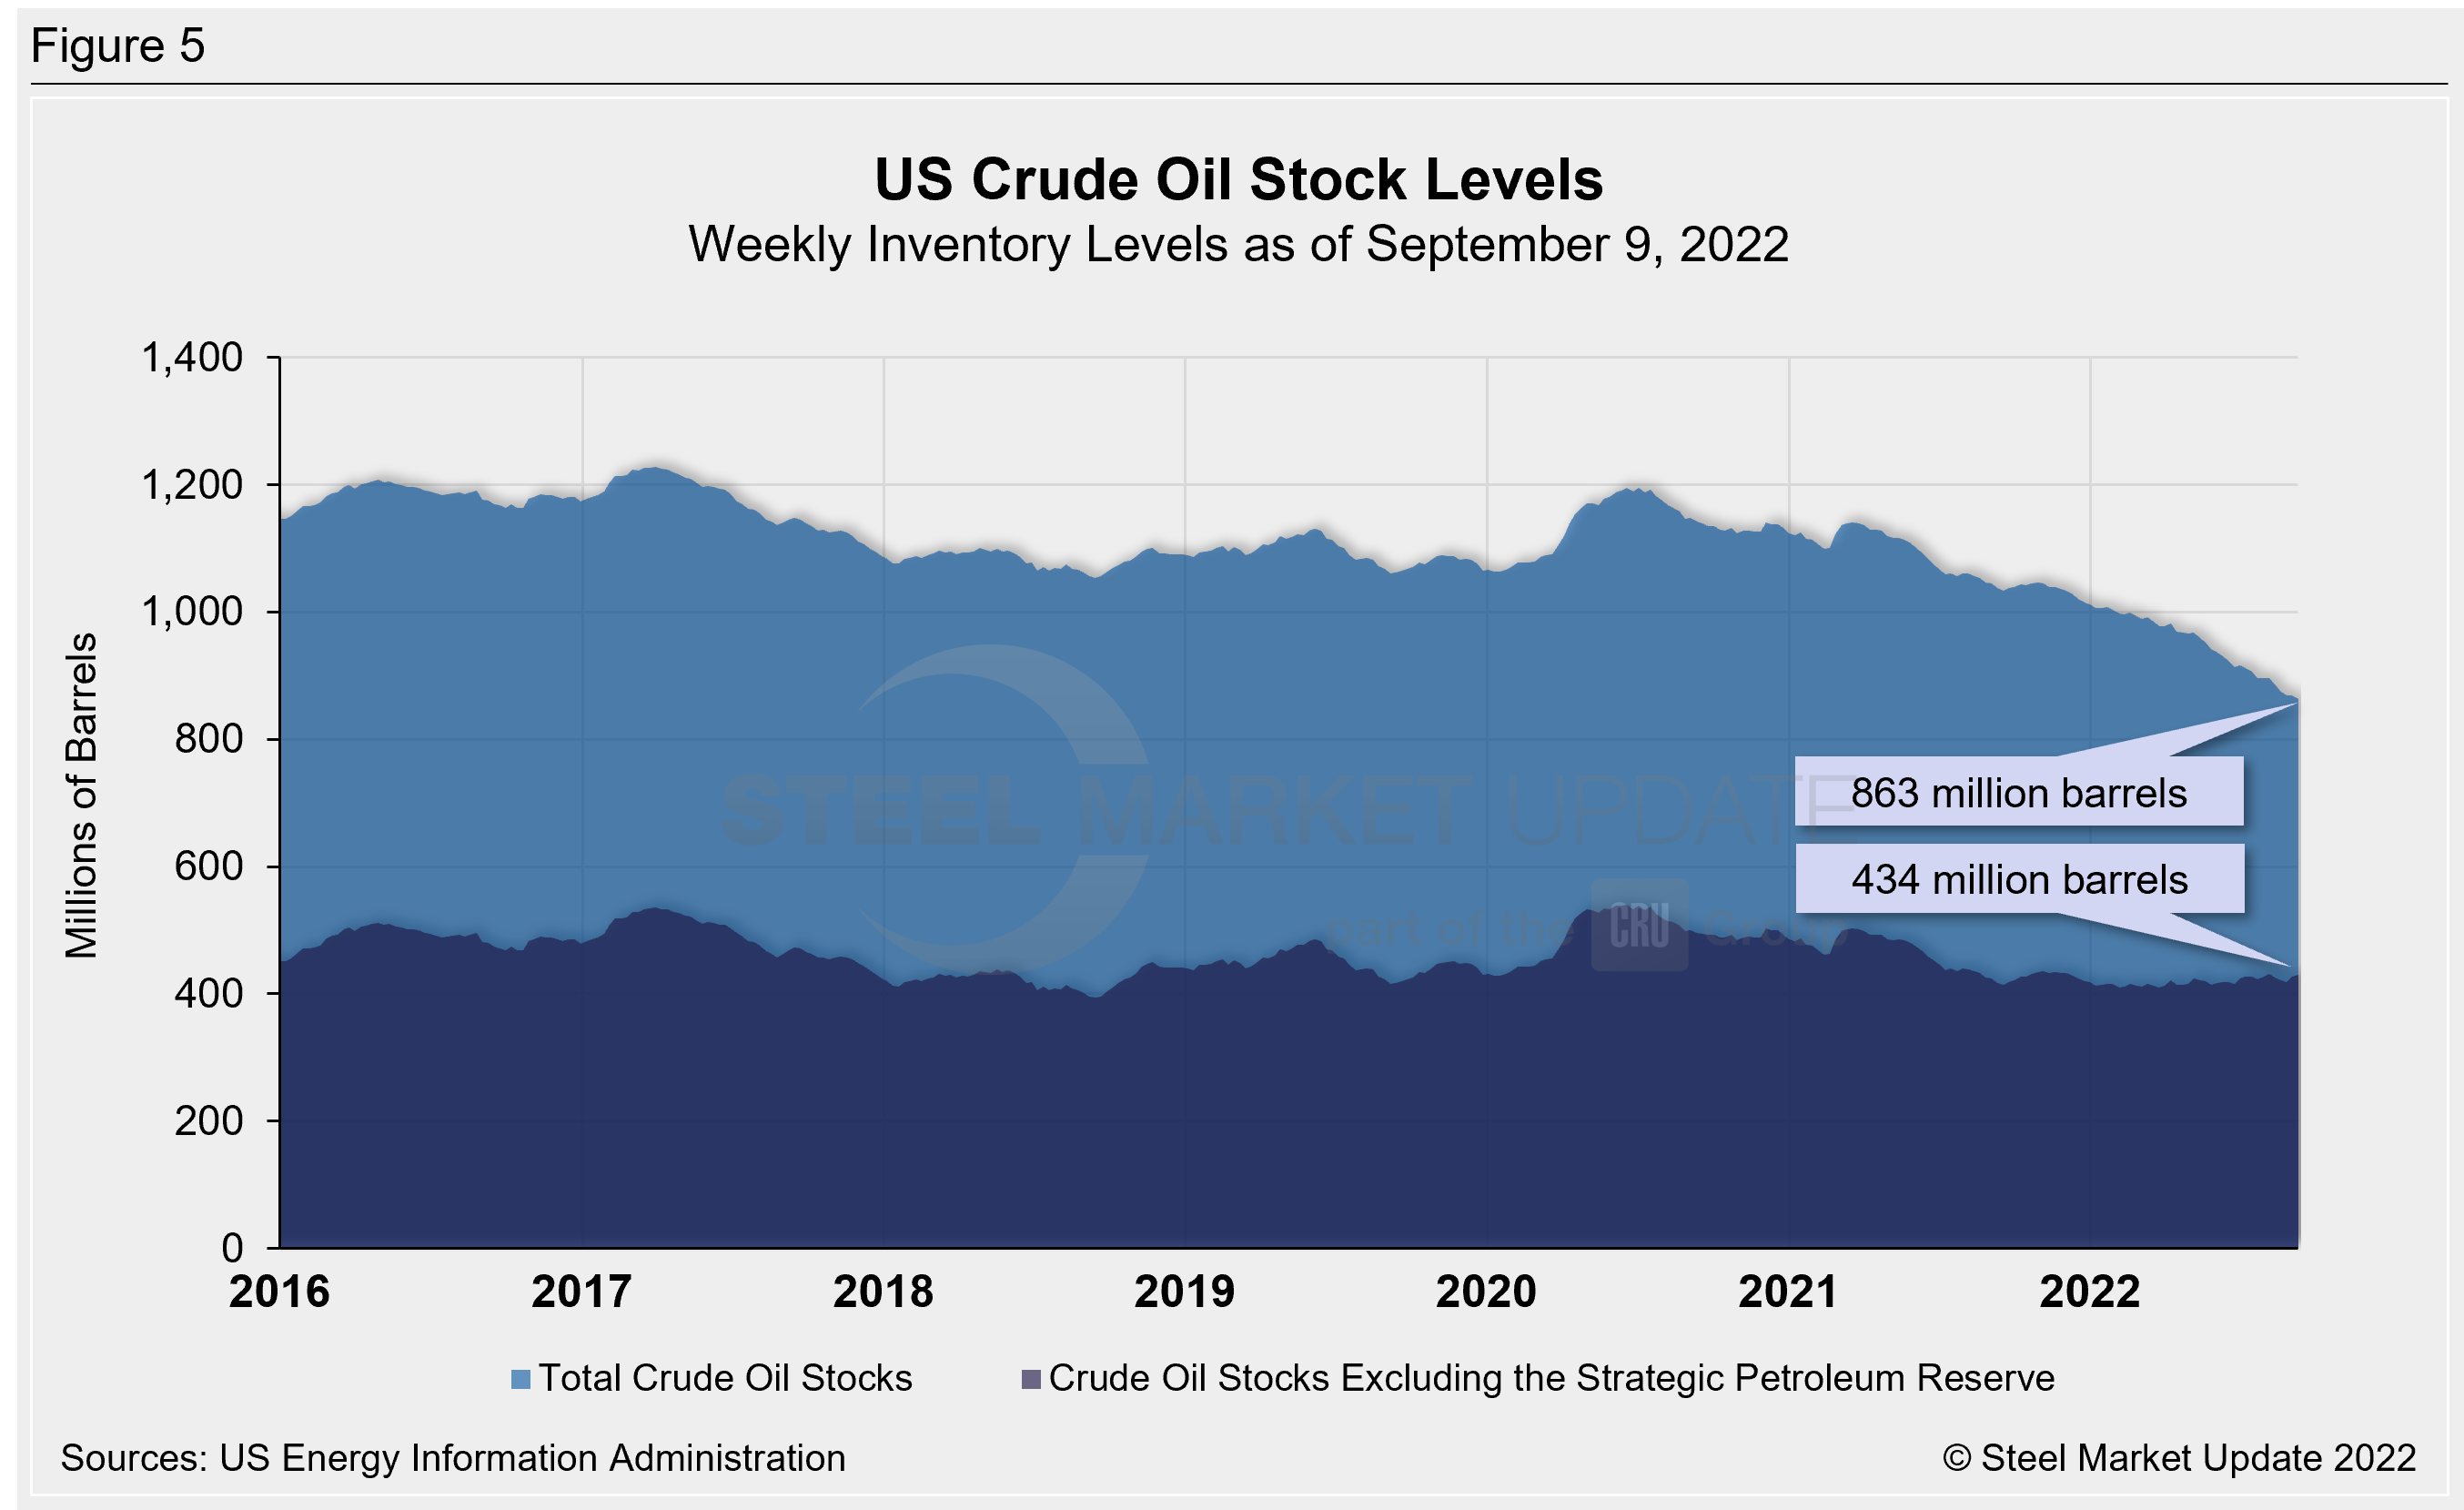
US total crude oil stocks continue to decline from mid-2020 highs, falling to a 19-year low of 863 million barrels as of Sept. 9. For comparison, the record low in the EIA’s 40-year history was 608 million barrels in October 1982. Last week’s stock level is down 17% from 1.038 billion barrels one year ago (Figure 5).
Trends in energy prices and rig counts are an advanced indicator of demand for oil country tubular goods (OCTG), line pipe and other steel products.
By Brett Linton, Brett@SteelMarketUpdate.com