

Market Data

September 18, 2022
SMU Steel Buyers Sentiment Index Taps the Brakes
Written by Brett Linton
Steel Market Update’s (SMU) Steel Buyers Sentiment Index saw double-digit declines last week, falling to the second-lowest level seen in the past two years. Our Future Steel Buyers Sentiment Index also declined, now tied for the third-lowest reading in that same time frame. Buyers attribute their weaking optimism to profitability concerns on high-cost inventory as well as demand slowdowns and recession fears.
SMU polls hundreds of steel buyers every other week, asking how they view their chances of success in the current market, as well as three to six months down the road.
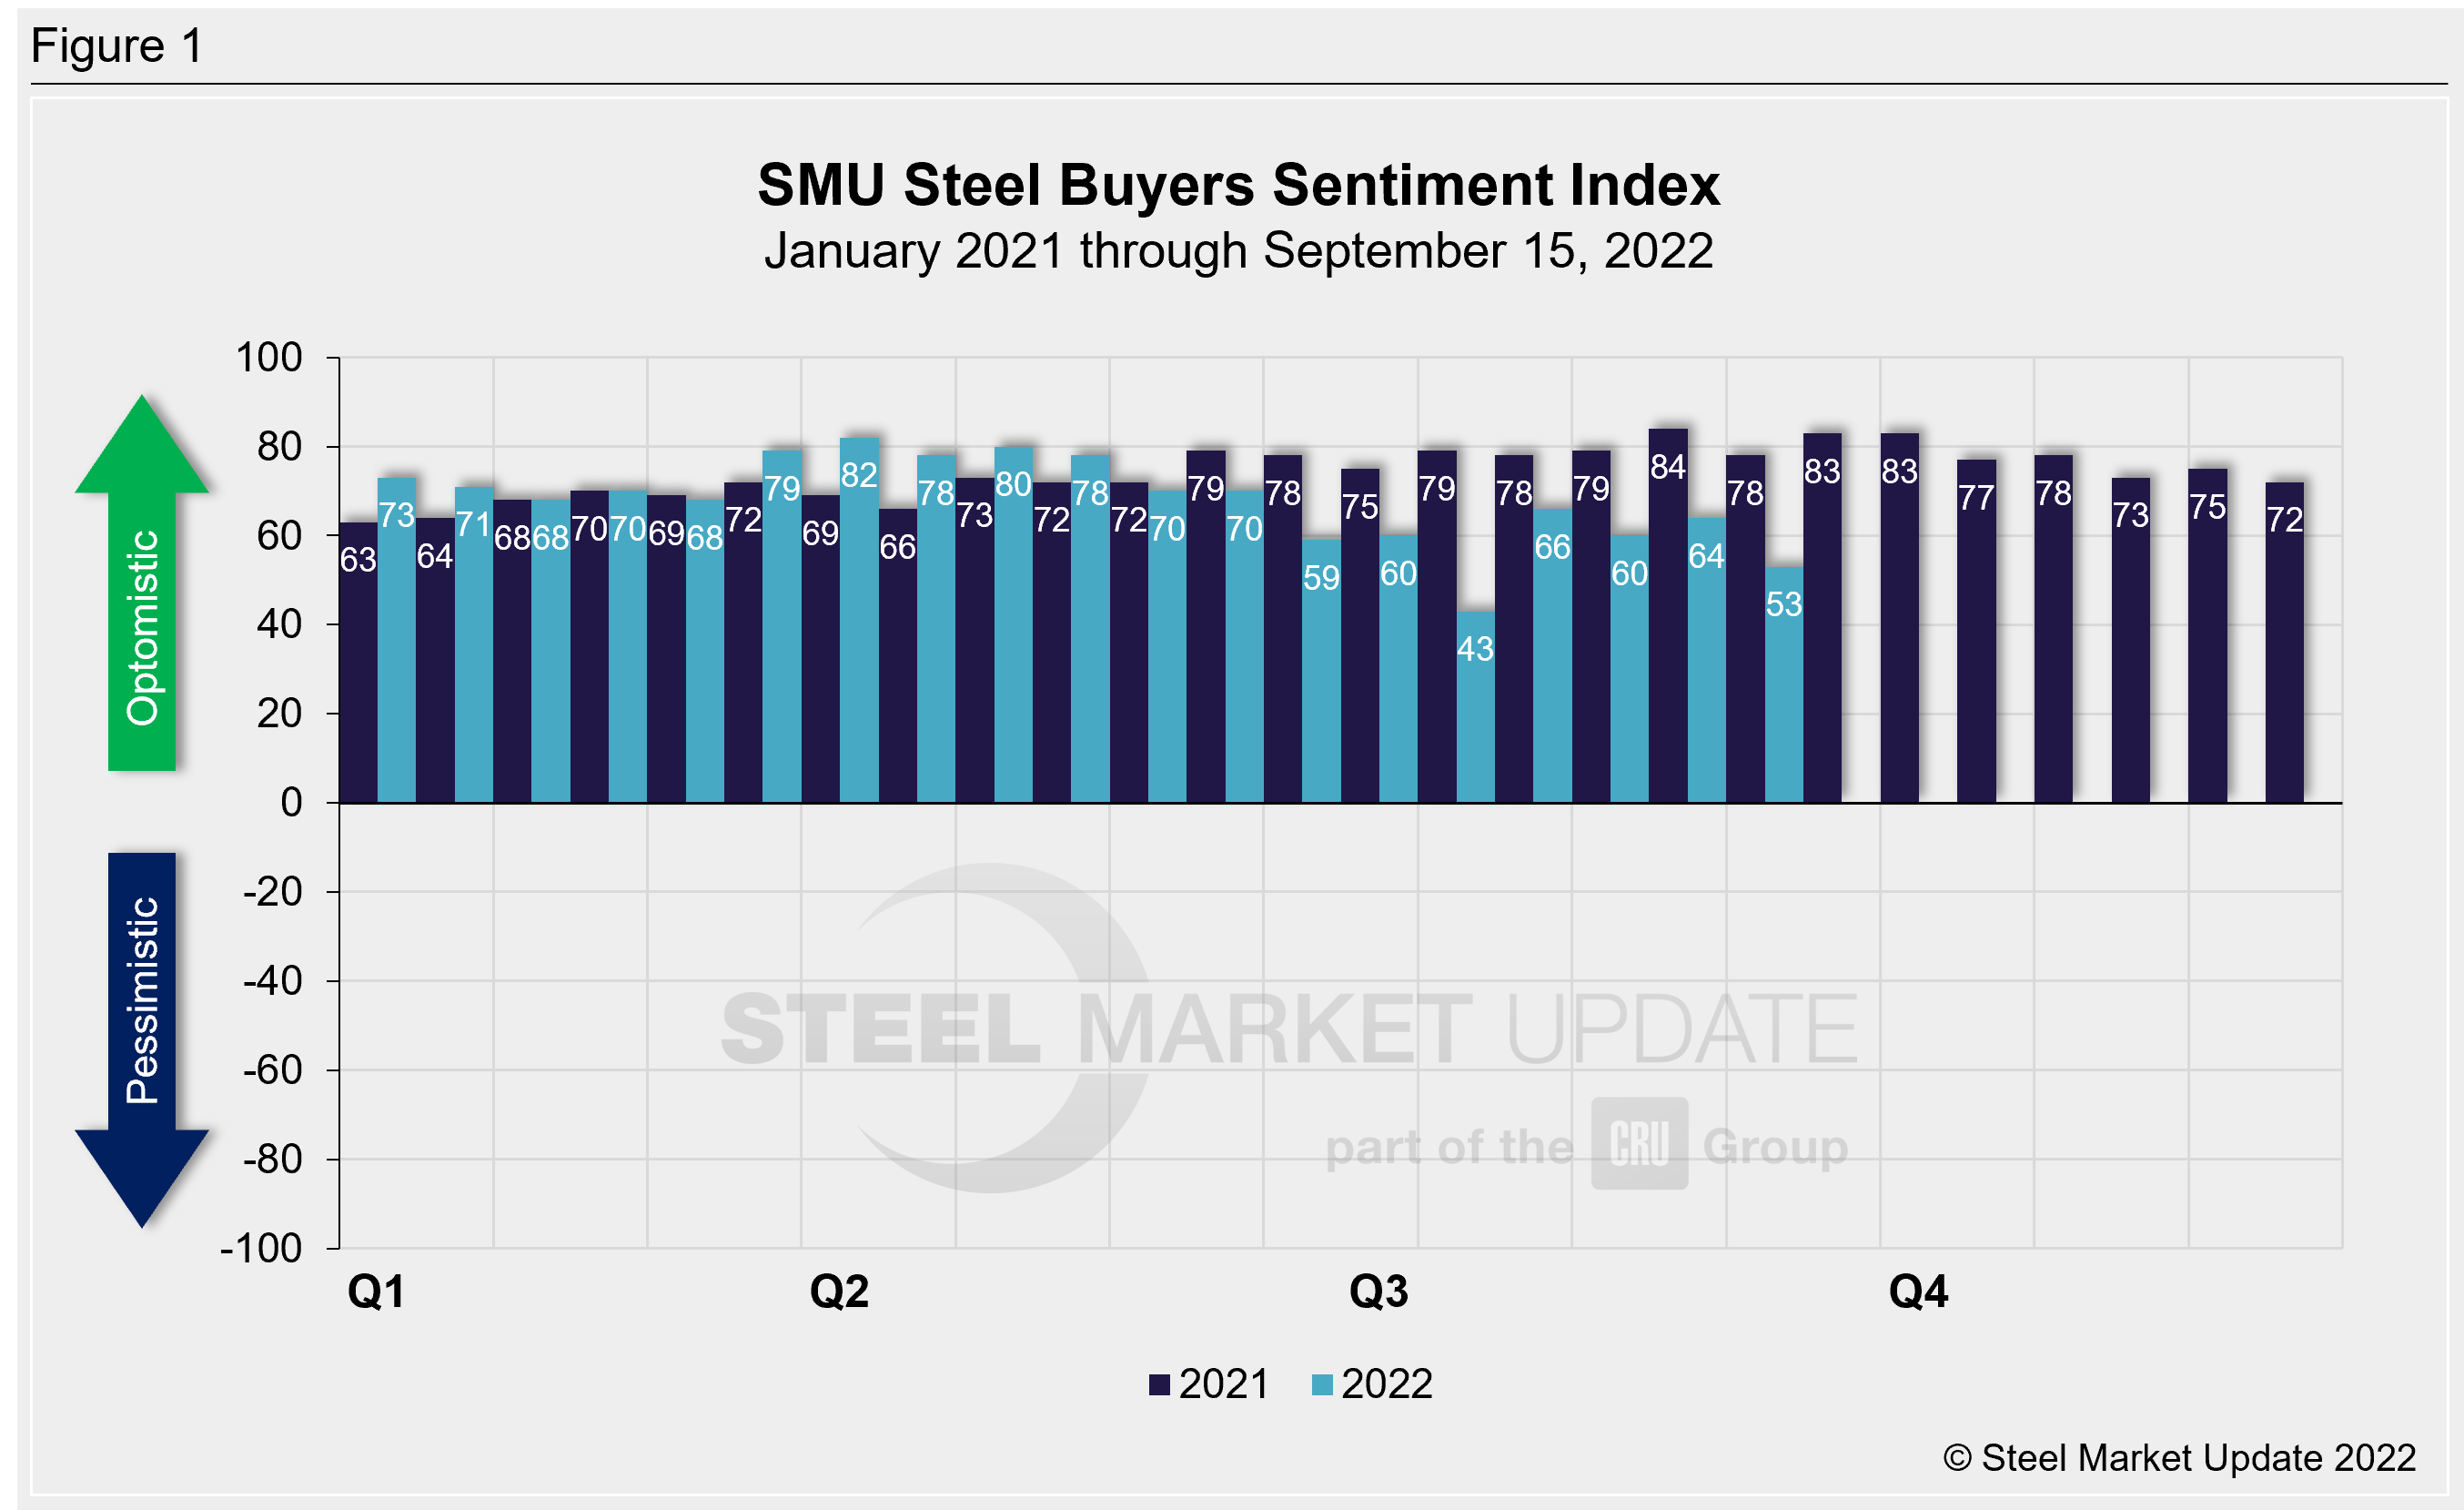
SMU’s Buyers Sentiment Index declined to +53 through the end of last week, down 11 points from our previous market check and down seven points compared to one month ago (Figure 1). Recall that Buyers Sentiment slipped by 17 points to +43 in mid-July, the lowest level seen since August 2020, then quickly rebounded in early August. Our Buyers Sentiment Index peaked at +82 in March of this year.
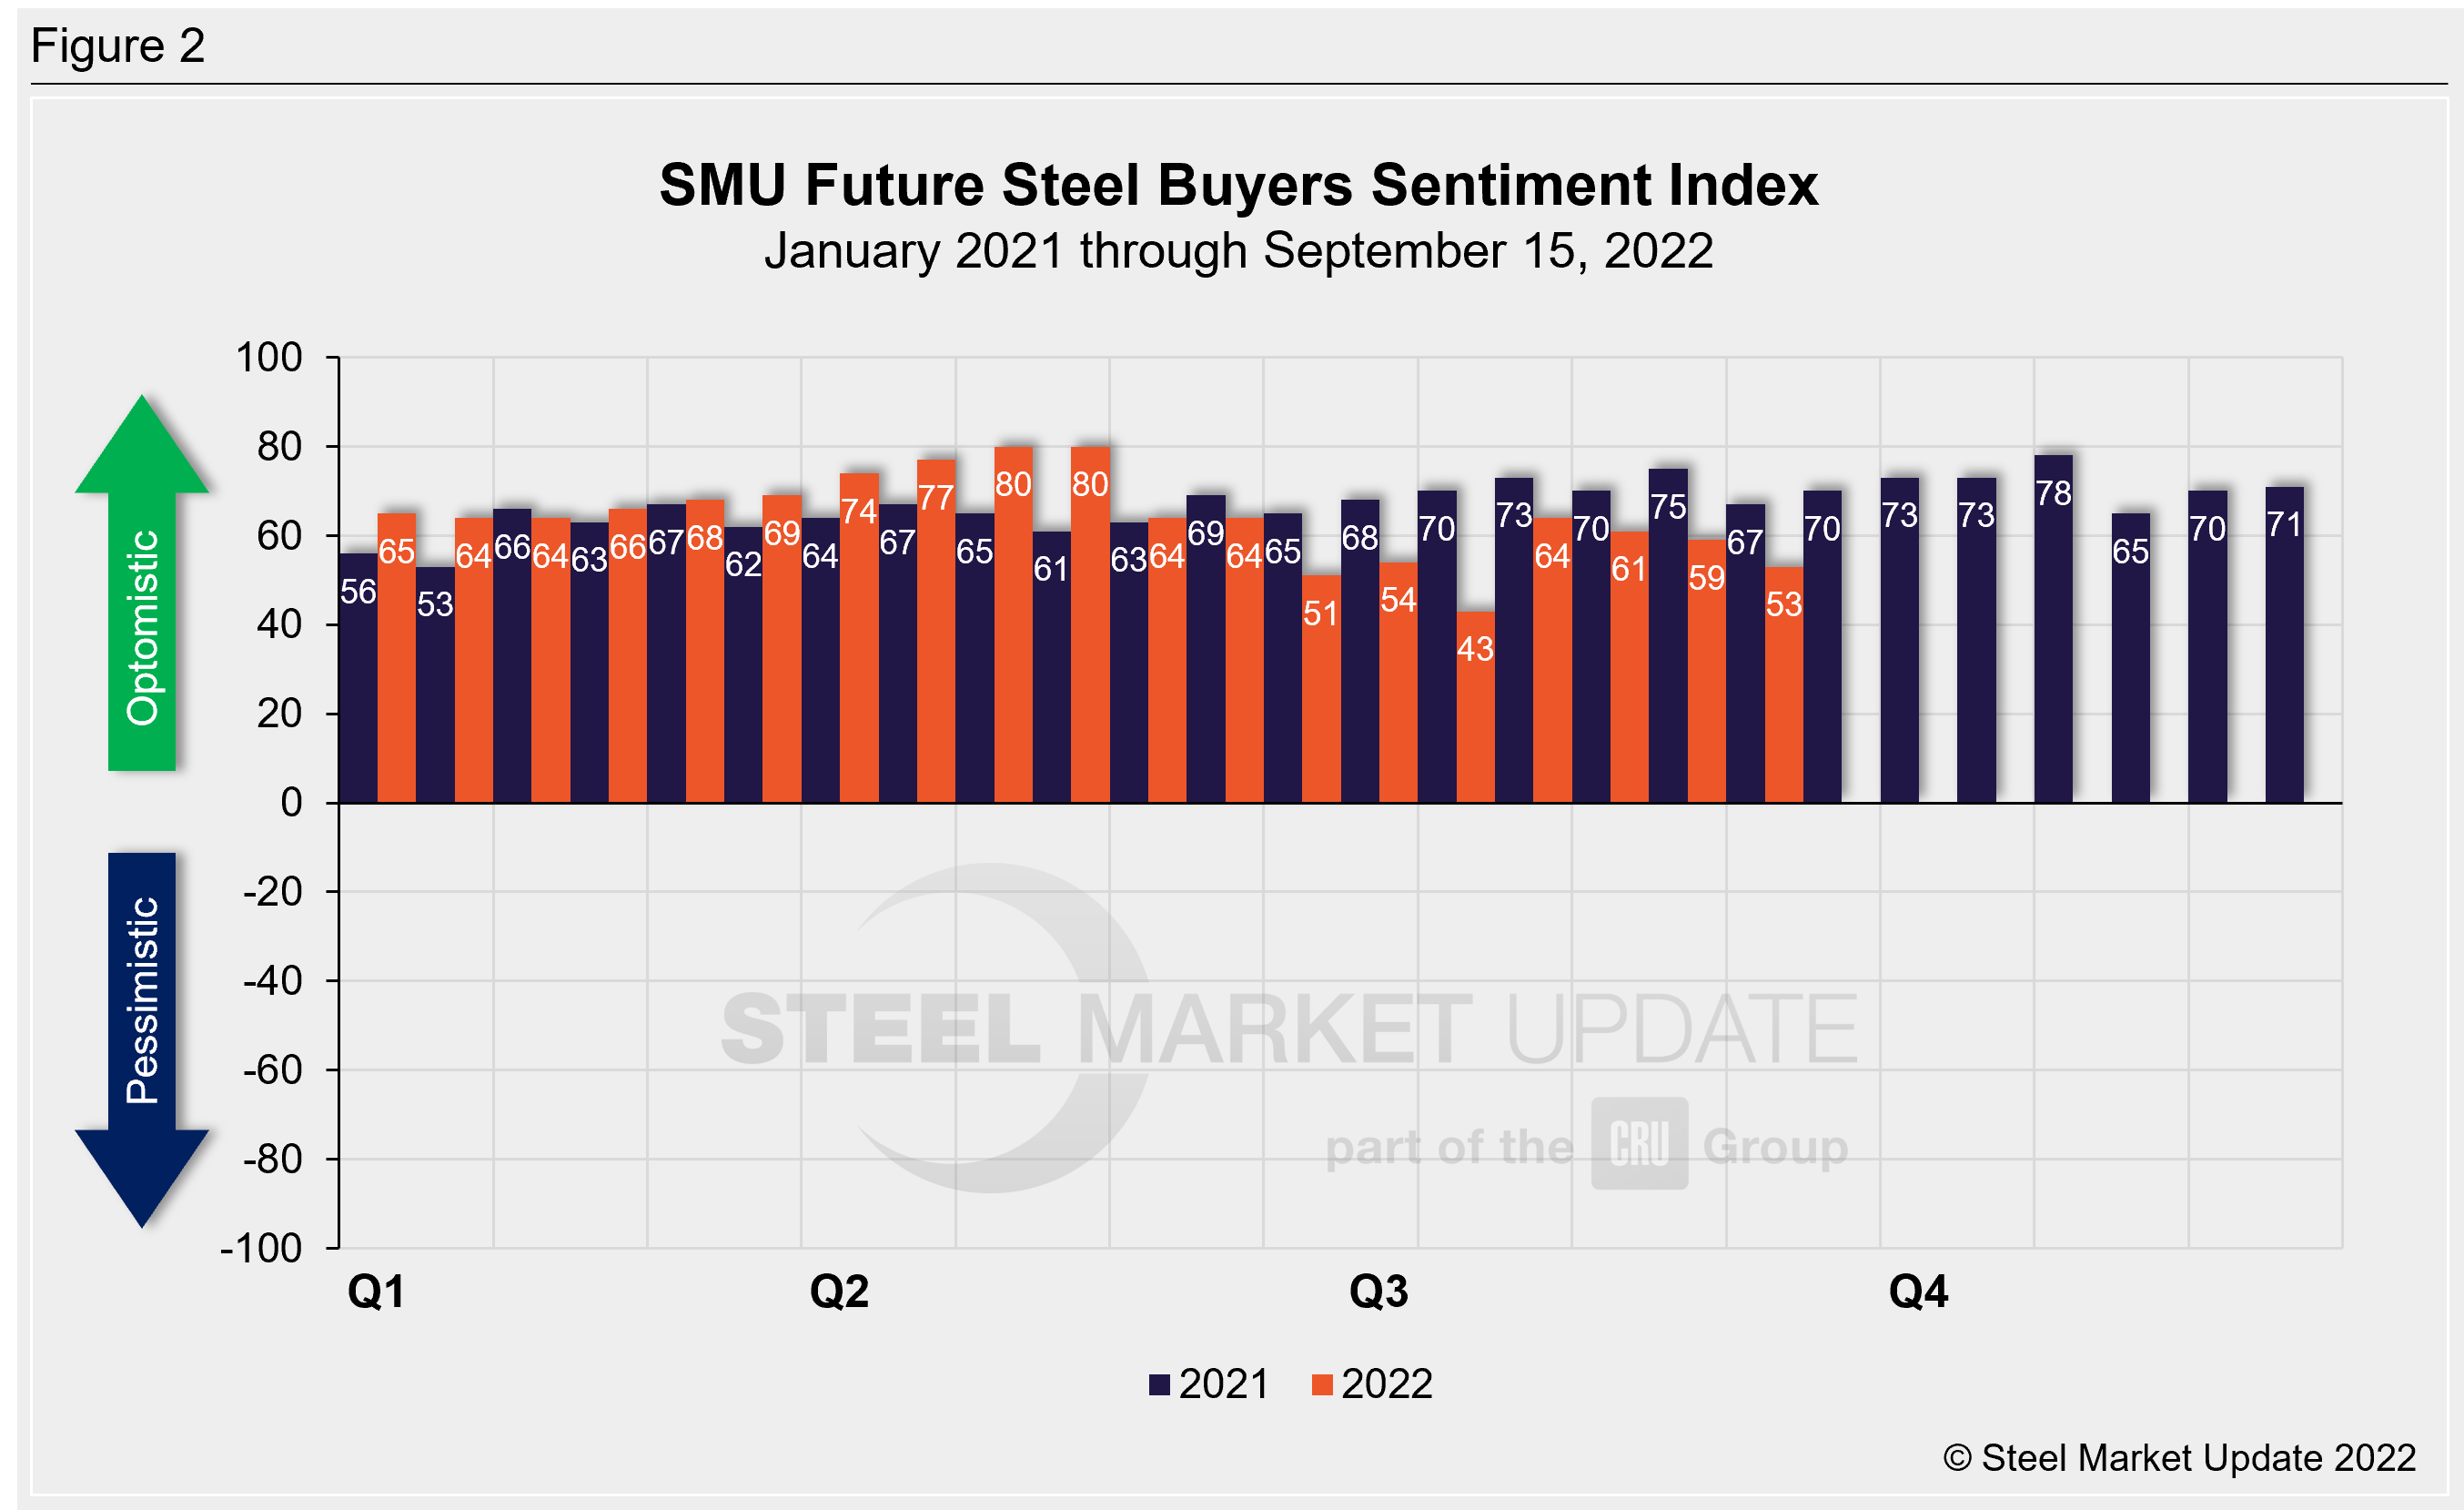
SMU’s Future Buyers Sentiment Index, which measures buyers’ feelings about business conditions three to six months in the future, declined six points compared to our previous survey. Future Buyers Sentiment now stands at +53, down eight points from levels one month prior (Figure 2). In mid-July, our Future Sentiment Index had fallen to near a two-year low at +43, bouncing back in early August. Earlier this year we saw the highest Future Sentiment readings recorded in our 13.5-year history: late April and early May both registered +80.
Recall that when steel prices were peaking one year ago, Current Sentiment had soared to an all-time high of +84, while Future Sentiment peaked two months later at +78. The lowest levels over the past decade both occurred in April 2020, at -8 and +10 respectively.
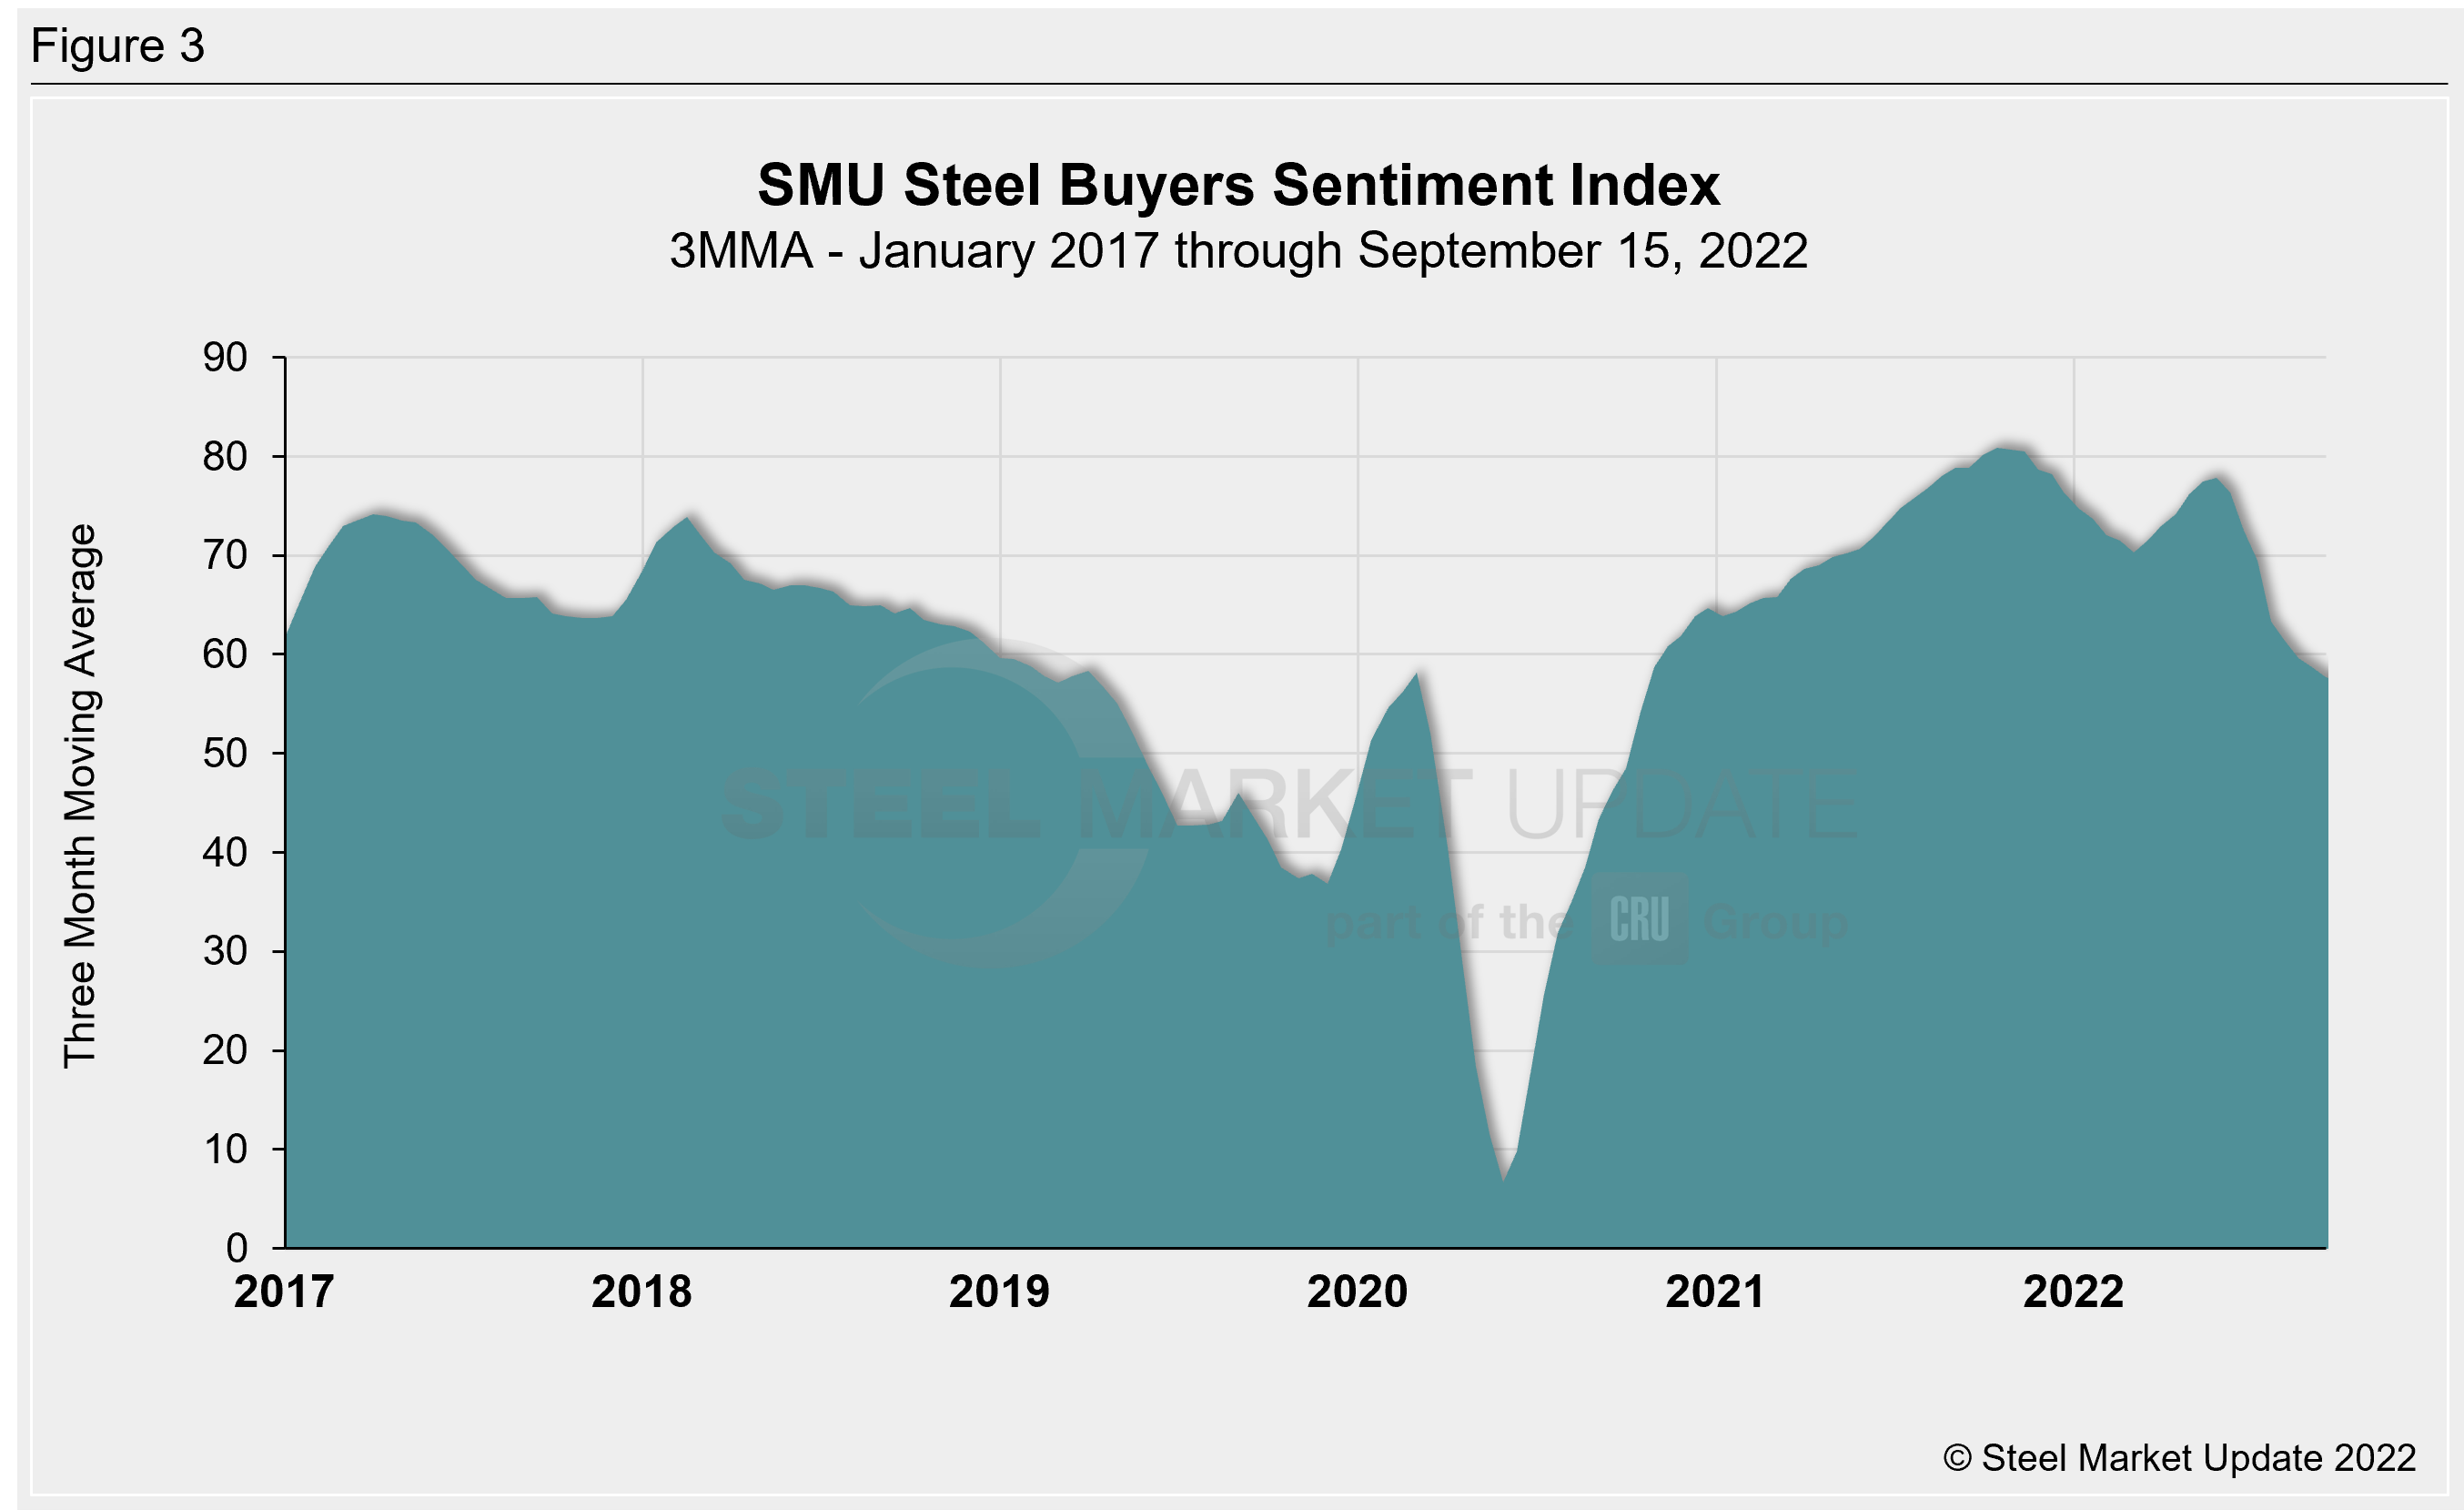
Measured as a three-month moving average, the Current Sentiment 3MMA decreased one full point to +57.67 last week, a two-point decline compared to one month earlier (Figure 3). This reading is now the lowest recorded number since mid-October 2020 when it was +54.17. A little more than three months ago, the Current Sentiment 3MMA peaked at +77.83, the highest level since December 2021.
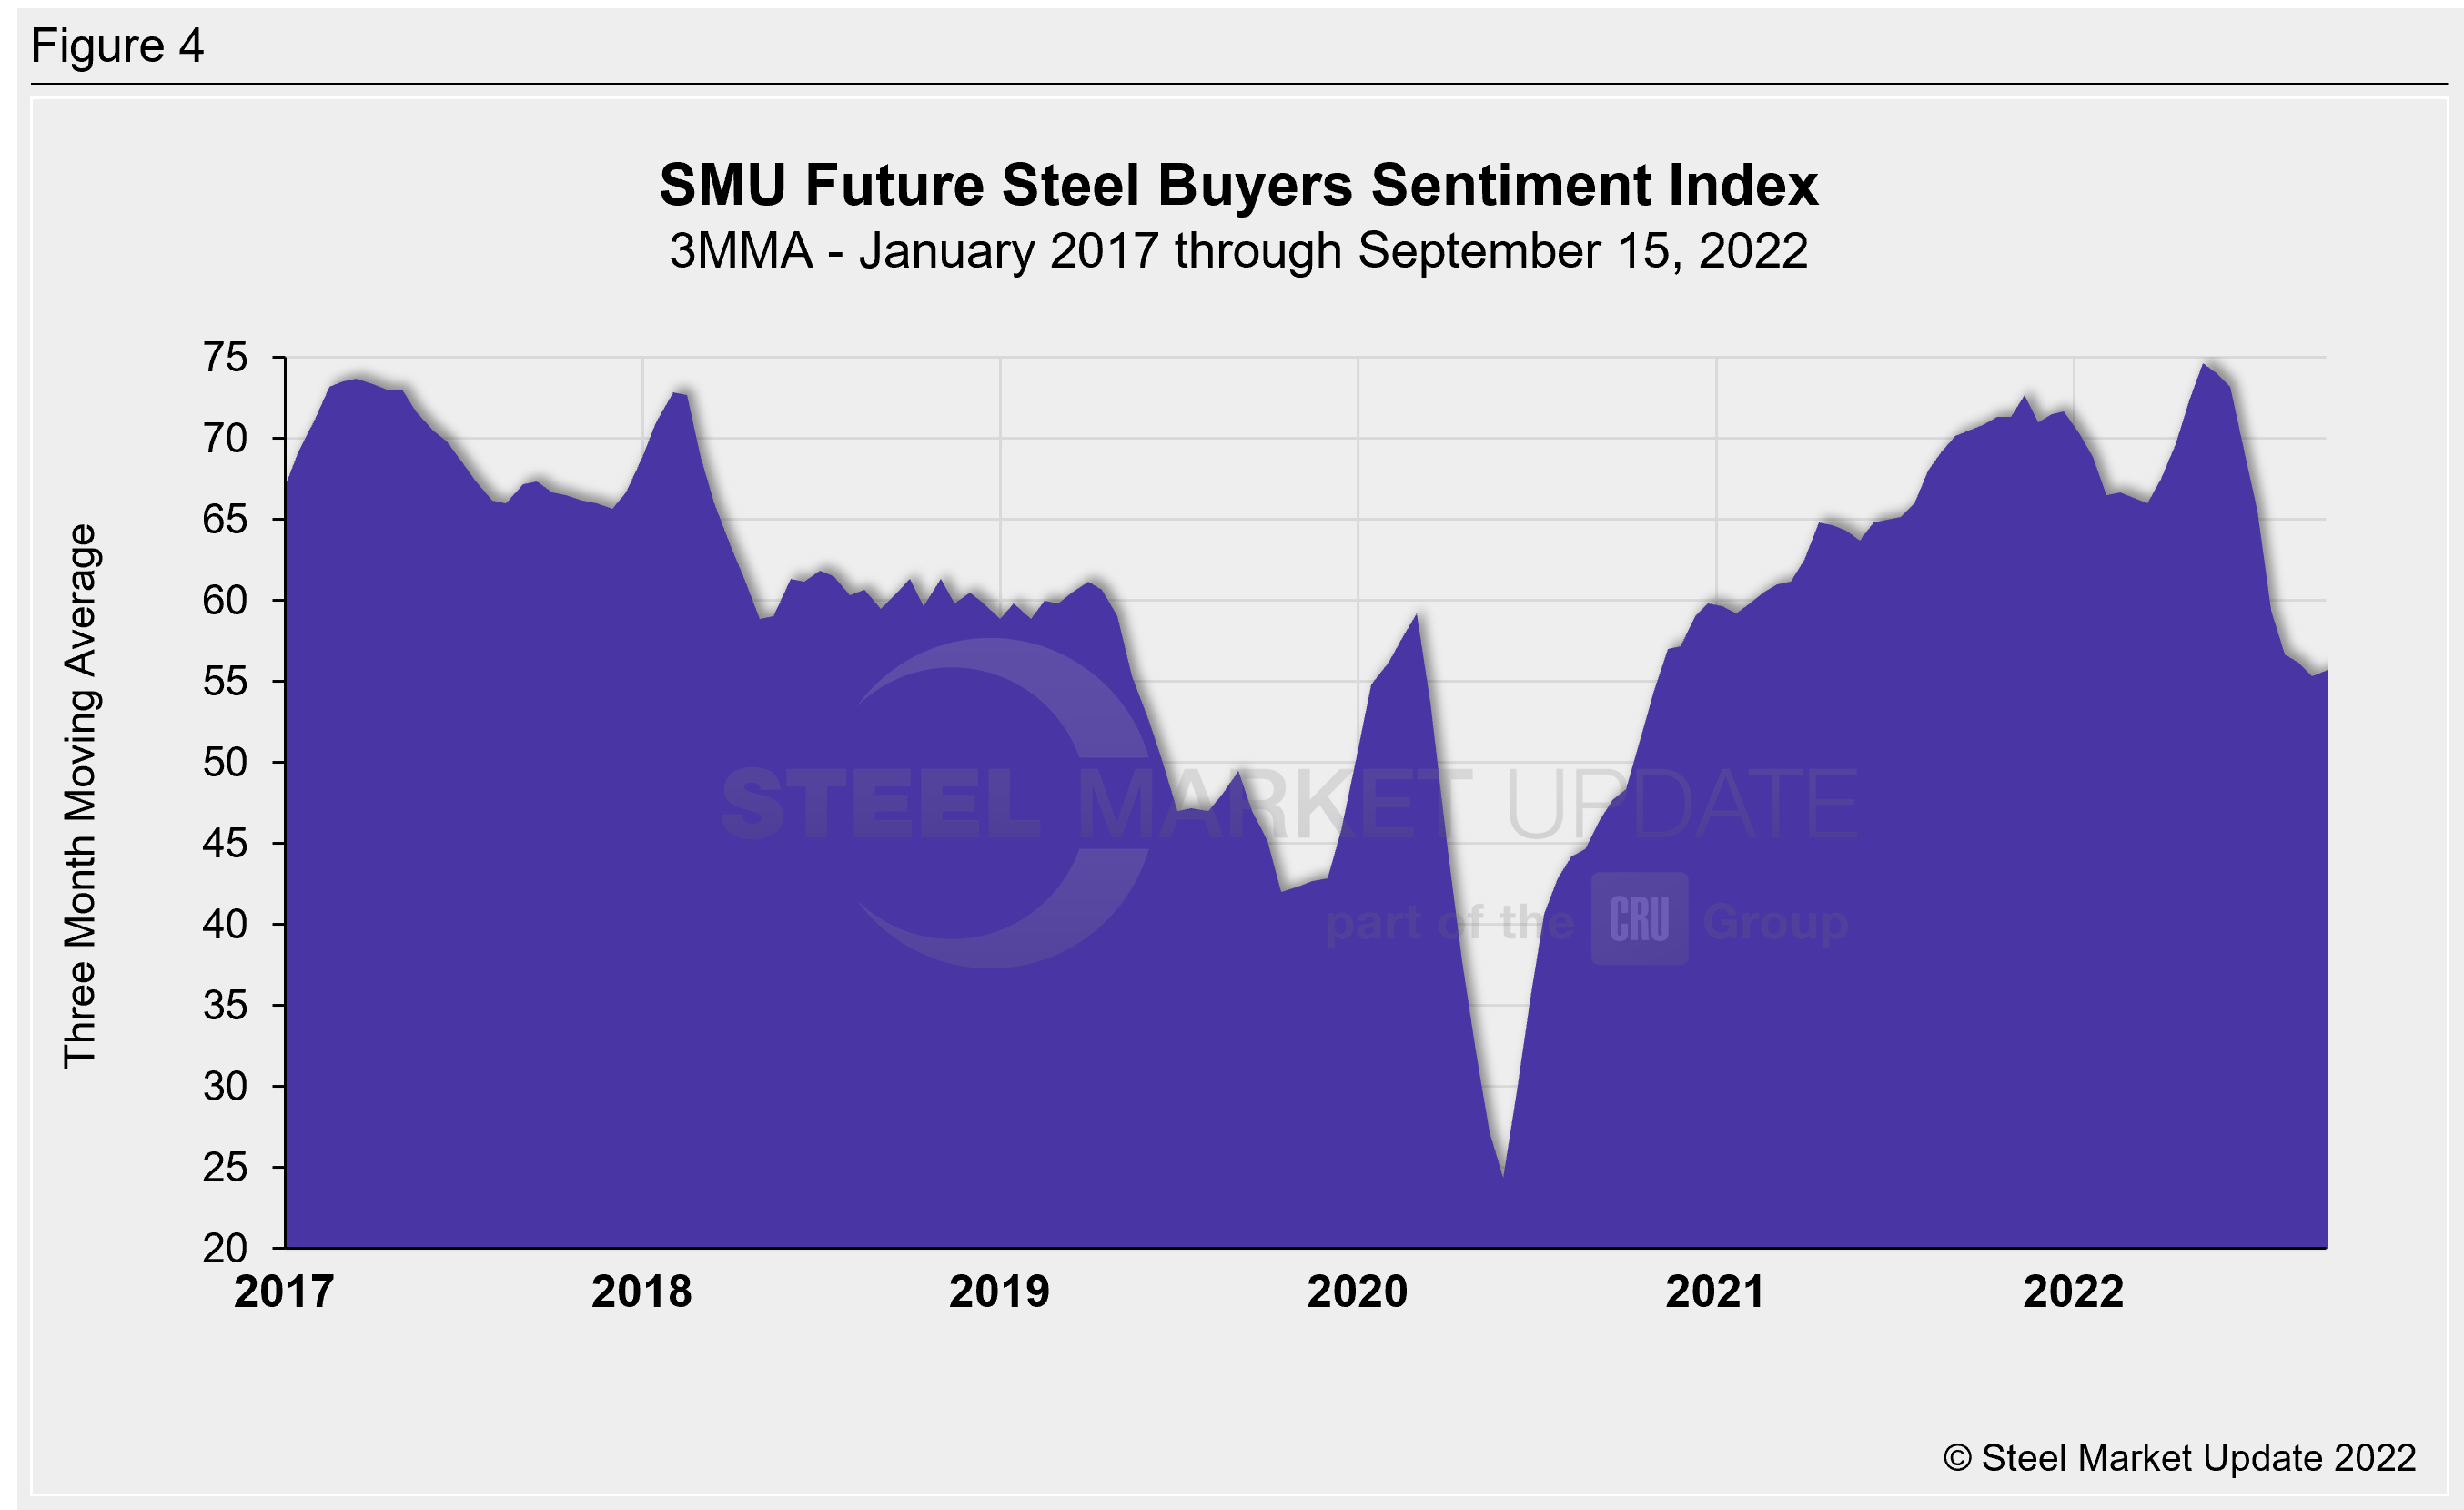
The Future Sentiment 3MMA rose one-third of a point this week to +55.67, down half a point from one month prior (Figure 4). The early September reading was the lowest seen since October 2020 when it was +54.50. Like the Current Sentiment 3MMA, the Future Sentiment 3MMA had reached a record high of +74.67 in May, surpassing the previous record of +73.67 set in March 2017.
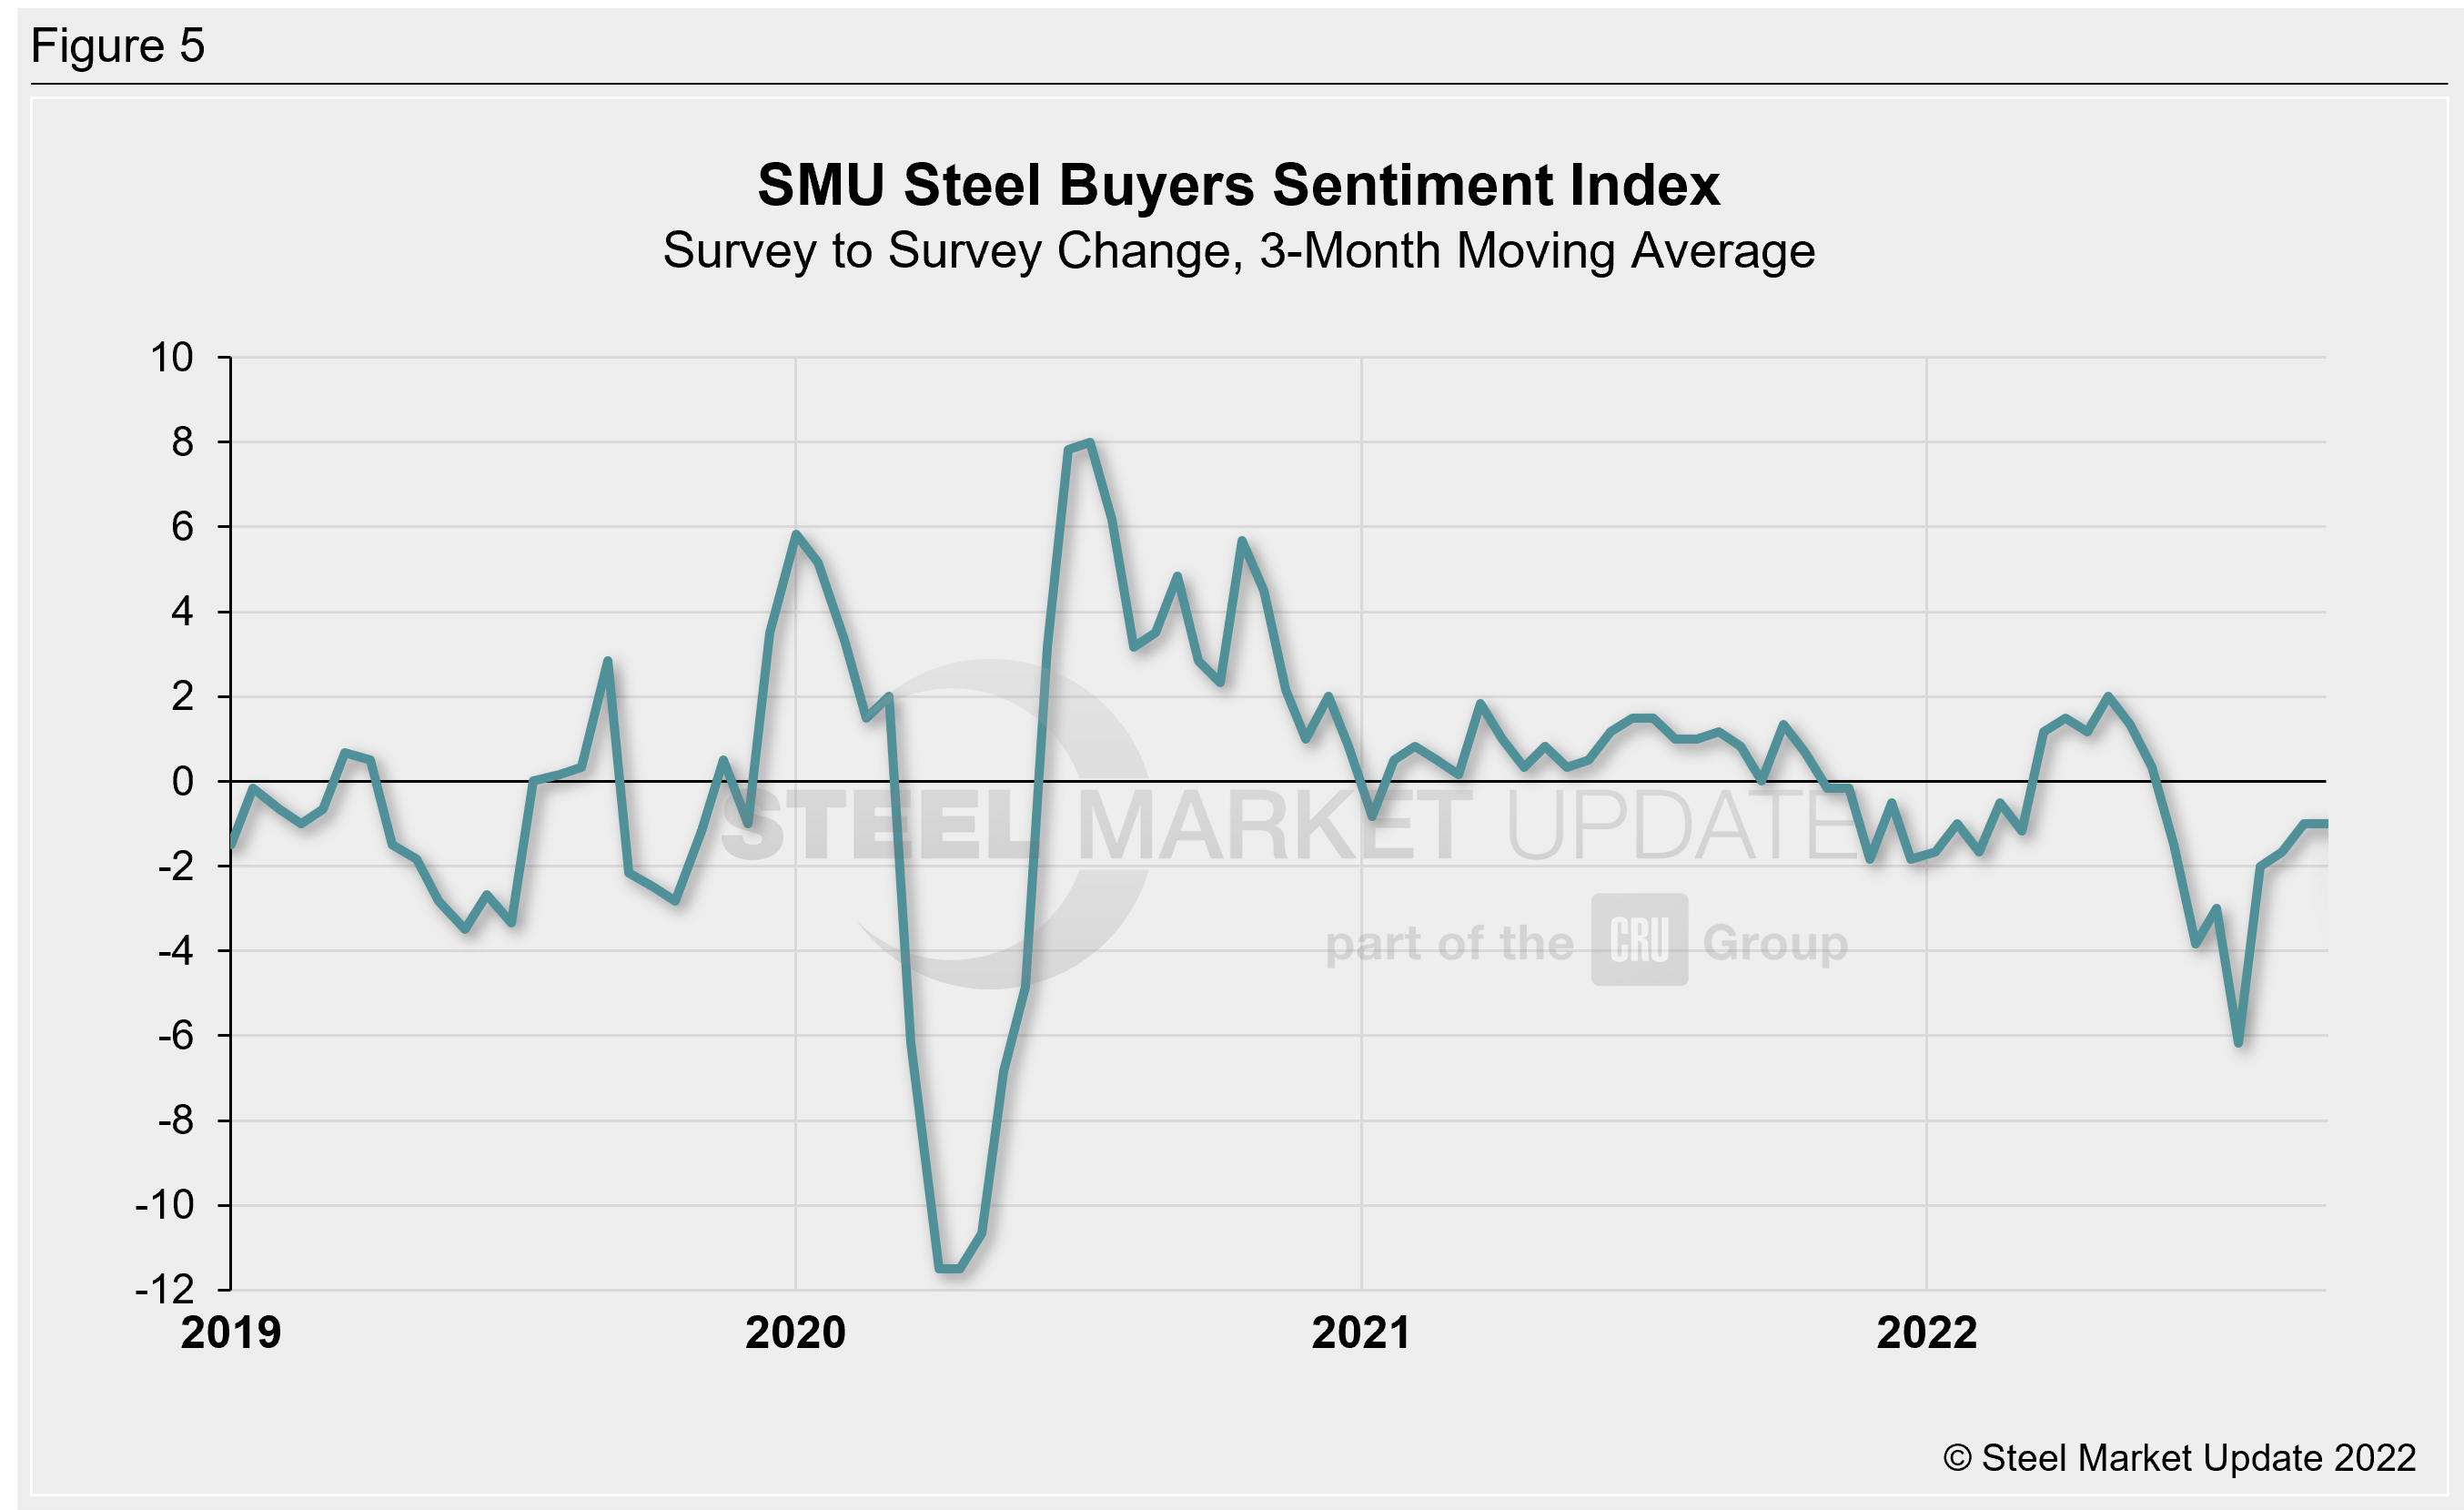
One helpful way to measure changes in Sentiment is to graph the survey-to-survey change in the Current Sentiment Index to measure the severity of Sentiment movements (Figure 5). On a 3MMA basis, the survey-to-survey change through last week is down one point compared to early September. We have seen negative growth rates since May. Two months ago, we saw a six-point decline, which was the largest change seen since April 2020. Between November 2020 and June 2022, the survey-to-survey change in our 3MMA Sentiment readings was relatively stable, never exceeding two points. In late June of this year, it began to exceed that range and did so through July.
What SMU Survey Respondents Had to Say
“Just going to take a while to work through inventory.”
“Demand holding up. Price curve flattening.”
“Demand has remained steady and customer outlook for backlog is still stable.”
“Keeping inventory in control is key in this market.”
“Profits will be slim with high cost inventory.”
“Low inventories and prices rising. Apparent demand will be stronger.”
“Softening demand, inflationary pressures.”
“This market appears ready to jump. Customers will soon leap into a buying mode to try and avoid increases and potentially longer lead times.”
“Demand is still softer than normal. A lot of inventory is out there at higher costs.”
About the SMU Steel Buyers Sentiment Index
SMU Steel Buyers Sentiment Index is a measurement of the current attitude of buyers and sellers of flat-rolled steel products in North America regarding how they feel about their company’s opportunity for success in today’s market. It is a proprietary product developed by Steel Market Update for the North American steel industry. Tracking steel buyers’ sentiment is helpful in predicting their future behavior.
Positive readings run from +10 to +100. A positive reading means the meter on the right-hand side of our home page will fall in the green area indicating optimistic sentiment. Negative readings run from -10 to -100. They result in the meter on our homepage trending into the red, indicating pessimistic sentiment. A reading of “0” (+/- 10) indicates a neutral sentiment (or slightly optimistic or pessimistic), which is most likely an indicator of a shift occurring in the marketplace. Sentiment is measured via Steel Market Update surveys that are conducted twice per month. We display the meter on our home page.
We send invitations to participate in our survey to more than 700 North American companies. Approximately 45% of respondents are service centers/distributors, 30% are manufacturers, and the remainder are steel mills, trading companies or toll processors involved in the steel business.
Click here to view an interactive graphic of the SMU Steel Buyers Sentiment Index or the SMU Future Steel Buyers Sentiment Index.
By Brett Linton, Brett@SteelMarketUpdate.com


