

Market Data

September 29, 2022
Steel Mill Lead Times Shrink Through September
Written by Brett Linton
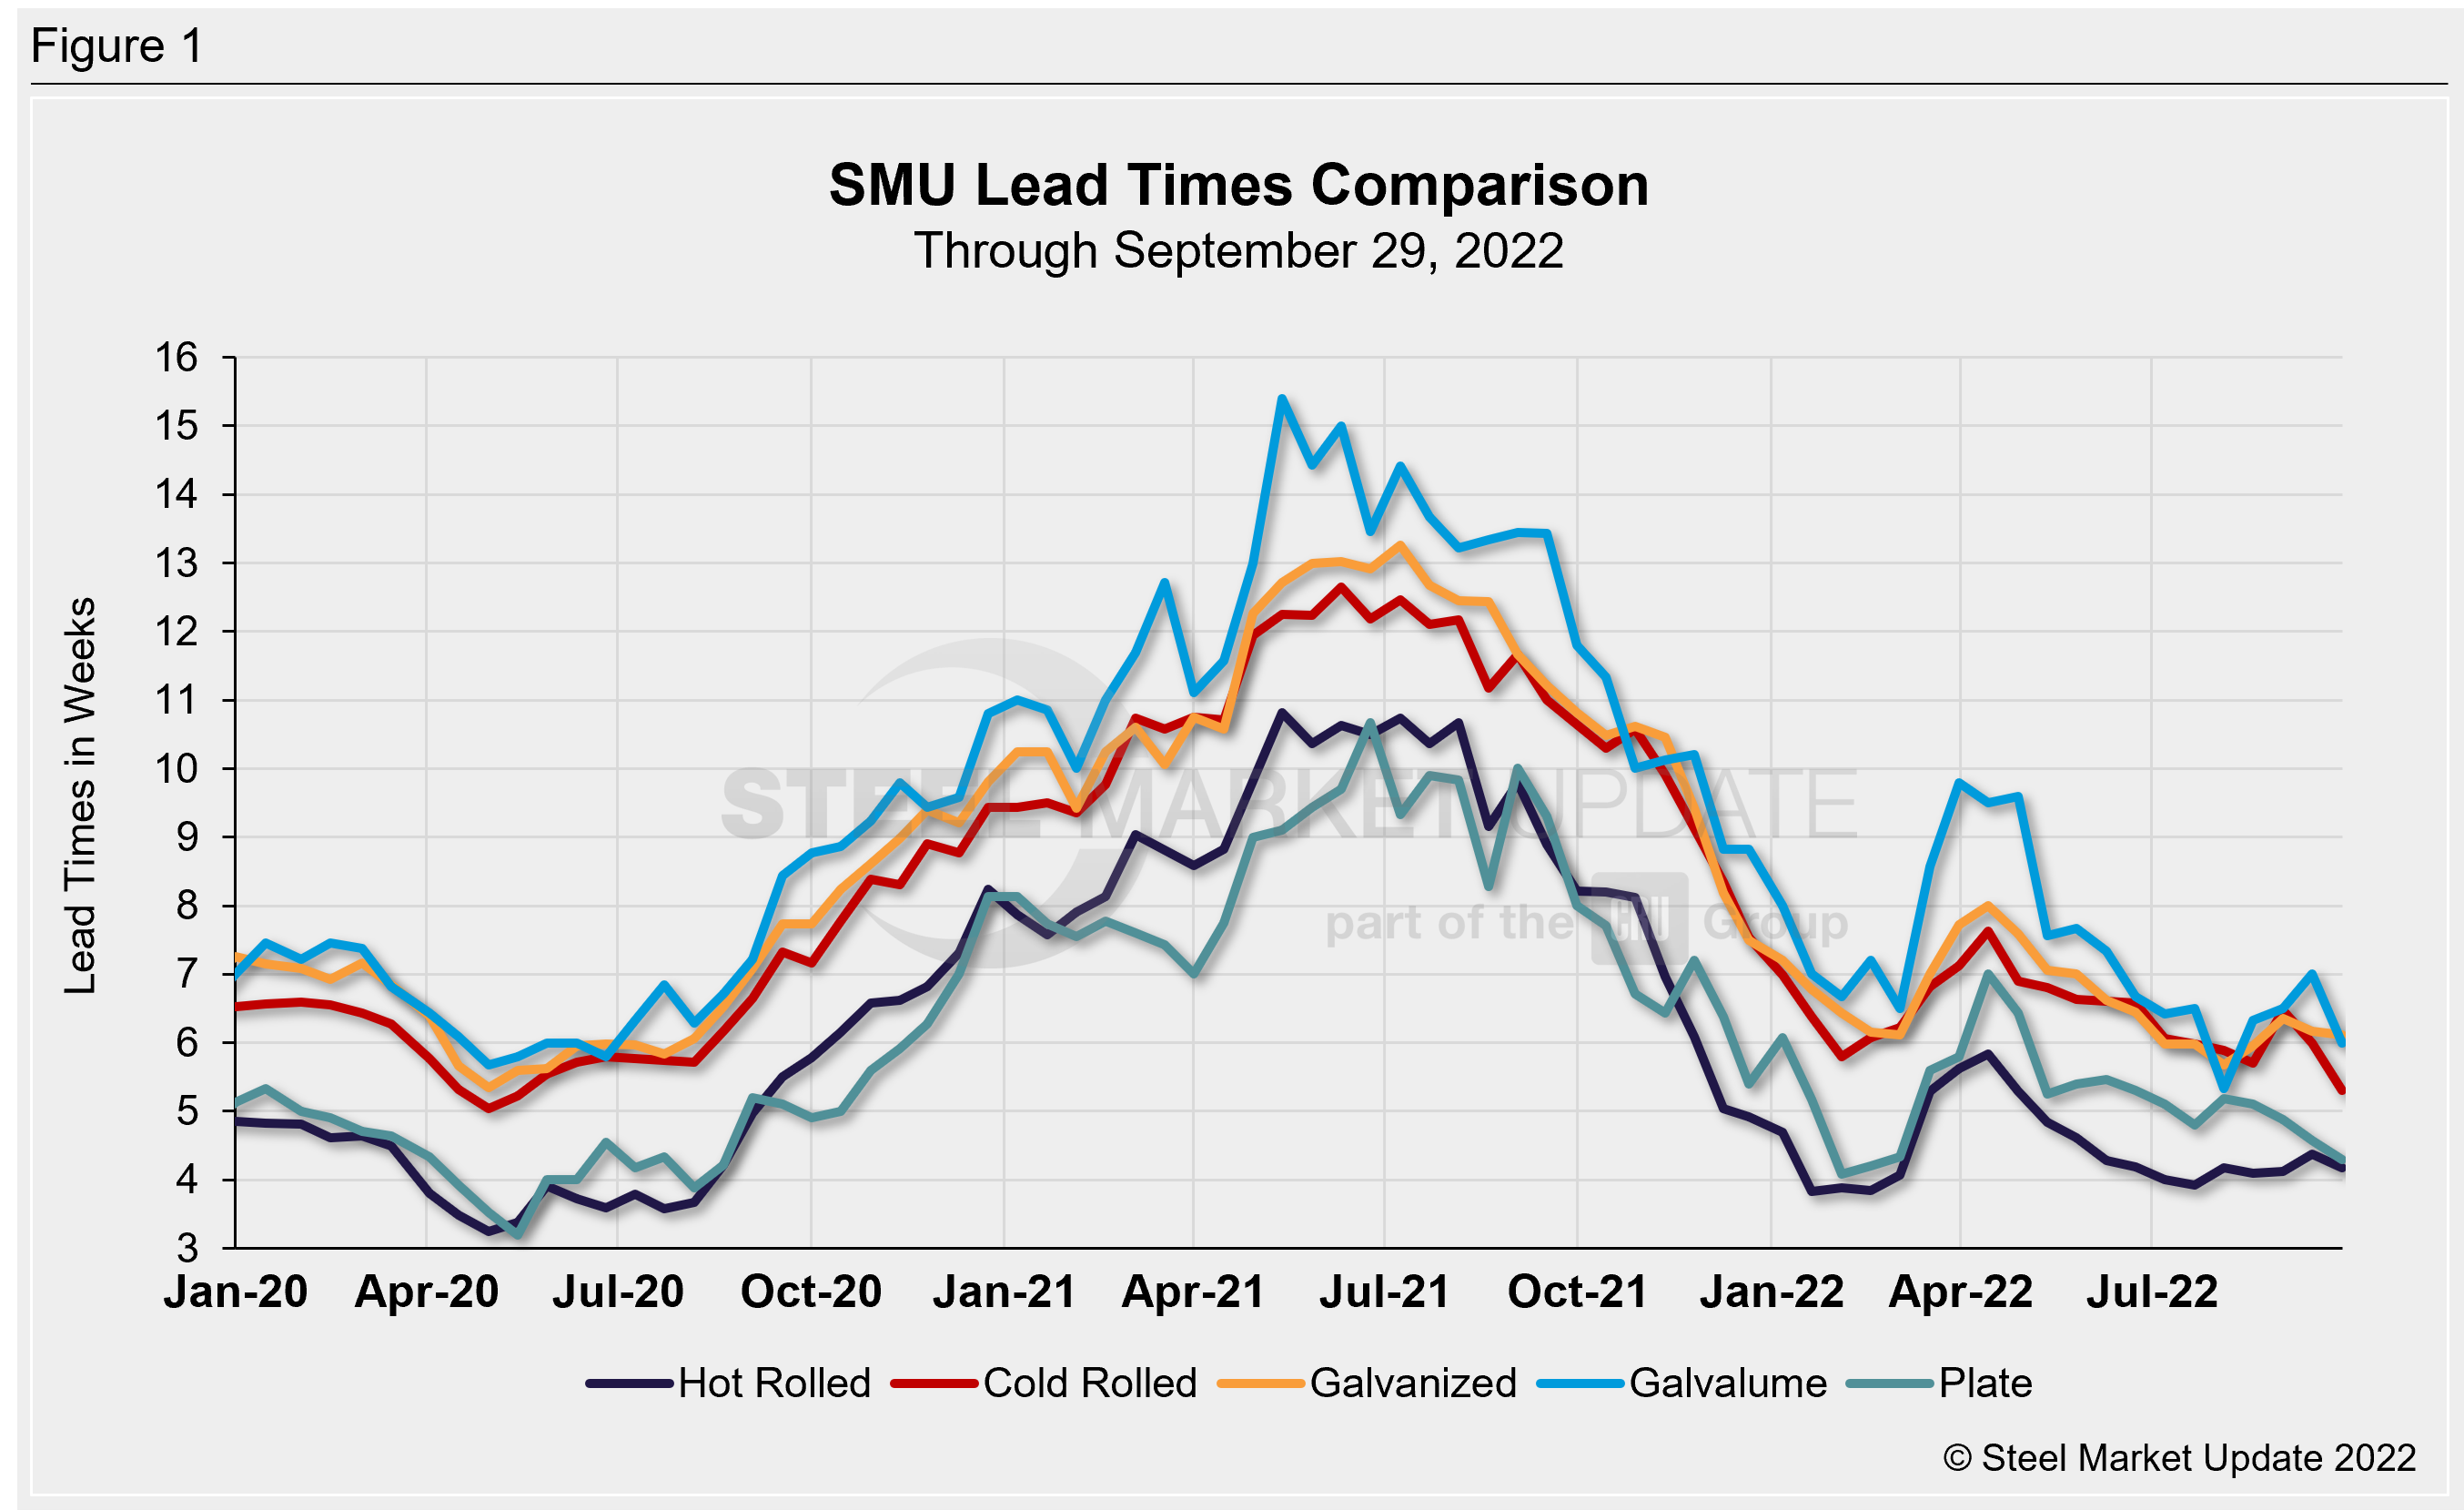
Steel mill lead times shrunk across the board this week, with the processing time narrowing for all five products we track. SMU’s latest lead times analysis shows that production times on hot rolled, galvanized, and plate products declined 0.1–0.3 weeks compared to our previous check on the market, while cold rolled and Galvalume lead times fell between 0.7–1.0 weeks.
On average, lead times shortened by 0.4 weeks compared to both two weeks prior and one month ago. Having gradually declined from a peak in April, lead times continue to remain in line with early 2022 levels.
Surveyed buyers reported mill lead times ranging from 3–5 weeks for hot rolled, 4–6 weeks for cold rolled, 5–7 weeks for galvanized, 4–7 weeks for Galvalume, and 3–6 weeks for plate.
SMU’s hot rolled lead time fell 0.2 weeks compared to two weeks ago, now standing at 4.2 weeks. One month ago HR lead times were at 4.1 weeks. Recall that the lowest level this year was 3.8 weeks seen in January and in February. The record low in our ~11-year data history was 2.8 weeks in October 2016.
Cold rolled lead times shrunk by 0.7 weeks to 5.3 weeks, now at the lowest level recorded since May. One month ago, cold rolled lead times were at 6.5 weeks. Galvanized lead times slightly declined, sliding 0.1 weeks to 6.1 weeks (our record low was 4.8 weeks in February 2015). The average Galvalume lead time fell by one full week to 6.0 weeks. Note that Galvalume figures can be more volatile due to the limited size of that market and our smaller sample size. One month ago, Galvalume lead times were at 6.5 weeks.
Plate lead times eased 0.3 weeks to 4.3 weeks, now at the lowest level seen since February (4.1 weeks). Other than February, the last time plate lead times were this low was August 2020. In our four-year history of plate lead times, the lowest figure we have recorded was 3.2 weeks in May 2020.
Looking down the road, 80% of the executives responding to this week’s questionnaire told SMU they believe lead times will be relatively flat two months from now. 16% reported lead times would be extending at that point, and 4% said lead times would be contracting. Here is what a few of our respondents had to say:
“There is still too much capacity at the mill level. Outages and idlings are nice, but they aren’t enough to drastically move the needle.”
“Buyers will restock, but with caution giving cloudy demand picture.”
“Lead times will slide for another month or so then start to extend.”
“Things won’t appreciably improve until Q2 2023.”
“Flat to slightly extended, anticipate extensions to occur late December for first quarter.”
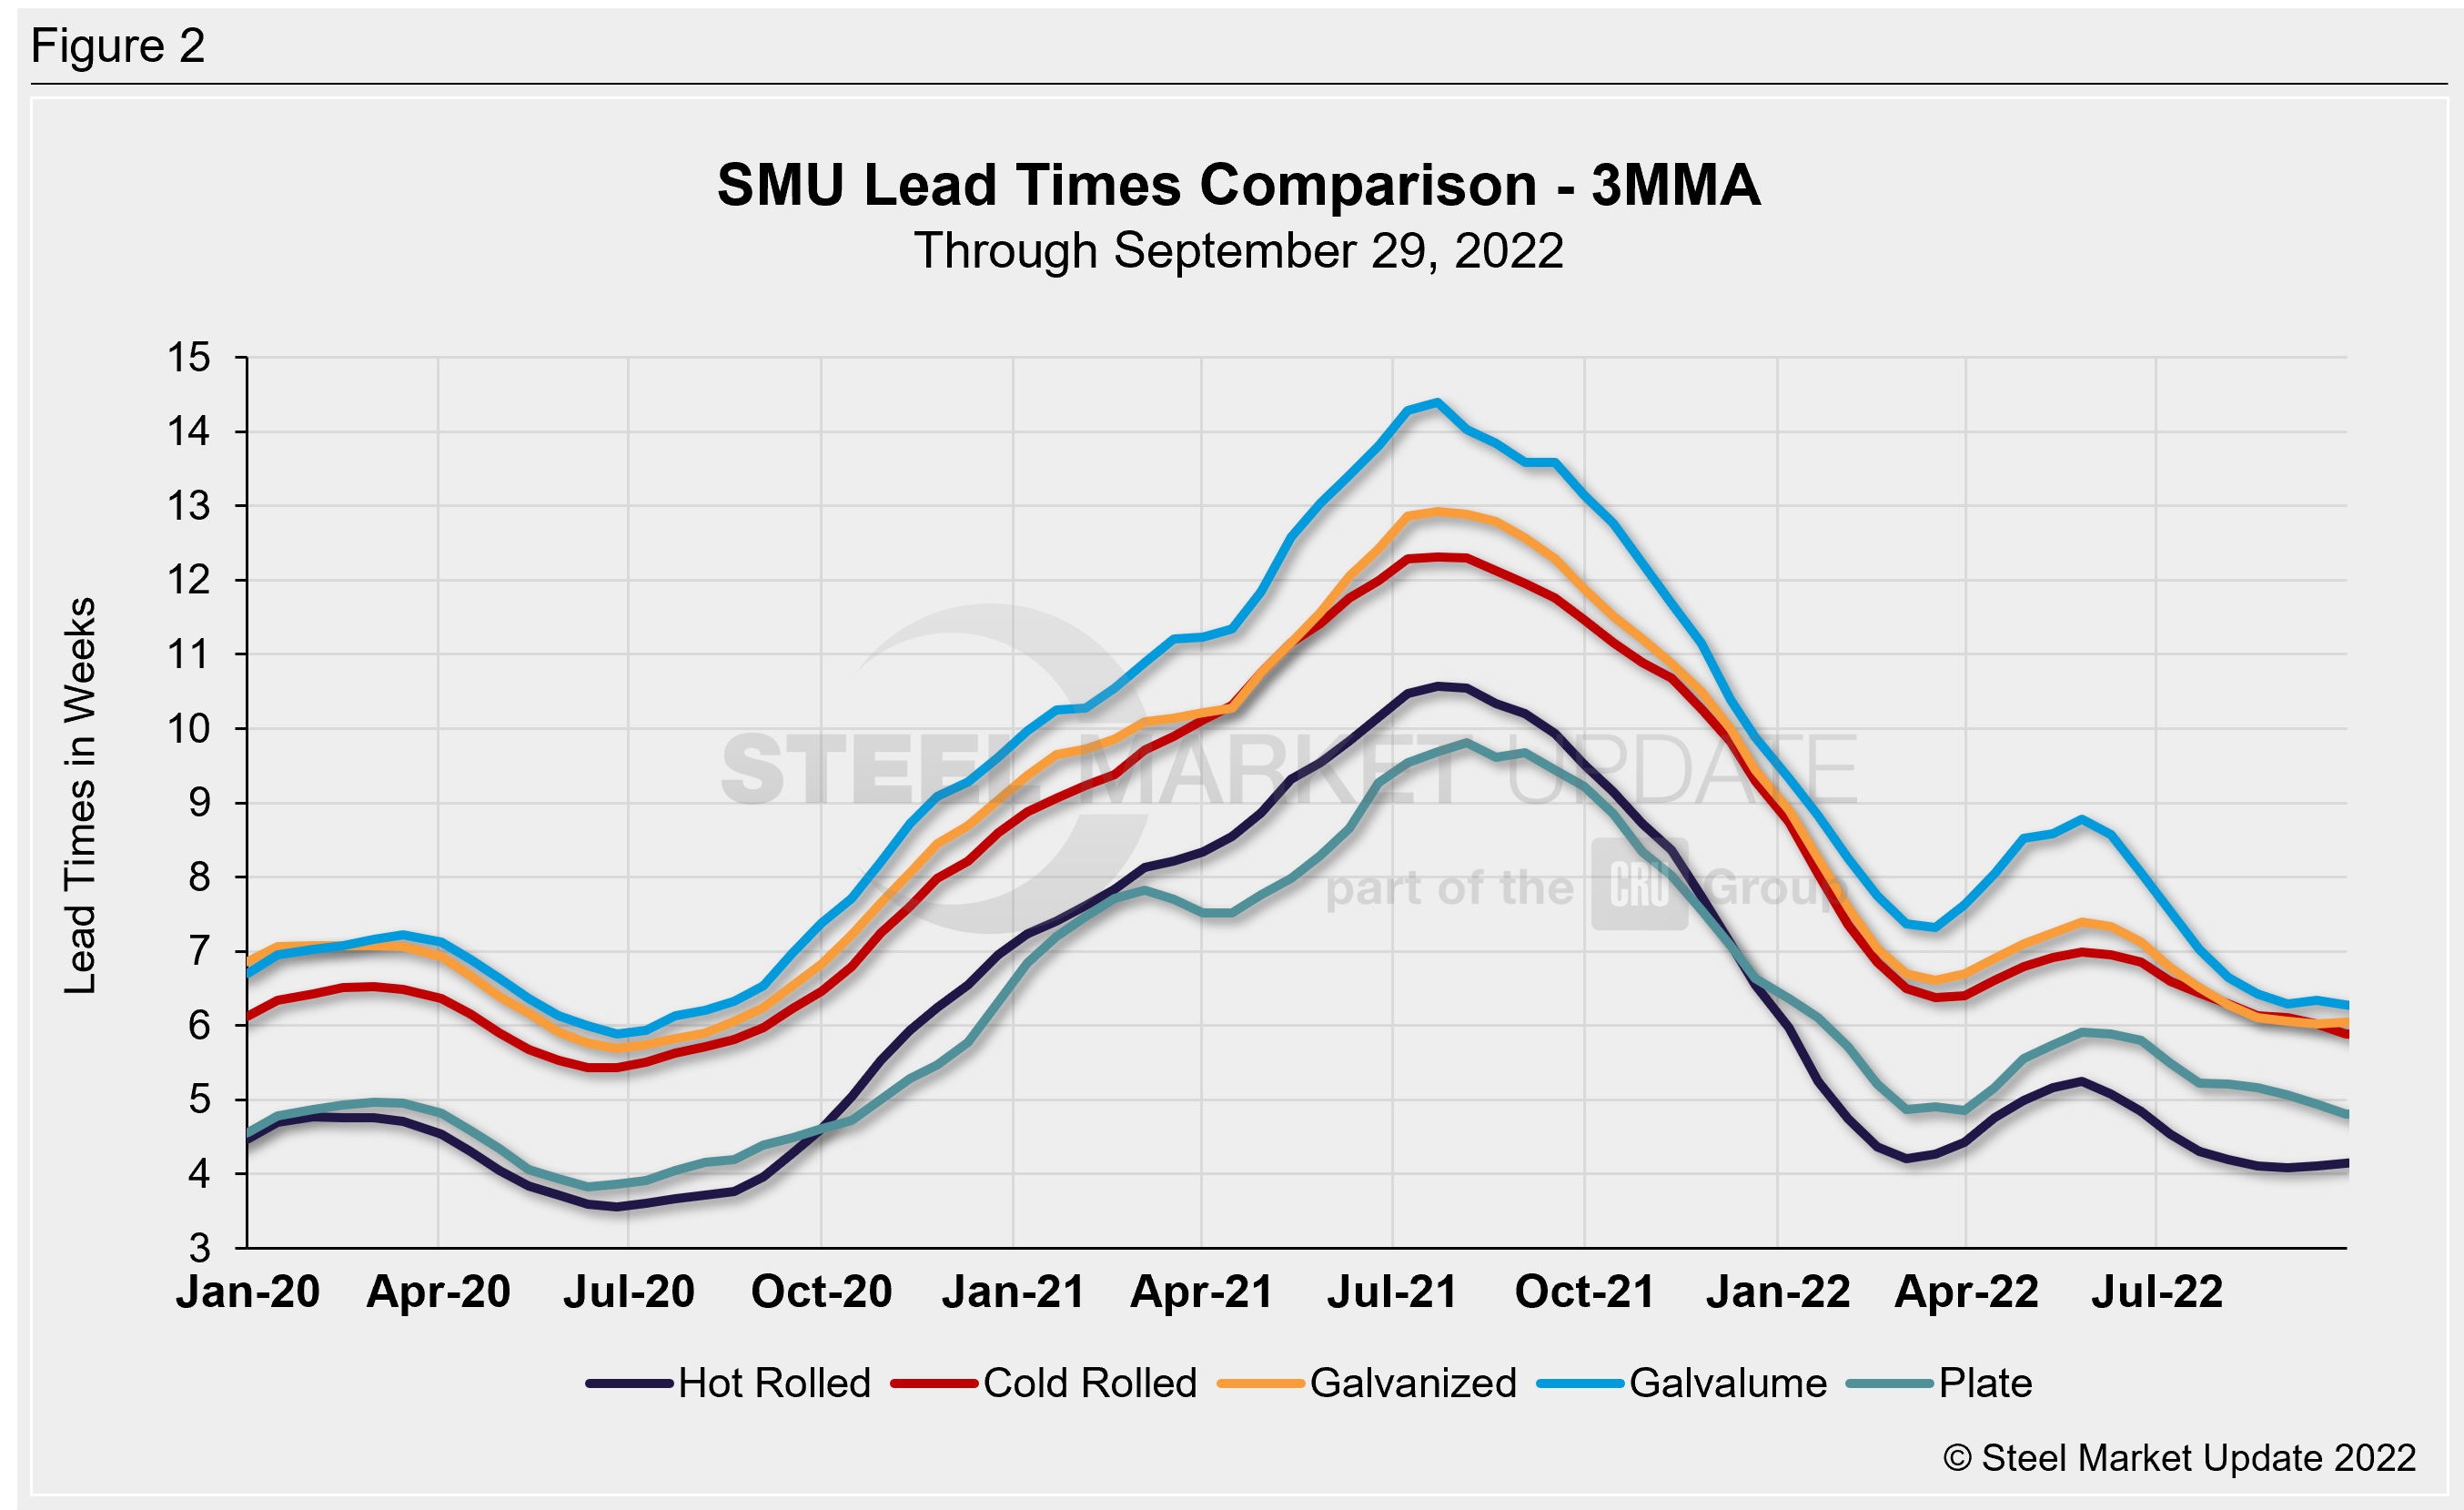
Looking at lead times on a three-month moving average (3MMA) can smooth out the variability in the biweekly readings. As a 3MMA, most products were steady compared to two weeks prior, and down overall versus May-August. The latest 3MMA lead time for hot rolled held steady at 4.1 weeks, unchanged since mid-August and one of the lowest levels recorded since the summer of 2020. Cold rolled moved lower by 0.1 weeks to 6.0 weeks, now at a two-year low. Galvanized lead times remained at 6.0 weeks, the lowest level seen since August 2020. Galvalume held steady at 6.3 weeks, while plate eased 0.1 weeks to 4.8 weeks (now the lowest since October 2020).
Note: These lead times are based on the average from manufacturers and steel service centers who participated in this week’s SMU market trends analysis. SMU measures lead times as the time it takes from when an order is placed with the mill to when the order is processed and ready for shipping, not including delivery time to the buyer. Our lead times do not predict what any individual may get from any specific mill supplier. Look to your mill rep for actual lead times. To see an interactive history of our Steel Mill Lead Times data, visit our website here.
By Brett Linton, Brett@SteelMarketUpdate.com


