

Market Data

October 14, 2022
SMU Steel Buyers Sentiment Indices Slightly Ease Through October
Written by Brett Linton
Steel Market Update’s (SMU) Steel Buyers Sentiment Indices both saw slight declines this week, following modest gains two weeks prior. Sentiment has trended downward overall since May, with buyers attributing their dismal outlooks to weakening demand, high inventory costs, and recession concerns.
SMU’s Buyers Sentiment Index measures how steel buyers and sellers feel about their company’s ability to be successful, in both today’s market as well as three to six months down the road. We poll hundreds of steel buyers every other week regarding sentiment, with historical measures going back to 2008.
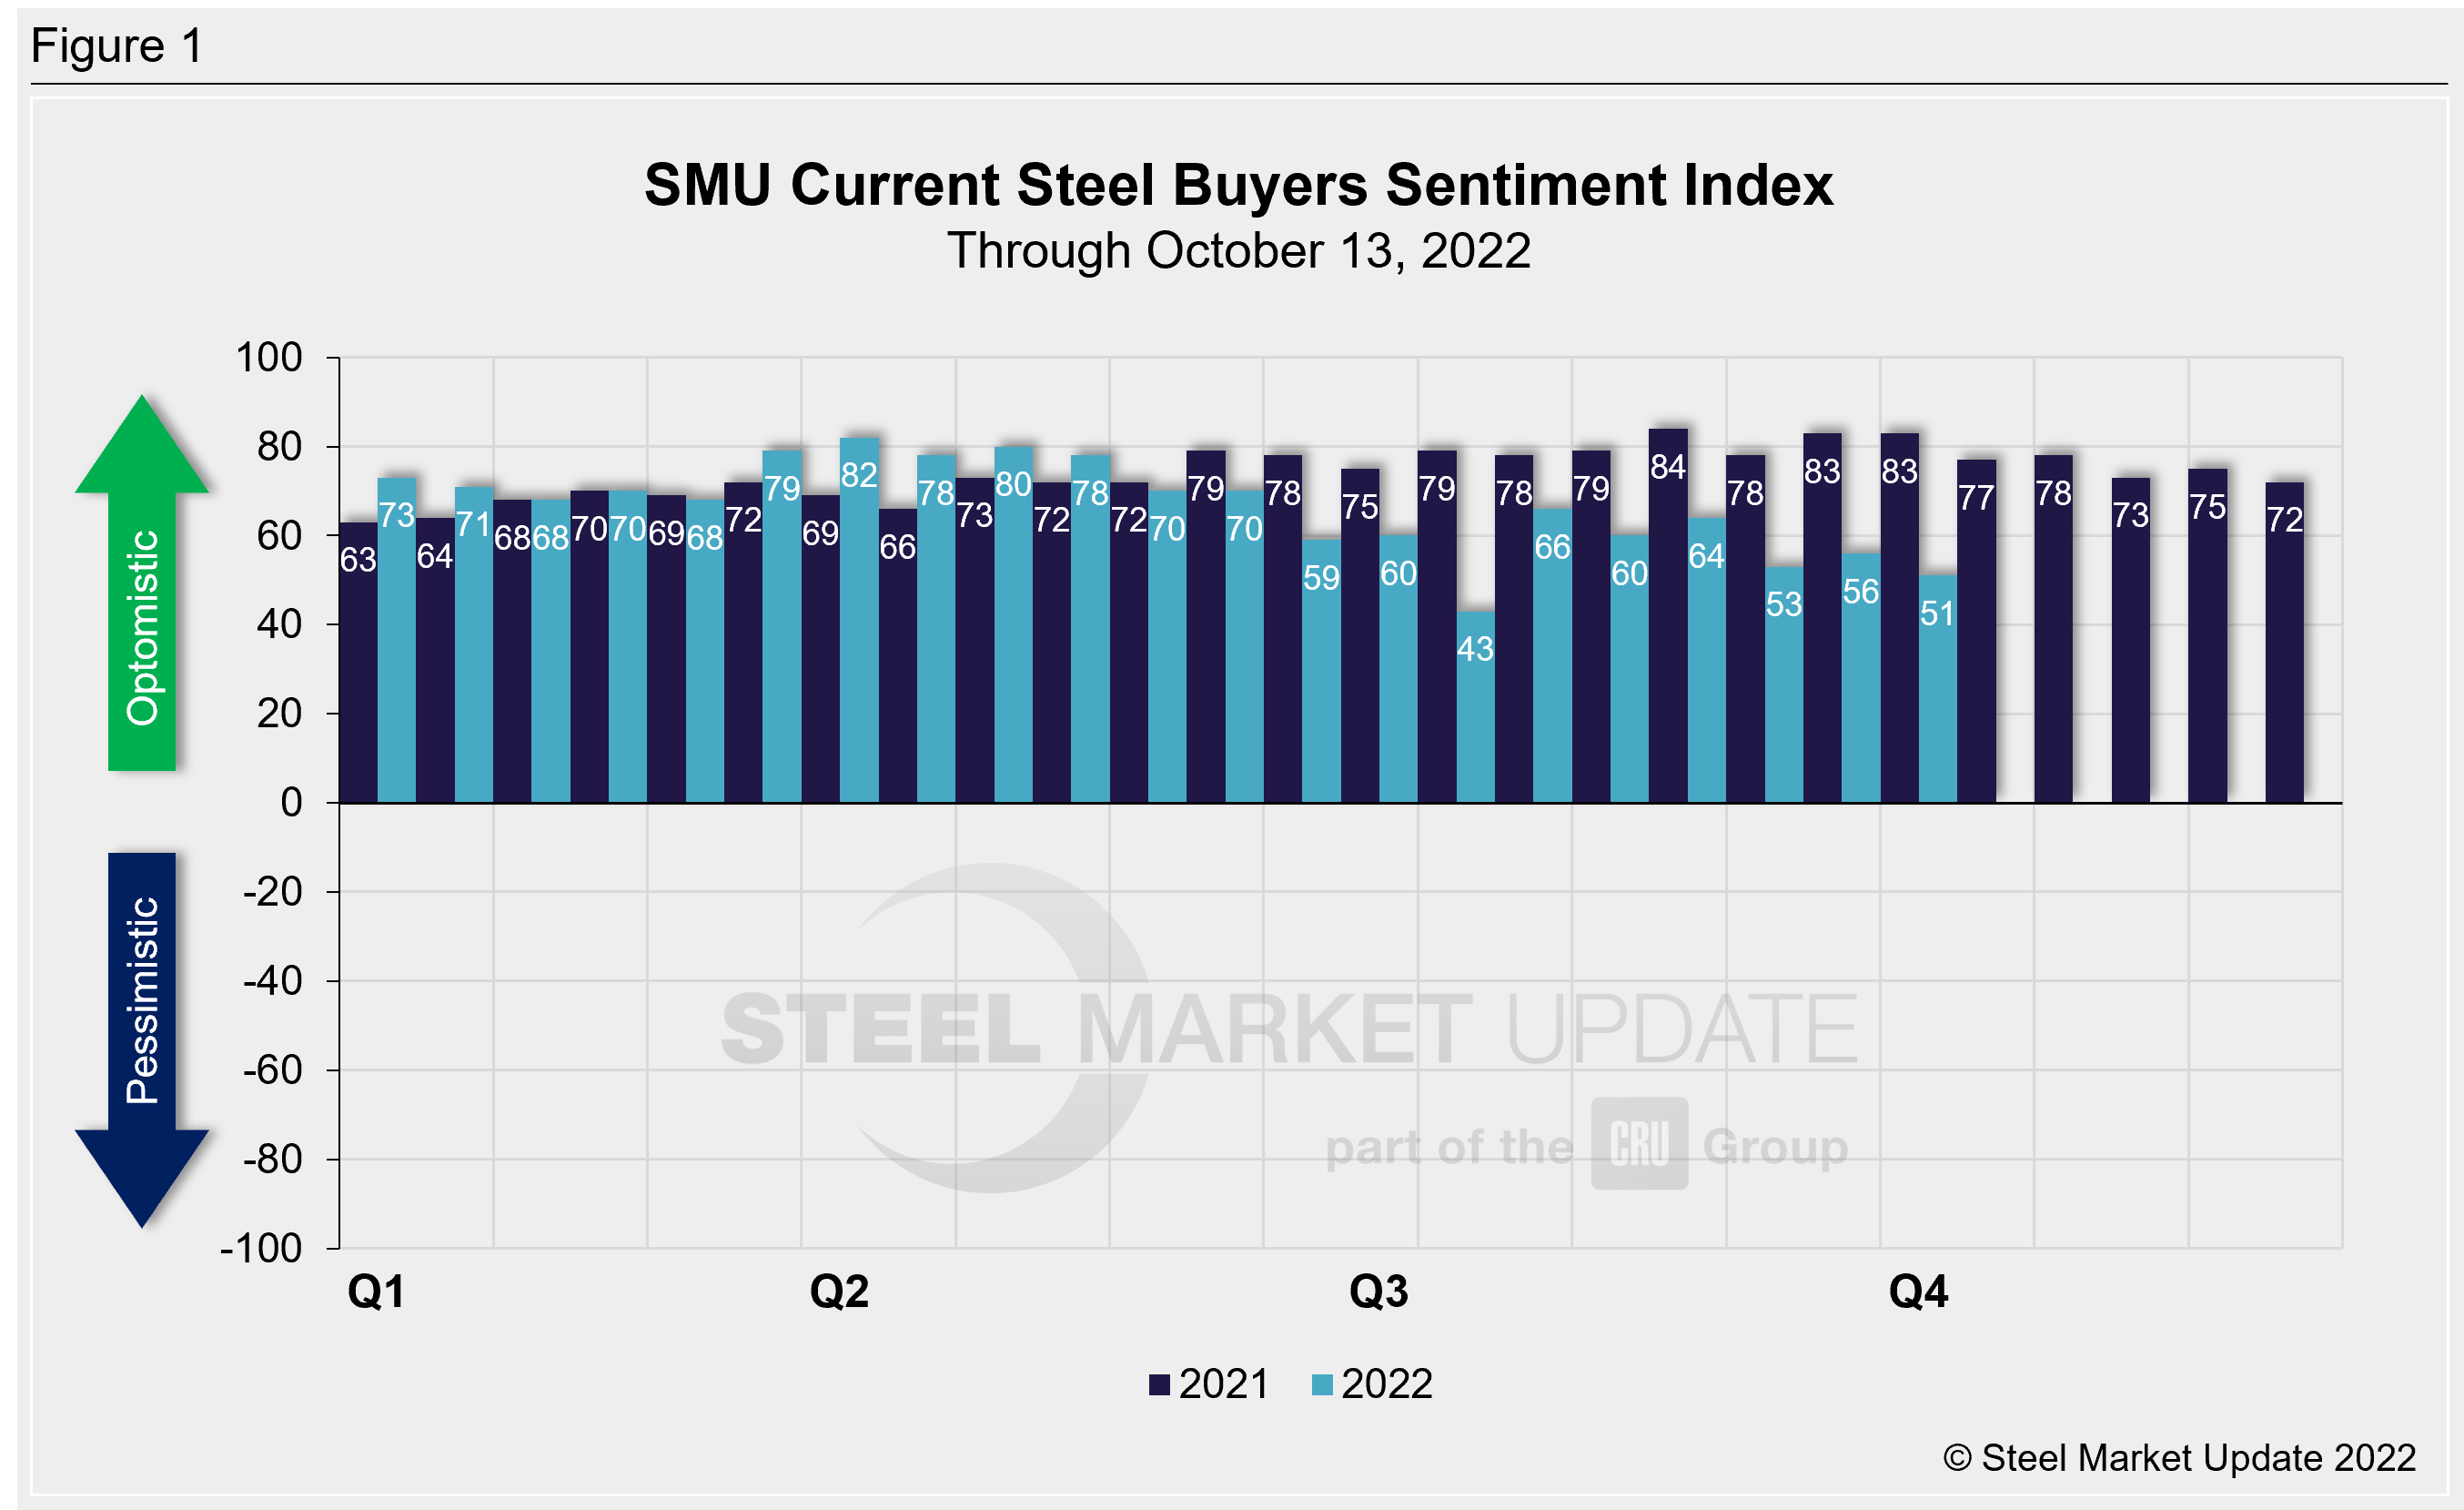
SMU’s Current Buyers Sentiment Index declined five points to +51 through Oct. 13, down two points from our market check one month ago (Figure 1). Current Buyers Sentiment has bounced around lately, ranging between +51 and +66 across the past three months. Sentiment had slipped to +43 in mid-July, the lowest level seen since August 2020, before rebounding in early August. Our Current Buyers Sentiment Index peaked at +82 in March of this year.
SMU’s Future Buyers Sentiment Index also fell compared to our previous survey, down four points to +61. Future Buyers Sentiment measures buyers’ feelings about business conditions three to six months in the future. Future sentiment is up eight points compared to levels one month prior (Figure 2). Like Current Sentiment, Future Sentiment has fluctuated between +53 and +65 in the last quarter. Back in mid-July, Future Sentiment fell to a near two-year low of +43. Earlier this year, we saw the highest Future Sentiment readings in our 13.5-year history: late April and early May both registered +80.
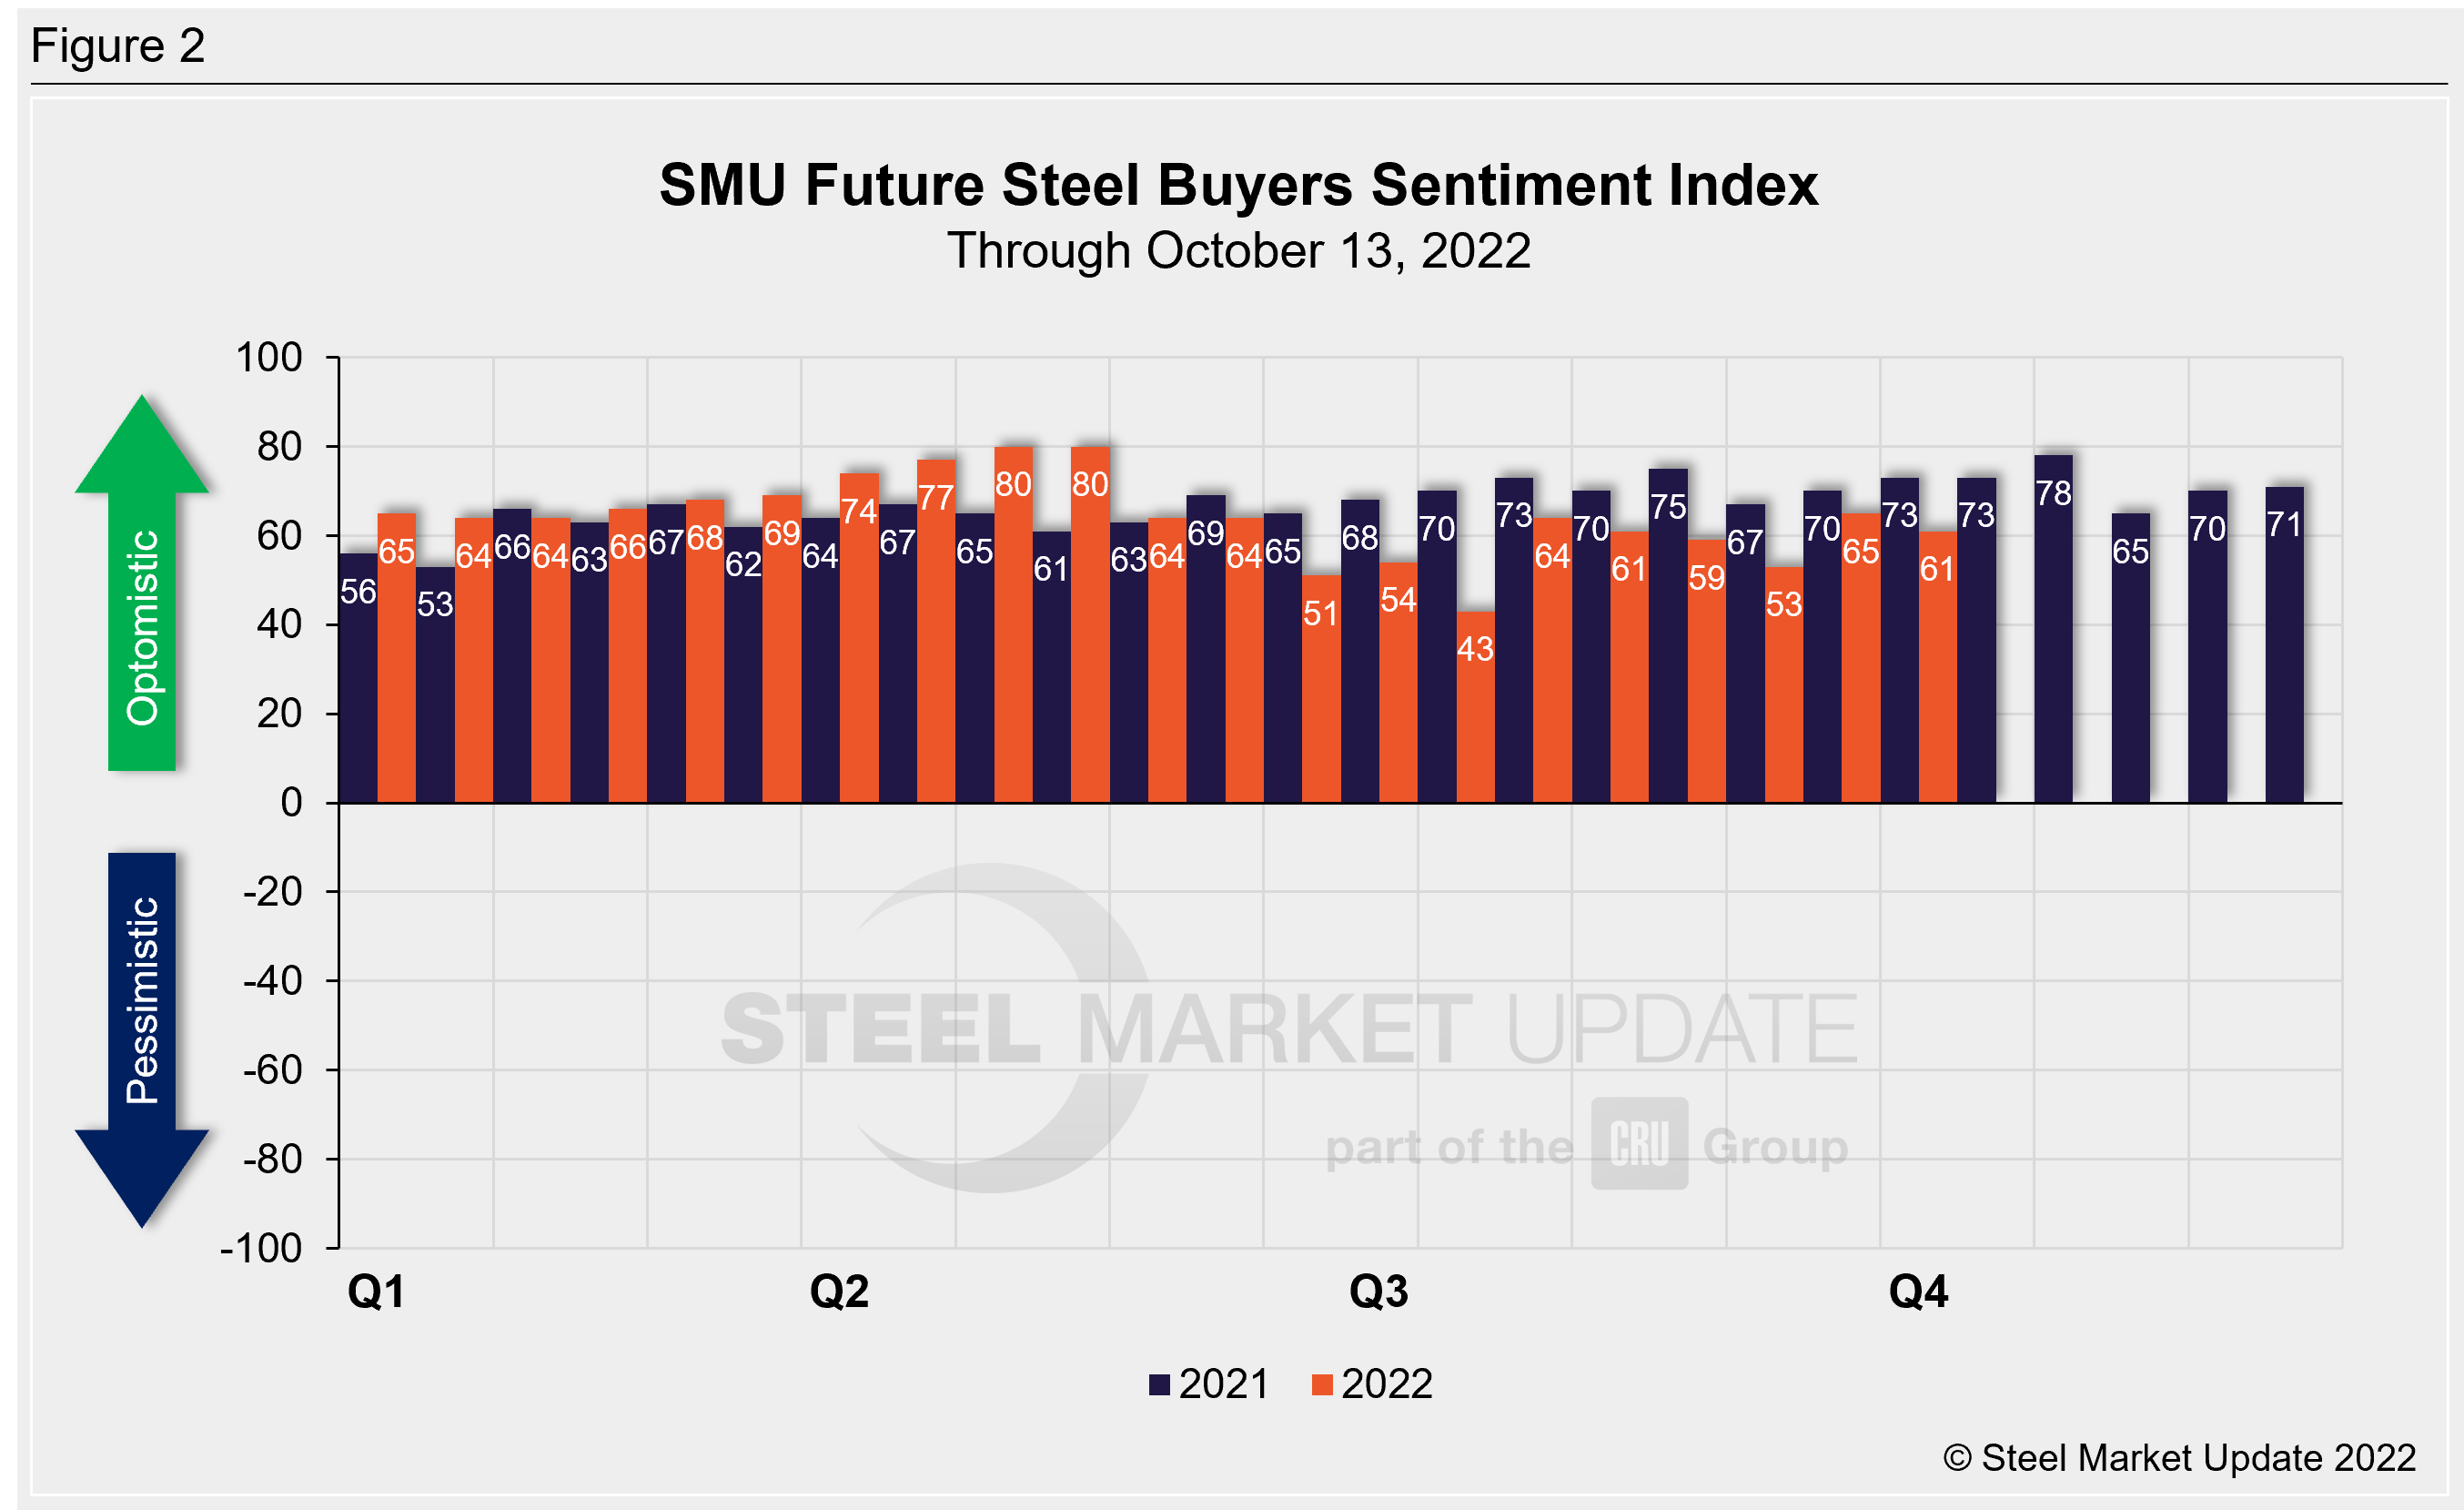
Recall that when steel prices were peaking a little over one year ago, Current Sentiment had soared to an all-time high of +84, while Future Sentiment hit a 2021 peak two months later at +78. The lowest levels over the past decade both occurred in April 2020, at -8 and +10 respectively.
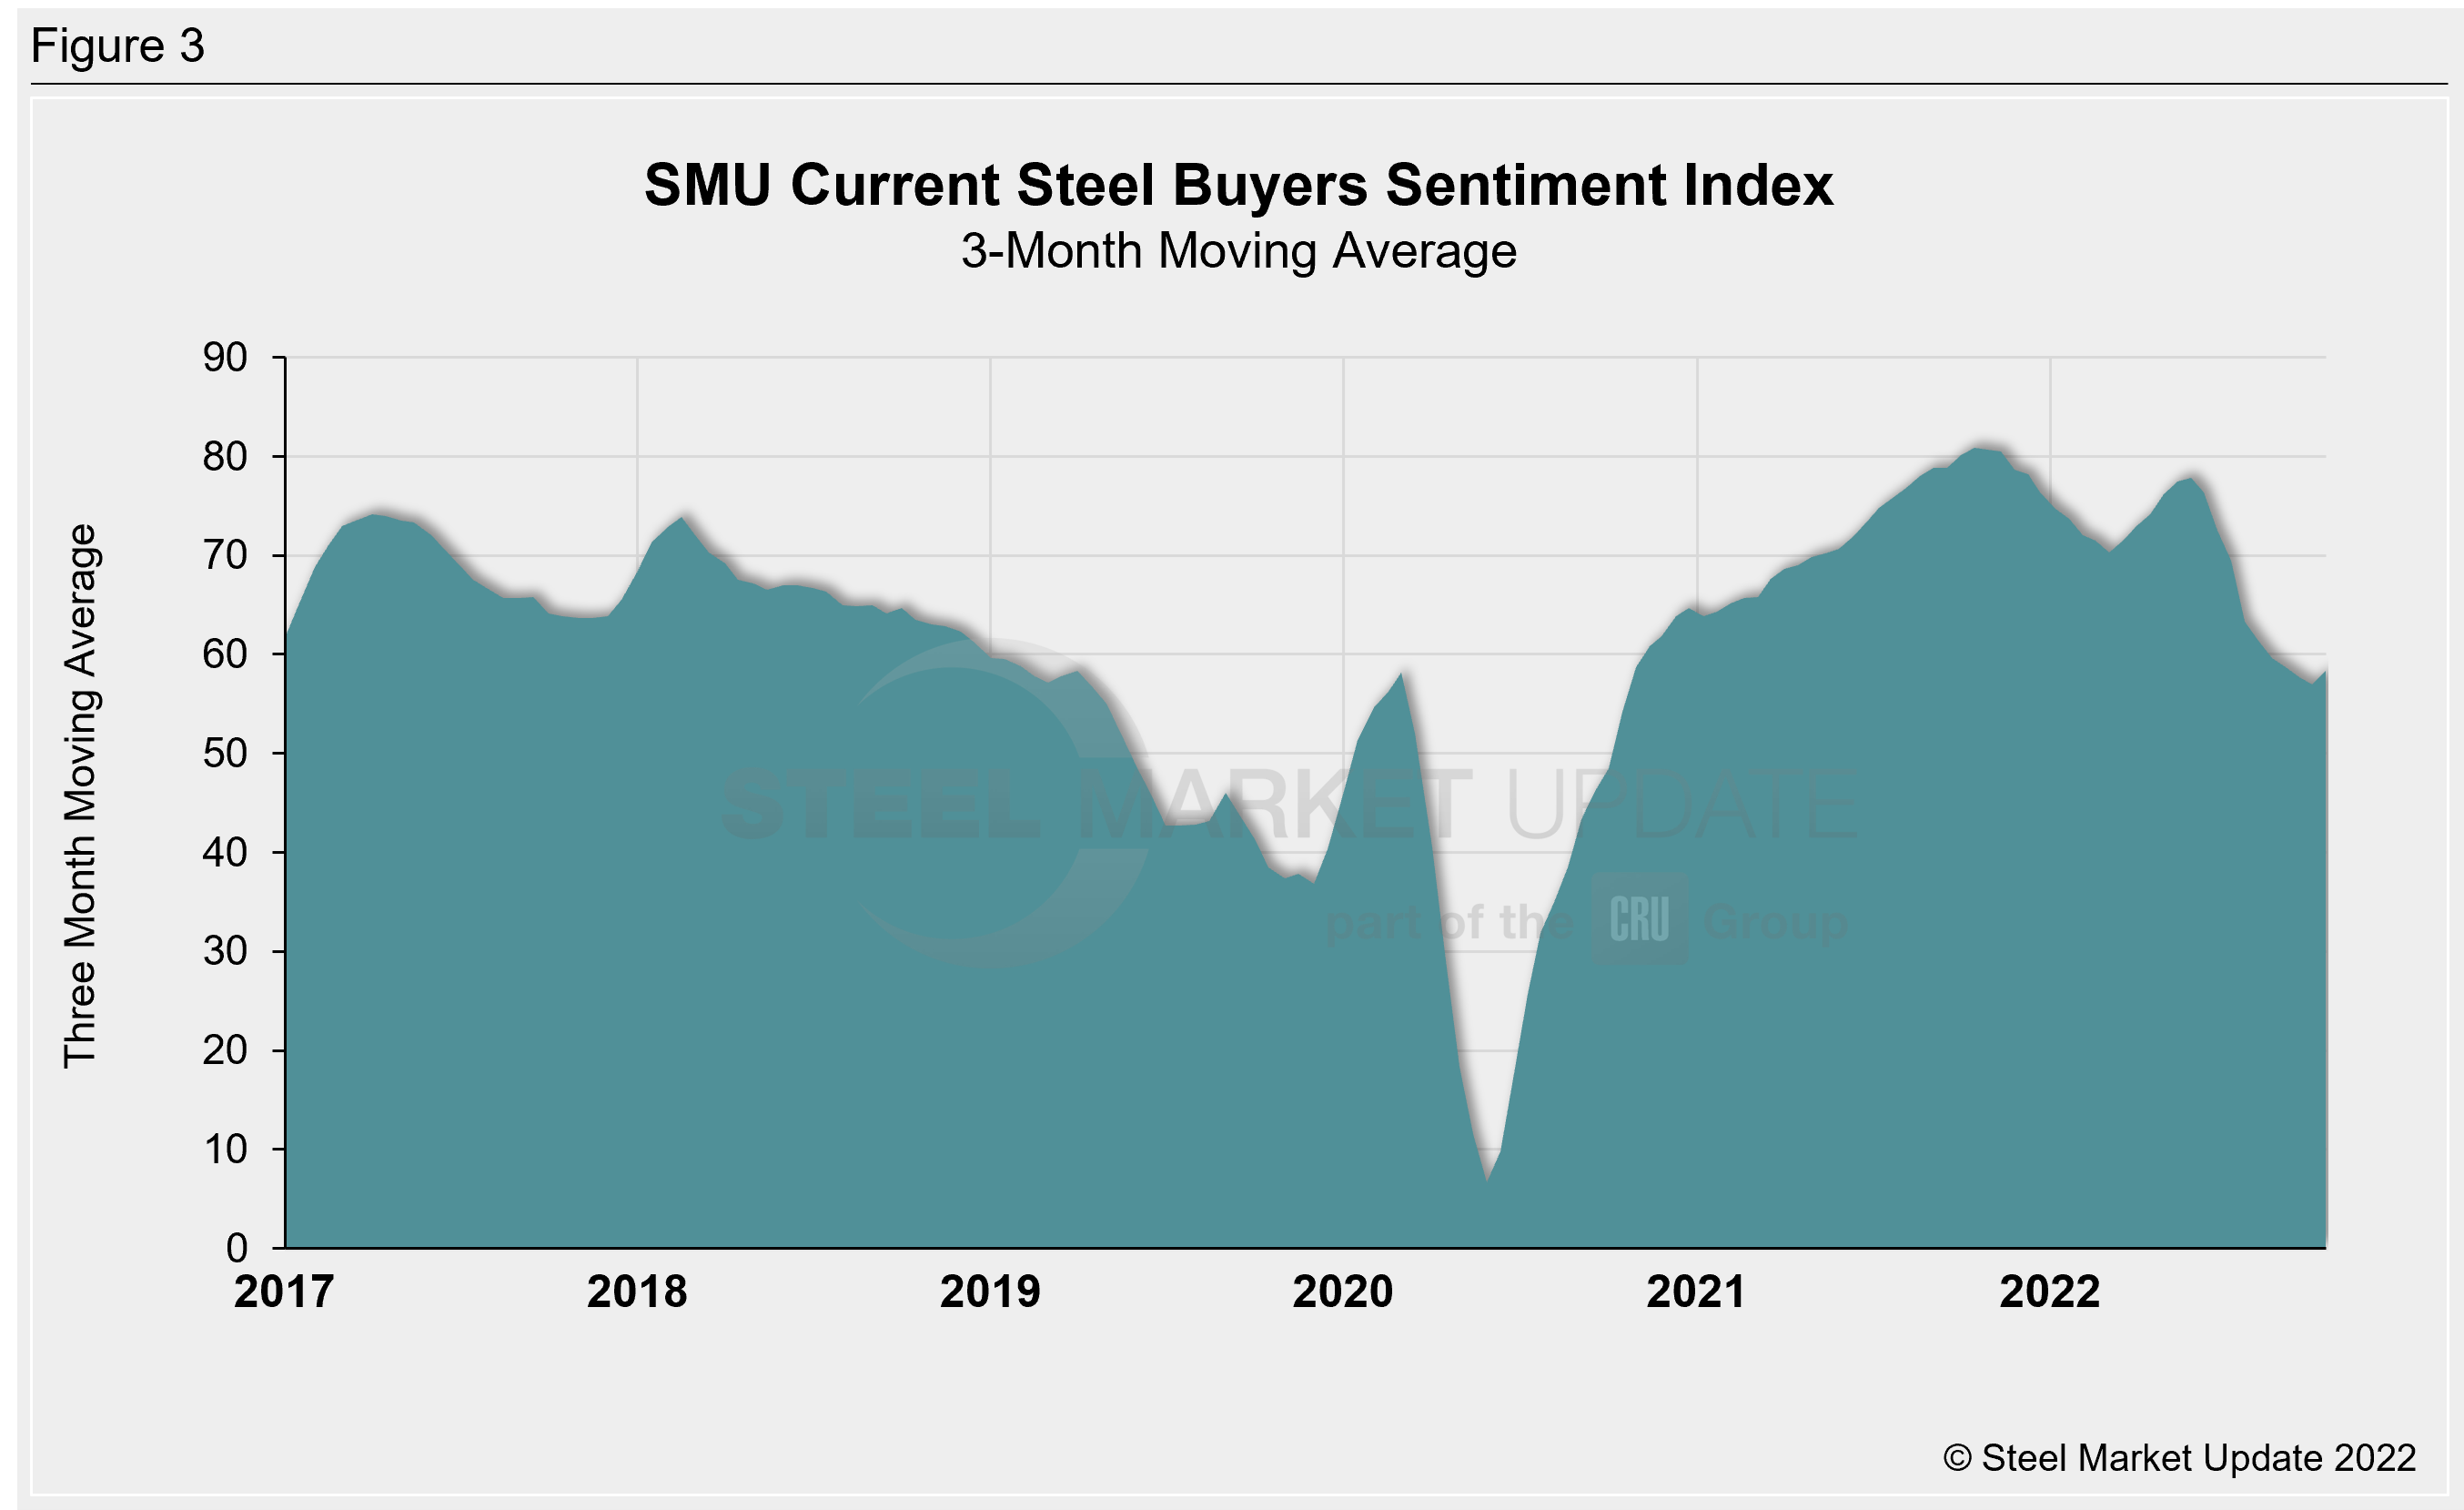
Measured as a three-month moving average, the Current Sentiment 3MMA rose over one full point to +58.33 compared to two weeks prior, an increase of two-thirds of a point versus one month earlier (Figure 3). The late September reading of +57 was the lowest since mid-October 2020, when it was +54.17. Nearly five months ago, the Current Sentiment 3MMA peaked at +77.83, the highest level since December 2021.
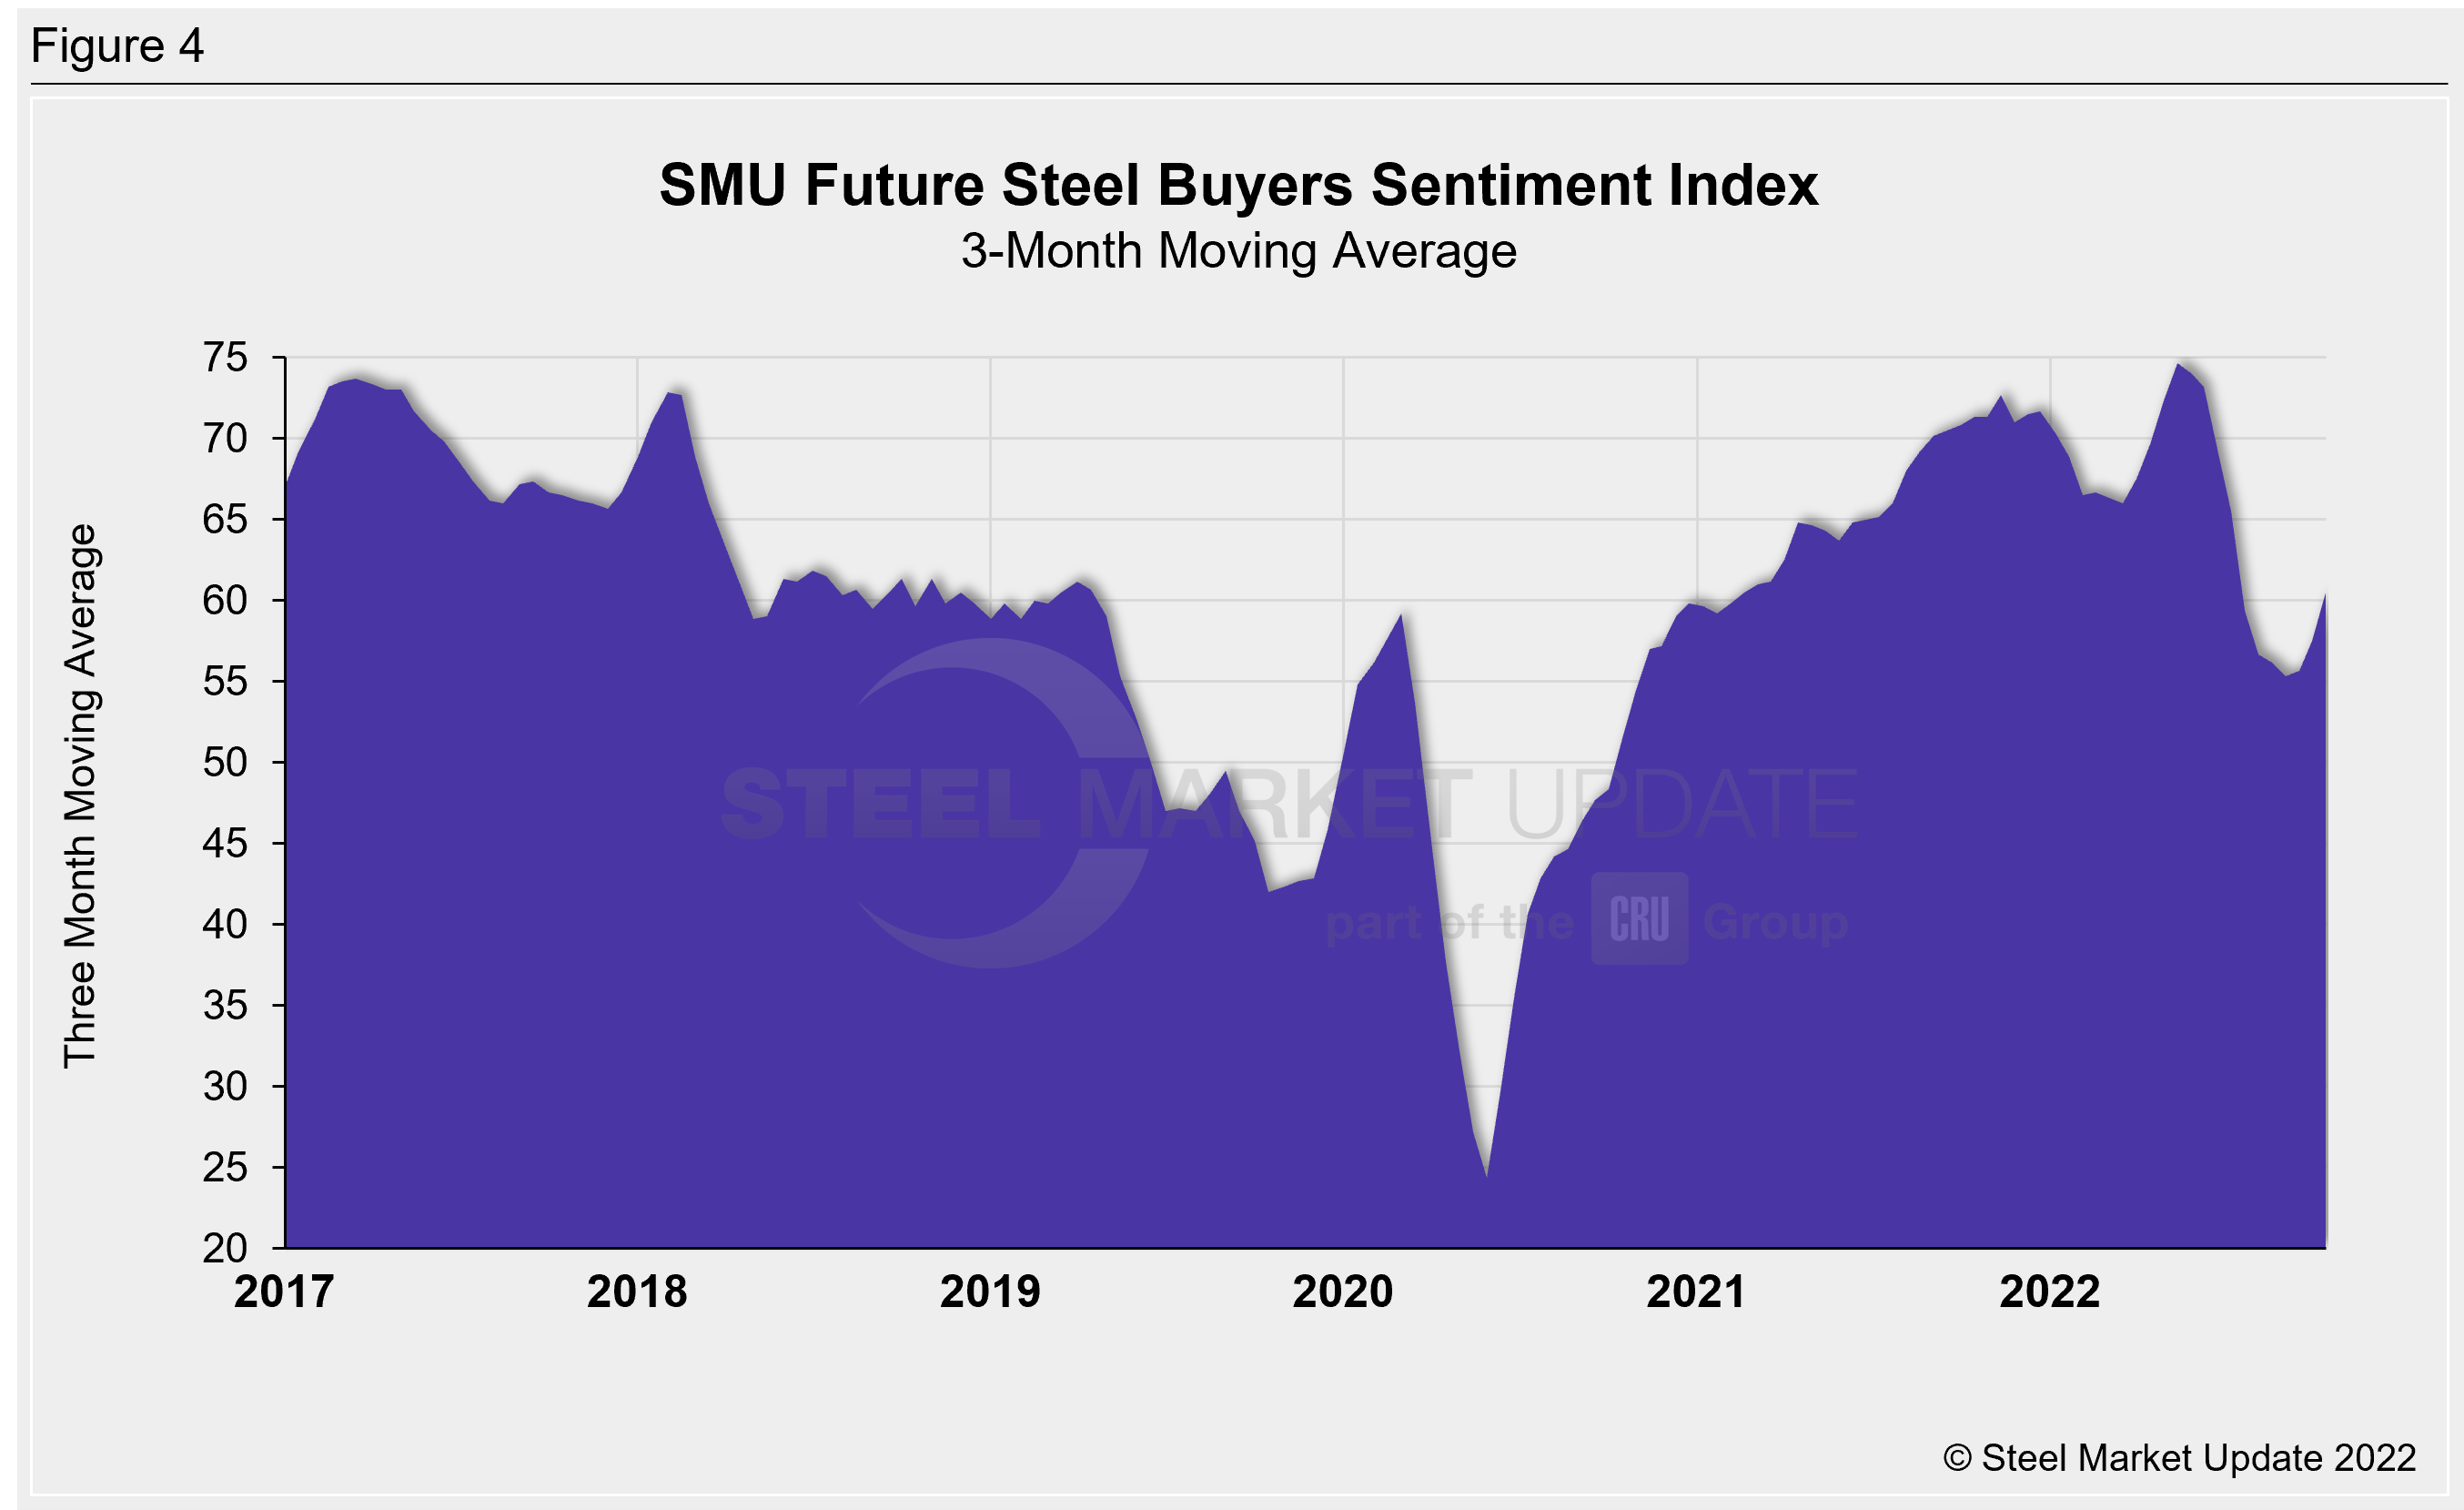
The Future Sentiment 3MMA rose three points this week to +60.50, nearly five points higher than levels one month prior (Figure 4). The early September reading of +55.33 was the lowest seen since October 2020, when it was +54.50. Like the Current Sentiment 3MMA, the Future Sentiment 3MMA had reached a record high of +74.67 in May, surpassing the previous record of +73.67 set in March 2017.
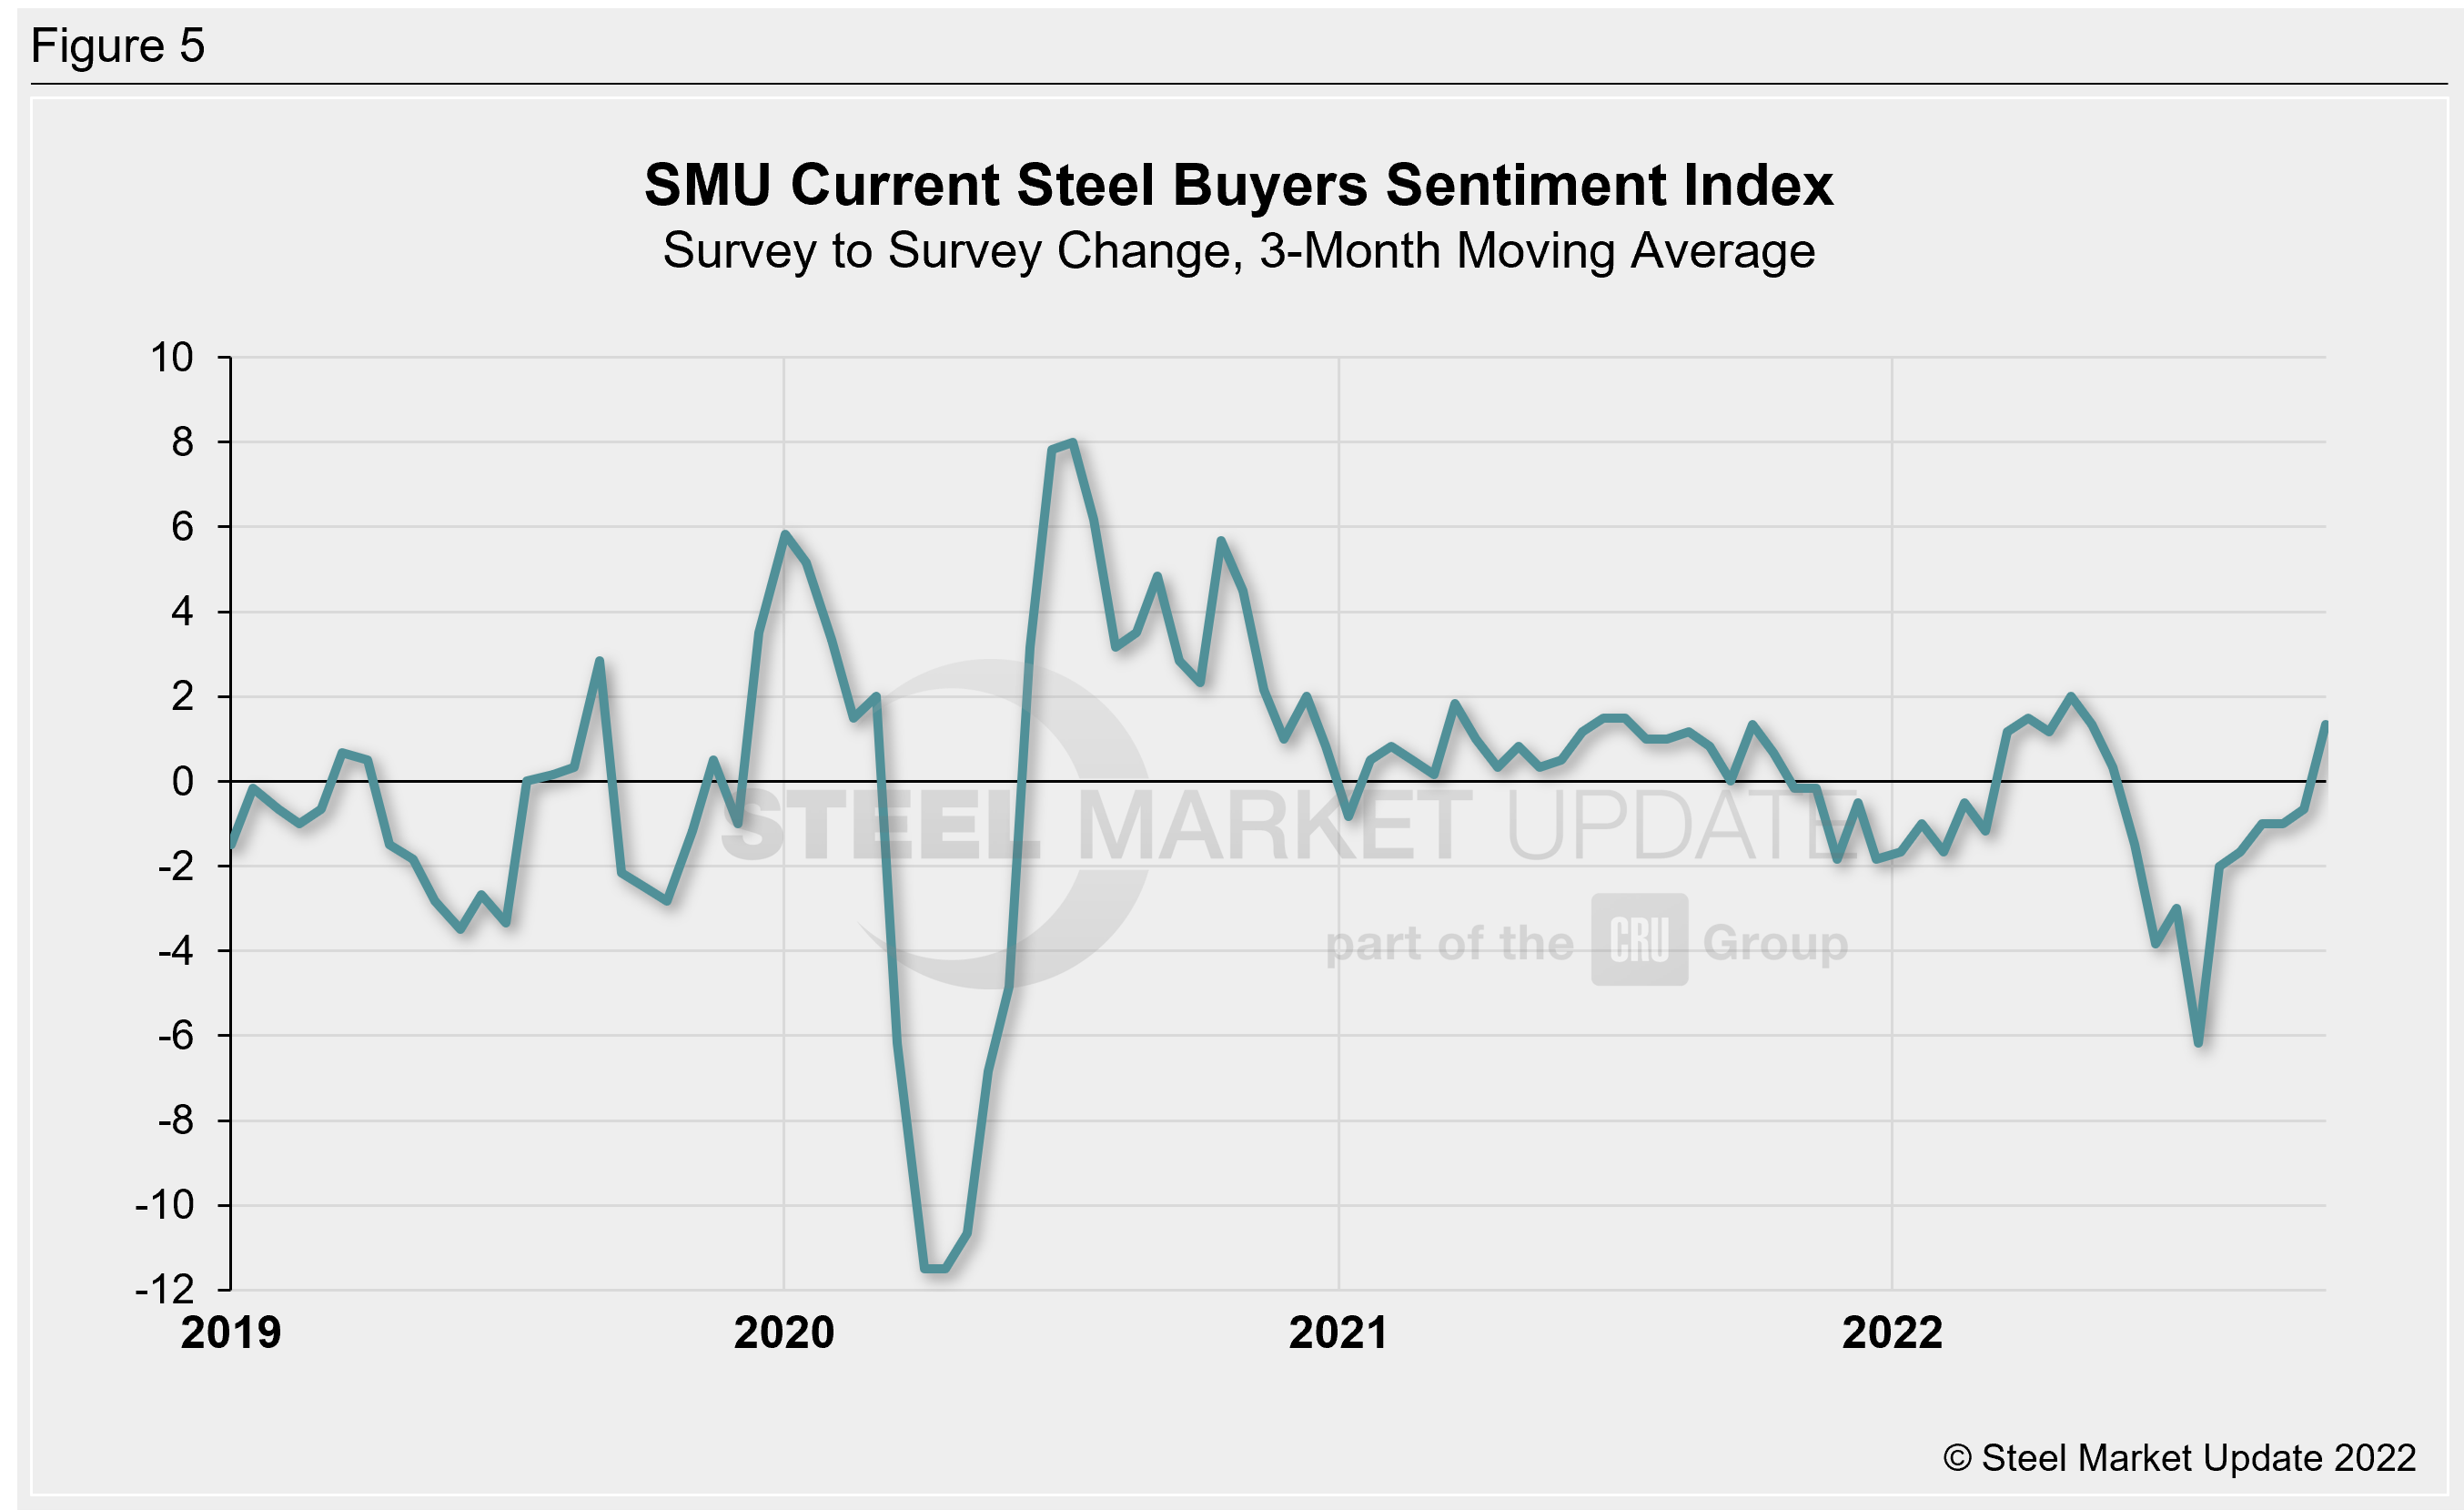
One helpful way to measure the magnitude of Sentiment movements is to look at the survey-to-survey change in the Current Sentiment Index (Figure 5). On a 3MMA basis, the survey-to-survey change through mid-October is up one point compared to late September, the first positive growth rate seen since May. In late July we saw a six-point decline, which was the largest change seen since April 2020. Between November 2020 and June 2022, the survey-to-survey change in our 3MMA Sentiment reading was relatively stable, never exceeding two points. In late June of this year, it began to exceed that range and did so through July.
What SMU Survey Respondents Had to Say:
“Just very unsure and don’t see many positives.”
“Volumes are pretty low as buyers are holding out for better 2023 economics, making it challenging.”
“We still maintain a good backlog today.”
“Slowing demand.”
“Nothing much will change…A lot of uncertainty and headwinds created artificially by government’s wrong economic policies.”
“Expected higher interest rates will put recessionary pressure on the economy.”
“It will only get worse before it gets better.”
“Recession will not hit us in the next three quarters.”
“Weak booking and lower profits.”
“Inflation starting to slow down demand.”
“We have a very strong backlog going into 2023.”
About the SMU Steel Buyers Sentiment Index
The SMU Steel Buyers Sentiment Index is a measurement of the current attitude of buyers and sellers of flat-rolled steel products in North America regarding how they feel about their company’s opportunity for success in today’s market. It is a proprietary product developed by Steel Market Update for the North American steel industry. Tracking steel buyers’ sentiment is helpful in predicting their future behavior.
Positive readings run from +10 to +100. A positive reading means the meter on the right-hand side of our home page will fall in the green area indicating optimistic sentiment. Negative readings run from -10 to -100. They result in the meter on our homepage trending into the red, indicating pessimistic sentiment. A reading of “0” (+/- 10) indicates a neutral sentiment (or slightly optimistic or pessimistic), which is most likely an indicator of a shift occurring in the marketplace. Sentiment is measured via SMU surveys that are conducted twice per month. We display the meter on our home page.
We send invitations to participate in our survey to more than 700 North American companies. Approximately 45% of respondents are service centers/distributors, 30% are manufacturers, and the remainder are steel mills, trading companies or toll processors involved in the steel business.
Click here to view an interactive graphic of the SMU Steel Buyers Sentiment Index or the SMU Future Steel Buyers Sentiment Index.
By Brett Linton, Brett@SteelMarketUpdate.com


