Analysis

November 9, 2022
CPIP Data: US Construction Up Marginally in September
Written by David Schollaert
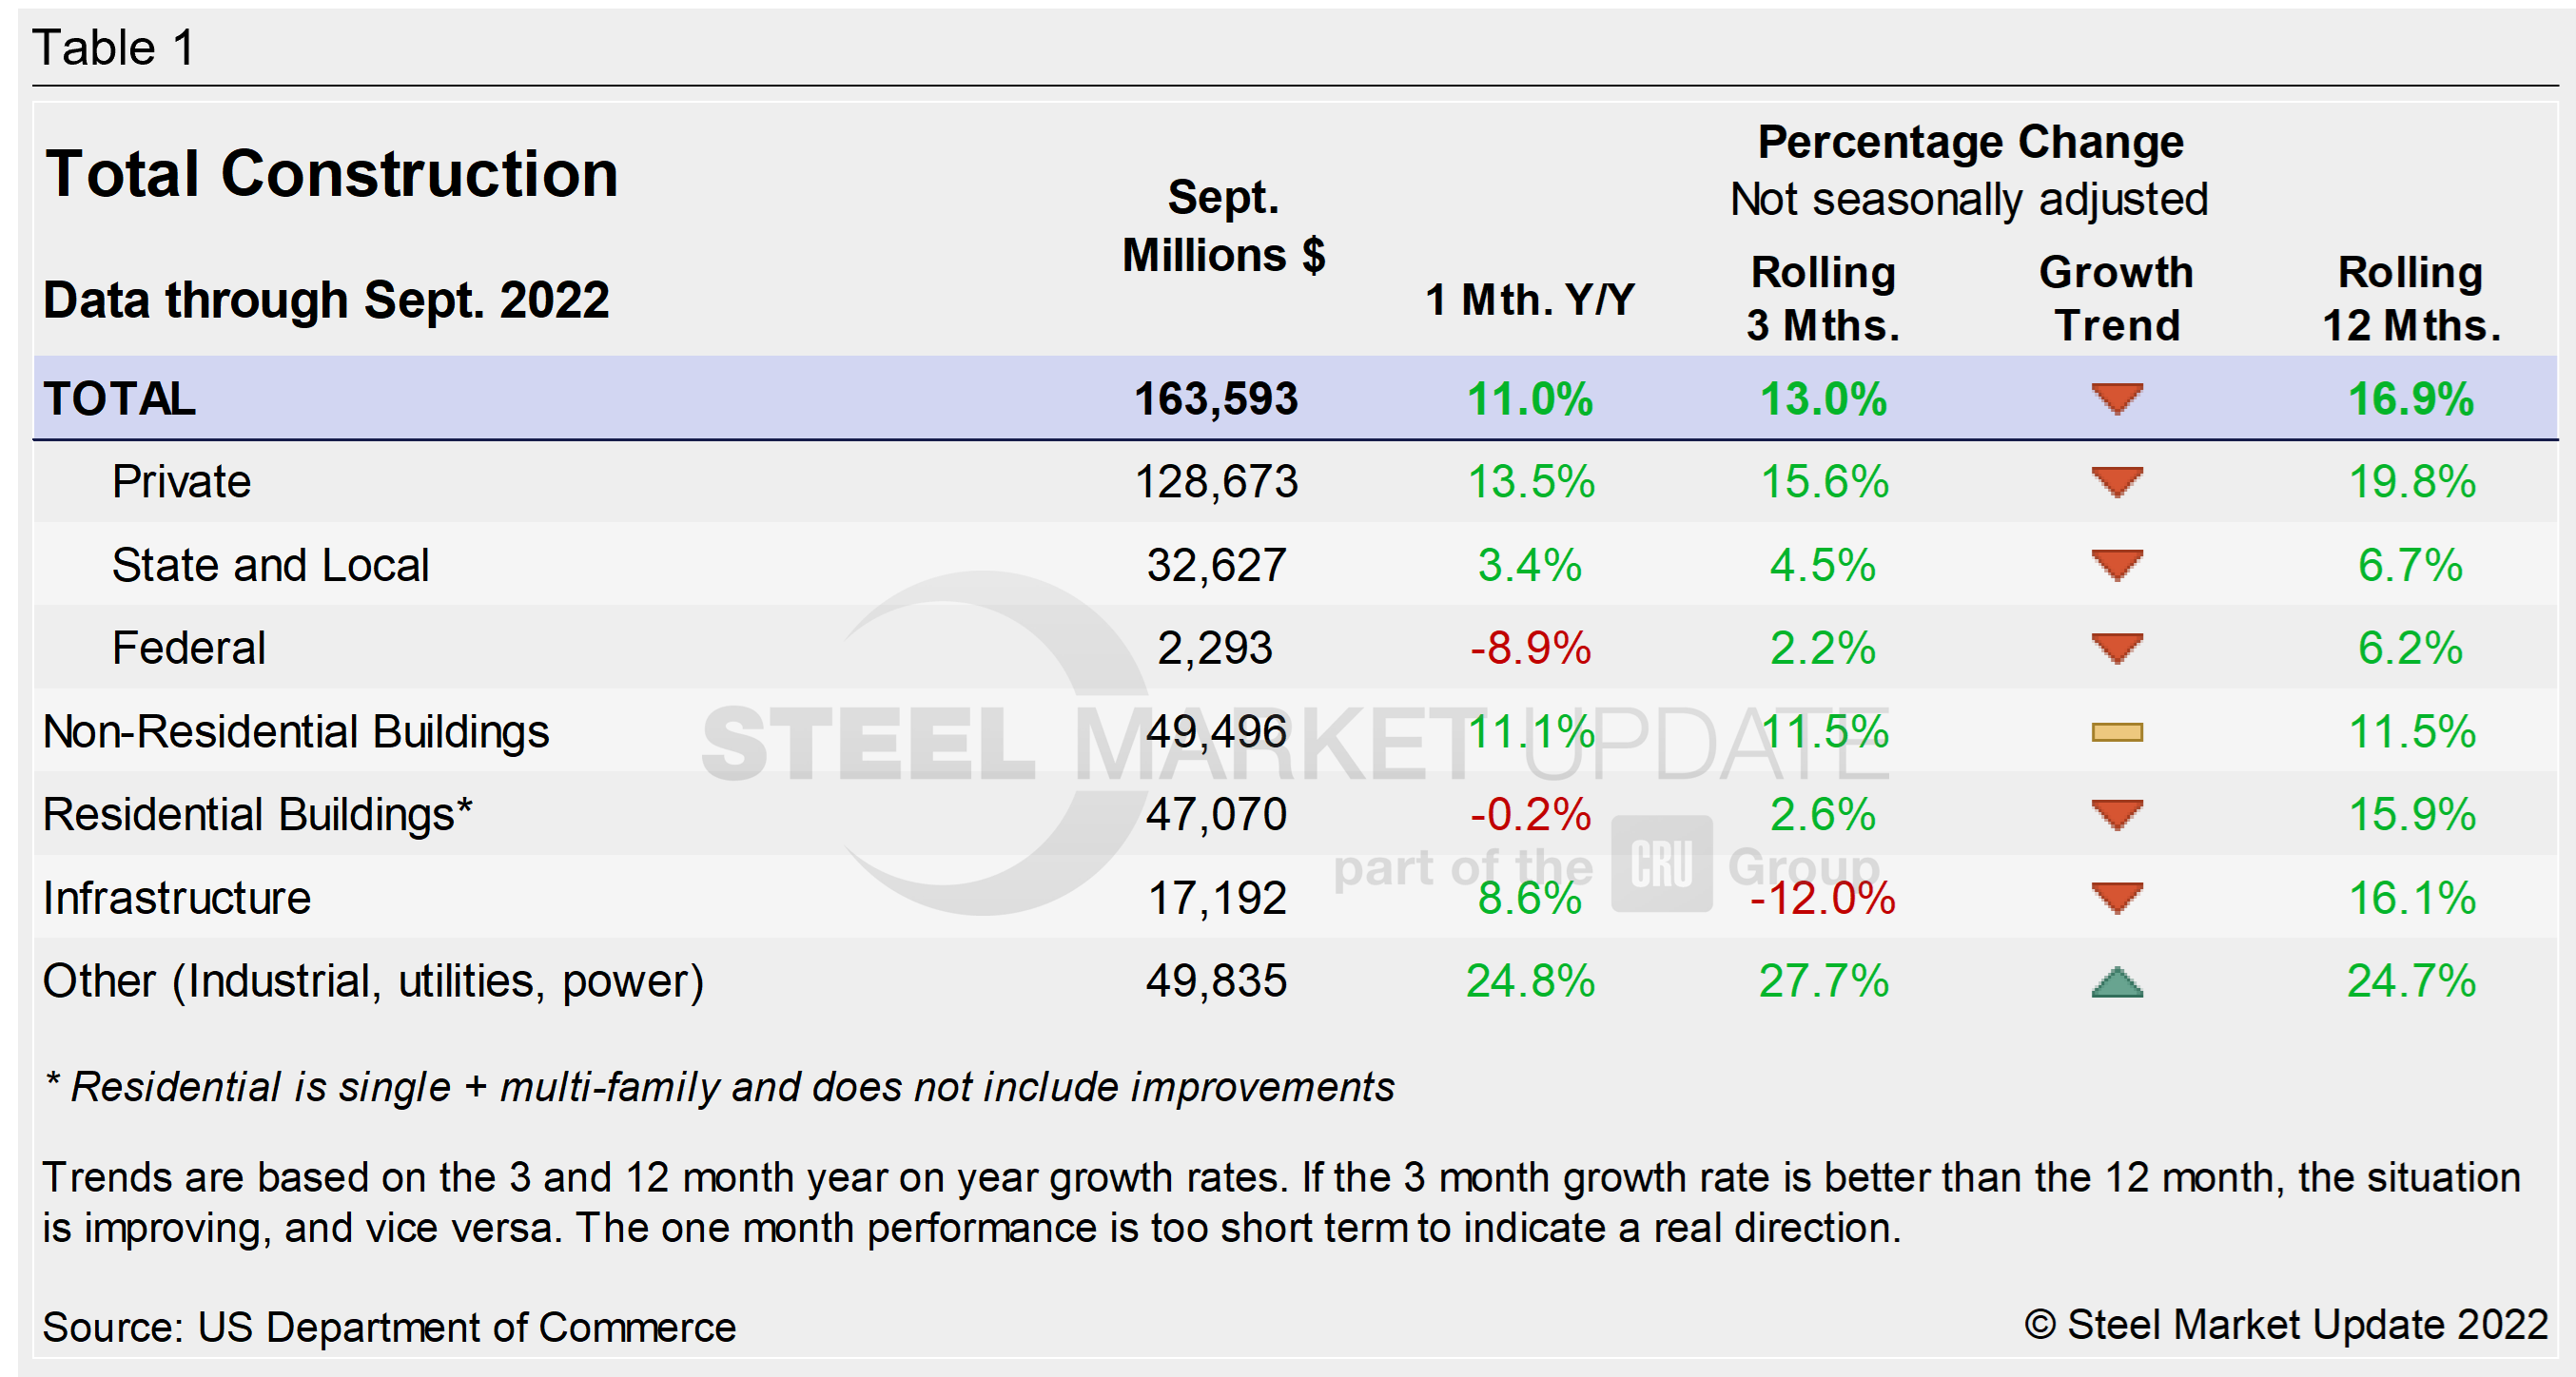
US construction spending in September totaled $1.811 trillion at a seasonally adjusted annual rate (SAAR), just 0.2% above August after August’s 0.6% decline. The unexpected rebound in September came amid a surge in nonresidential investment that offset declining outlays on single-family homebuilding, according to data from the US Commerce Department.
The month-on-month (MoM) increase was backed by a 10.9% year-on-year (YoY) advancement in construction spending in September.
Results were mixed. The bureau’s report on construction shows investment in private construction projects rose 0.4% after dropping 0.7% in August, while outlays on multi-family housing projects gained 0.3% in September. Investment in residential construction was unchanged, while spending on single-family projects dropped 2.6%.
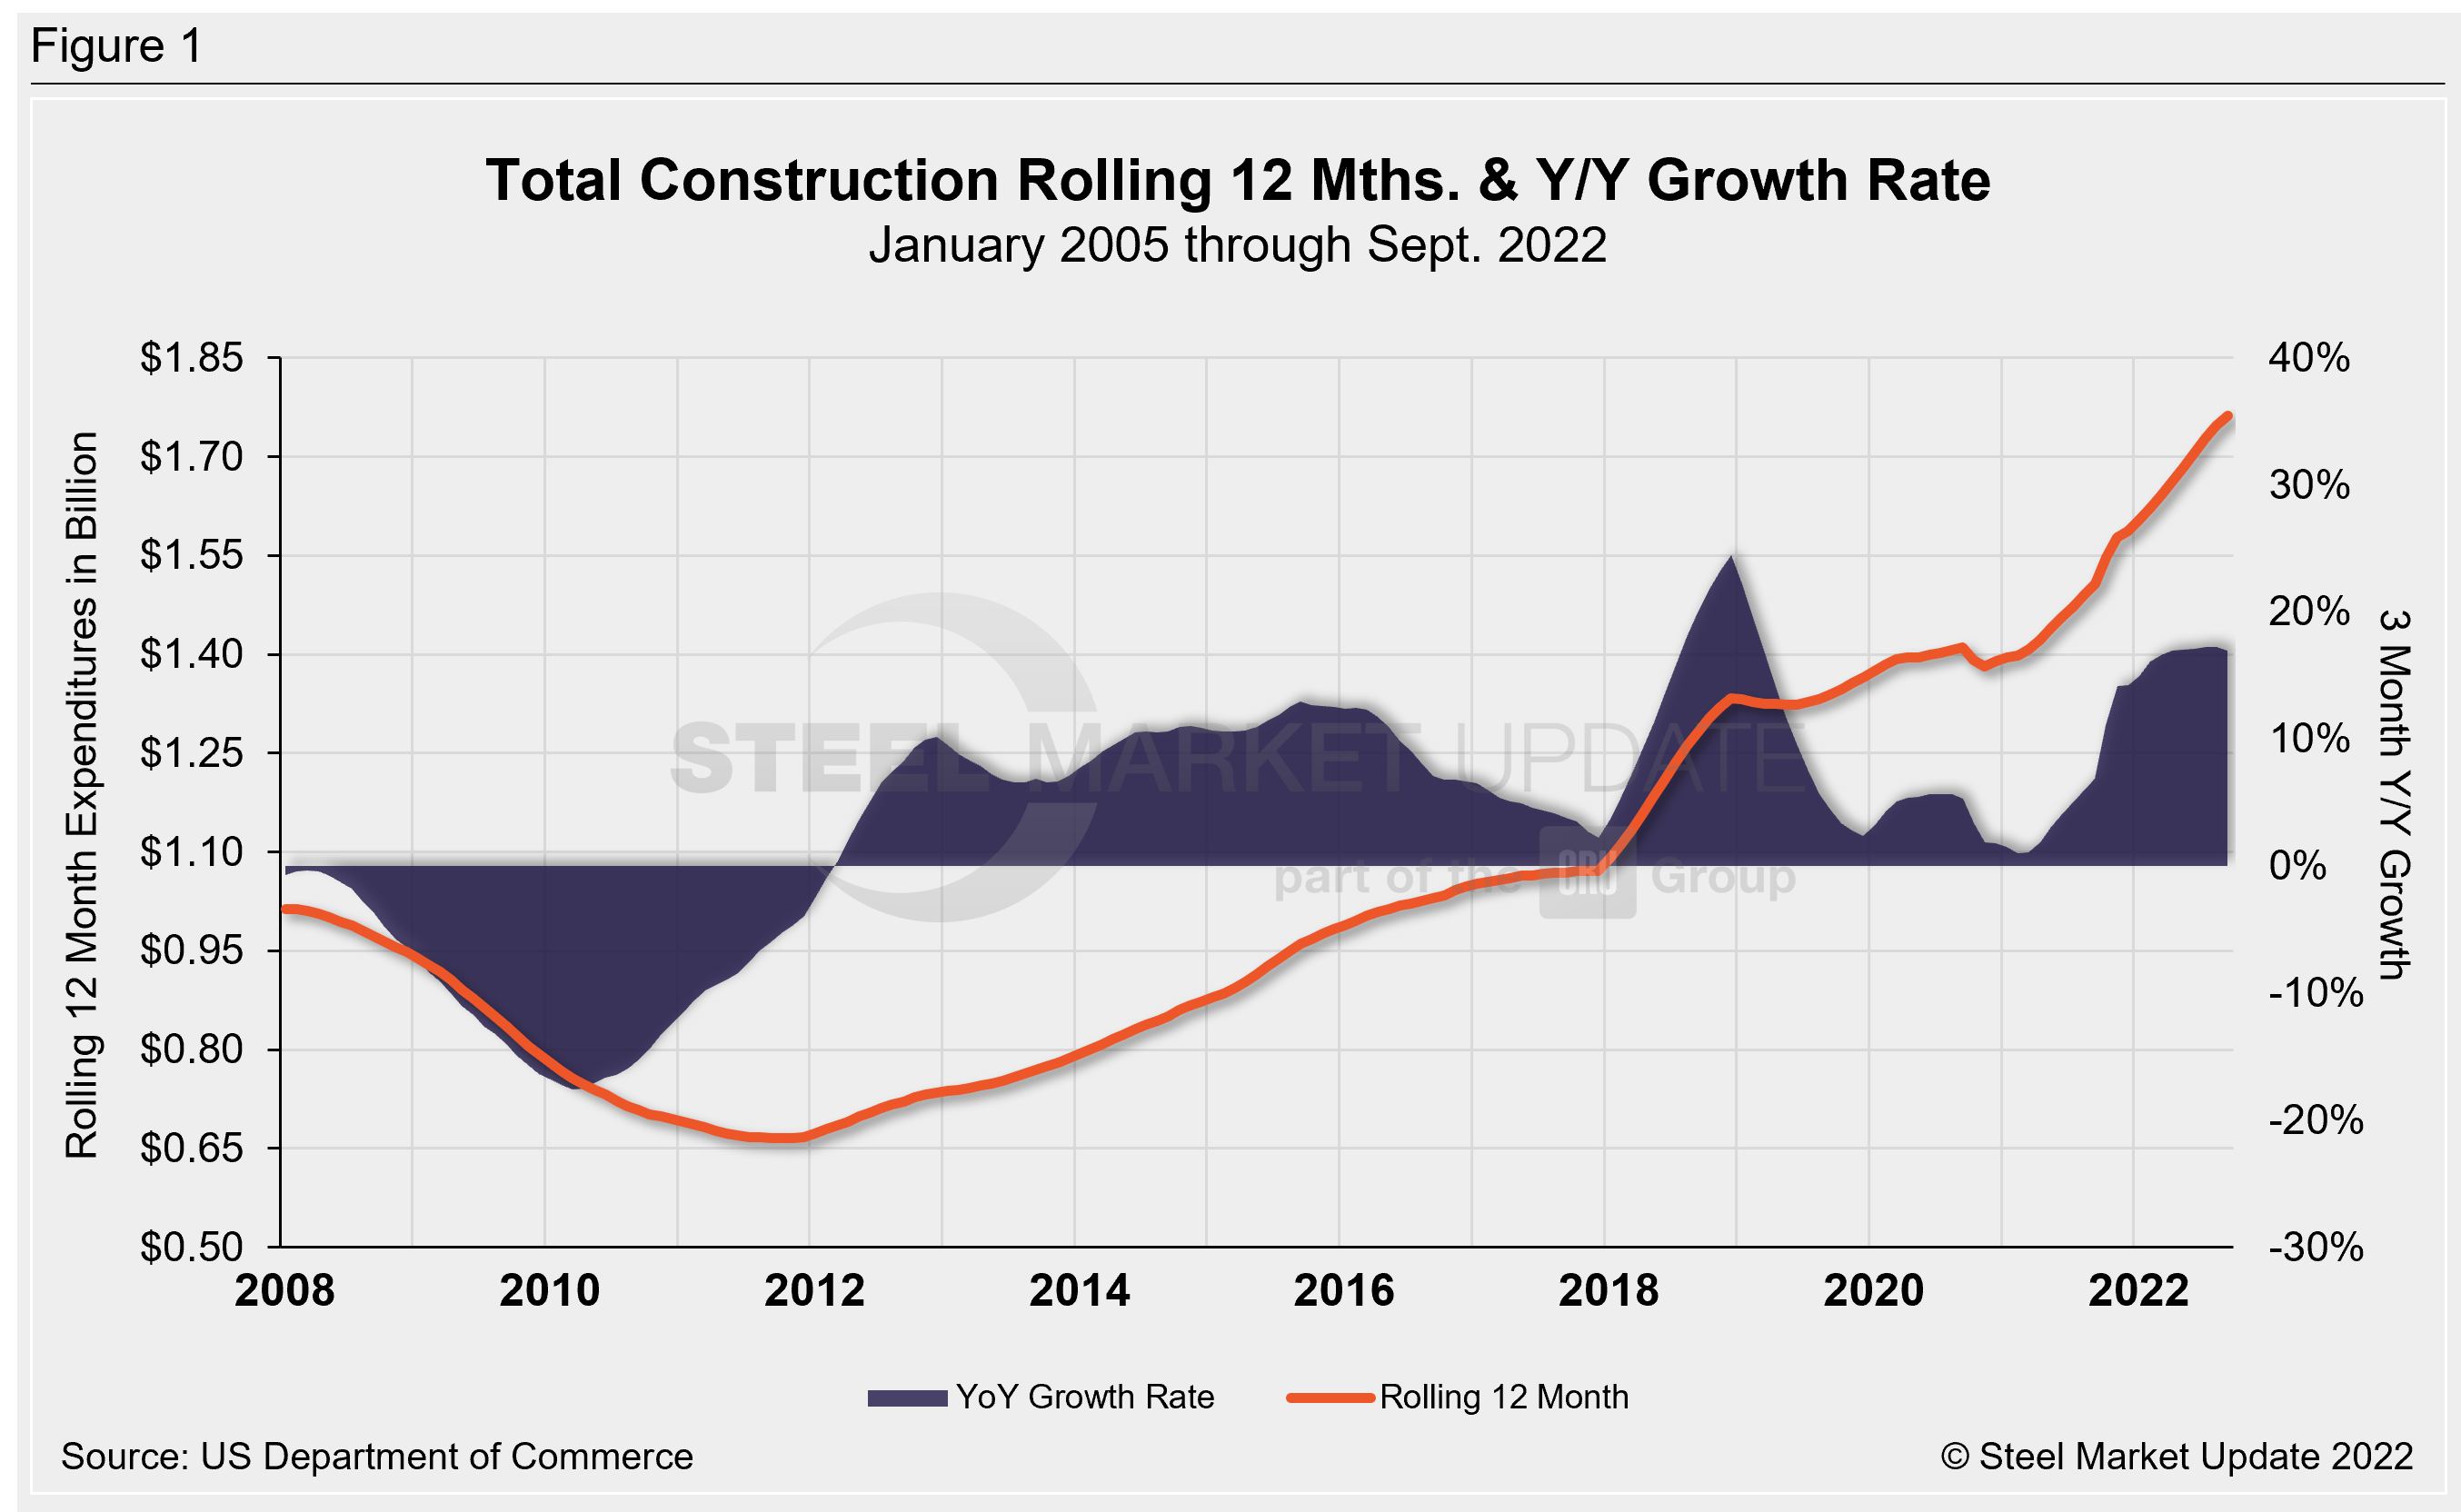
Total construction expenditures and their major categories are shown in Table 1 below. Figure 1 shows total construction and infrastructure expenditures. It details the YoY growth rate versus a rolling 12-month average.
Private Construction
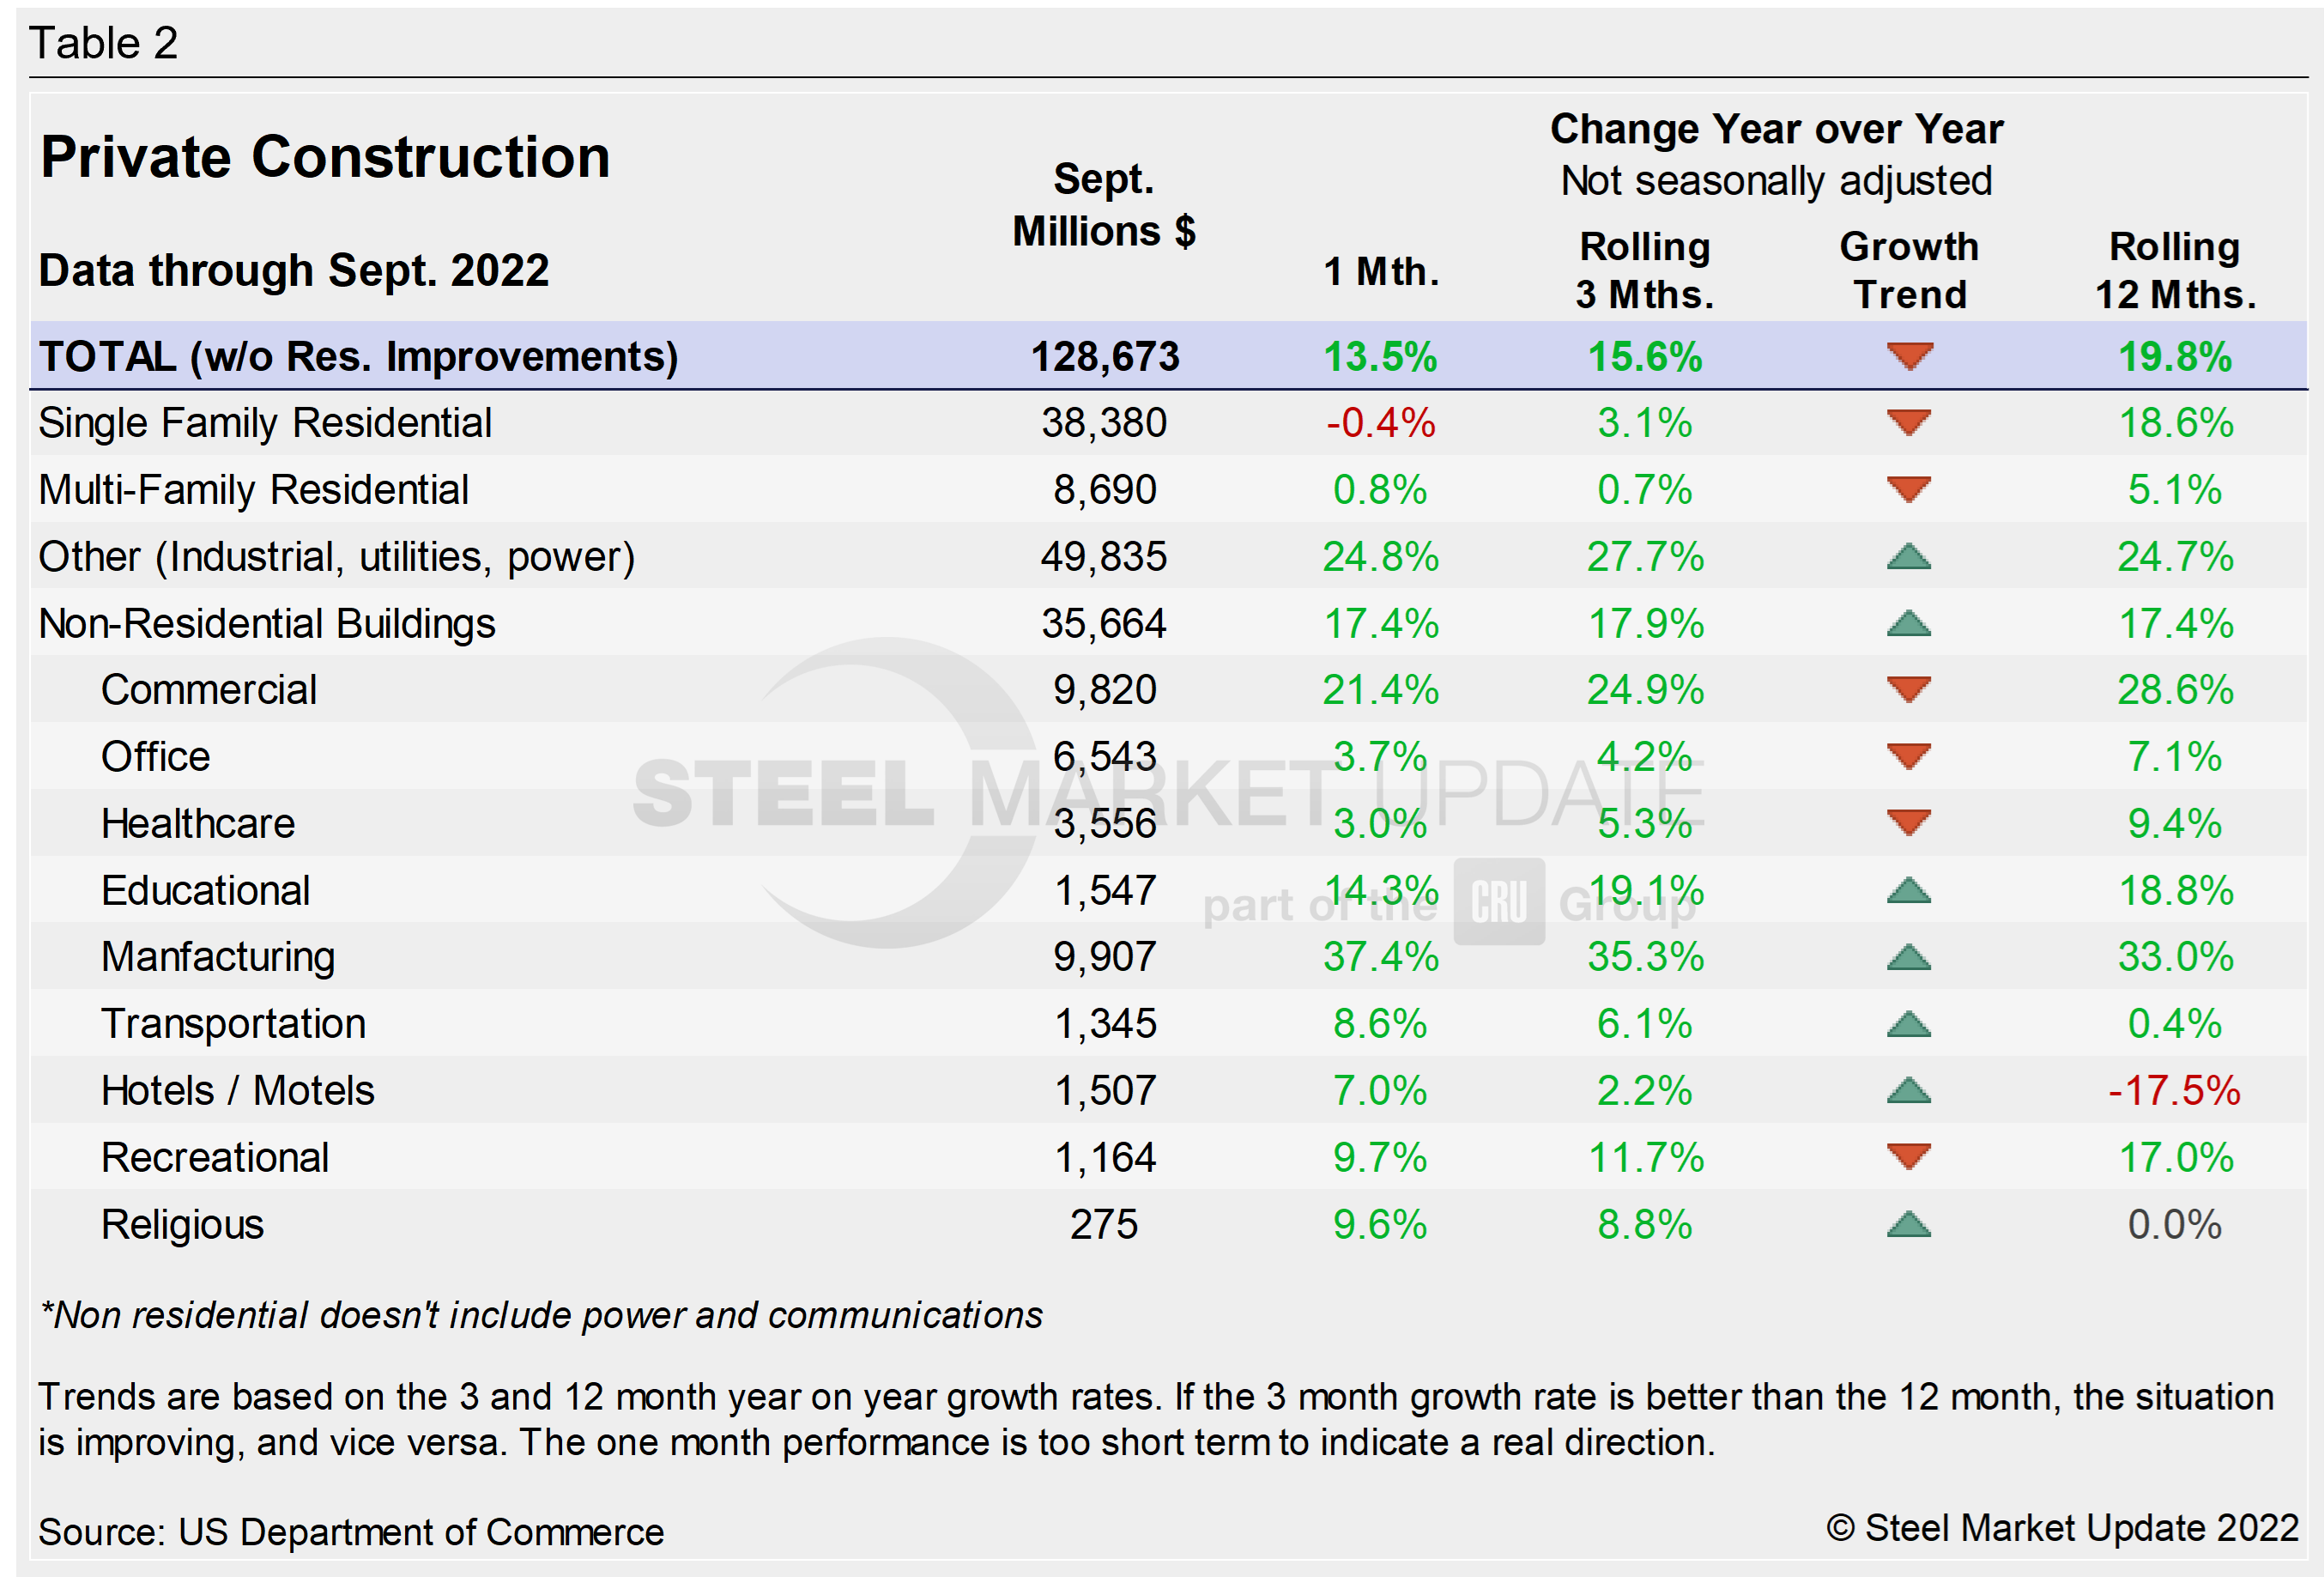
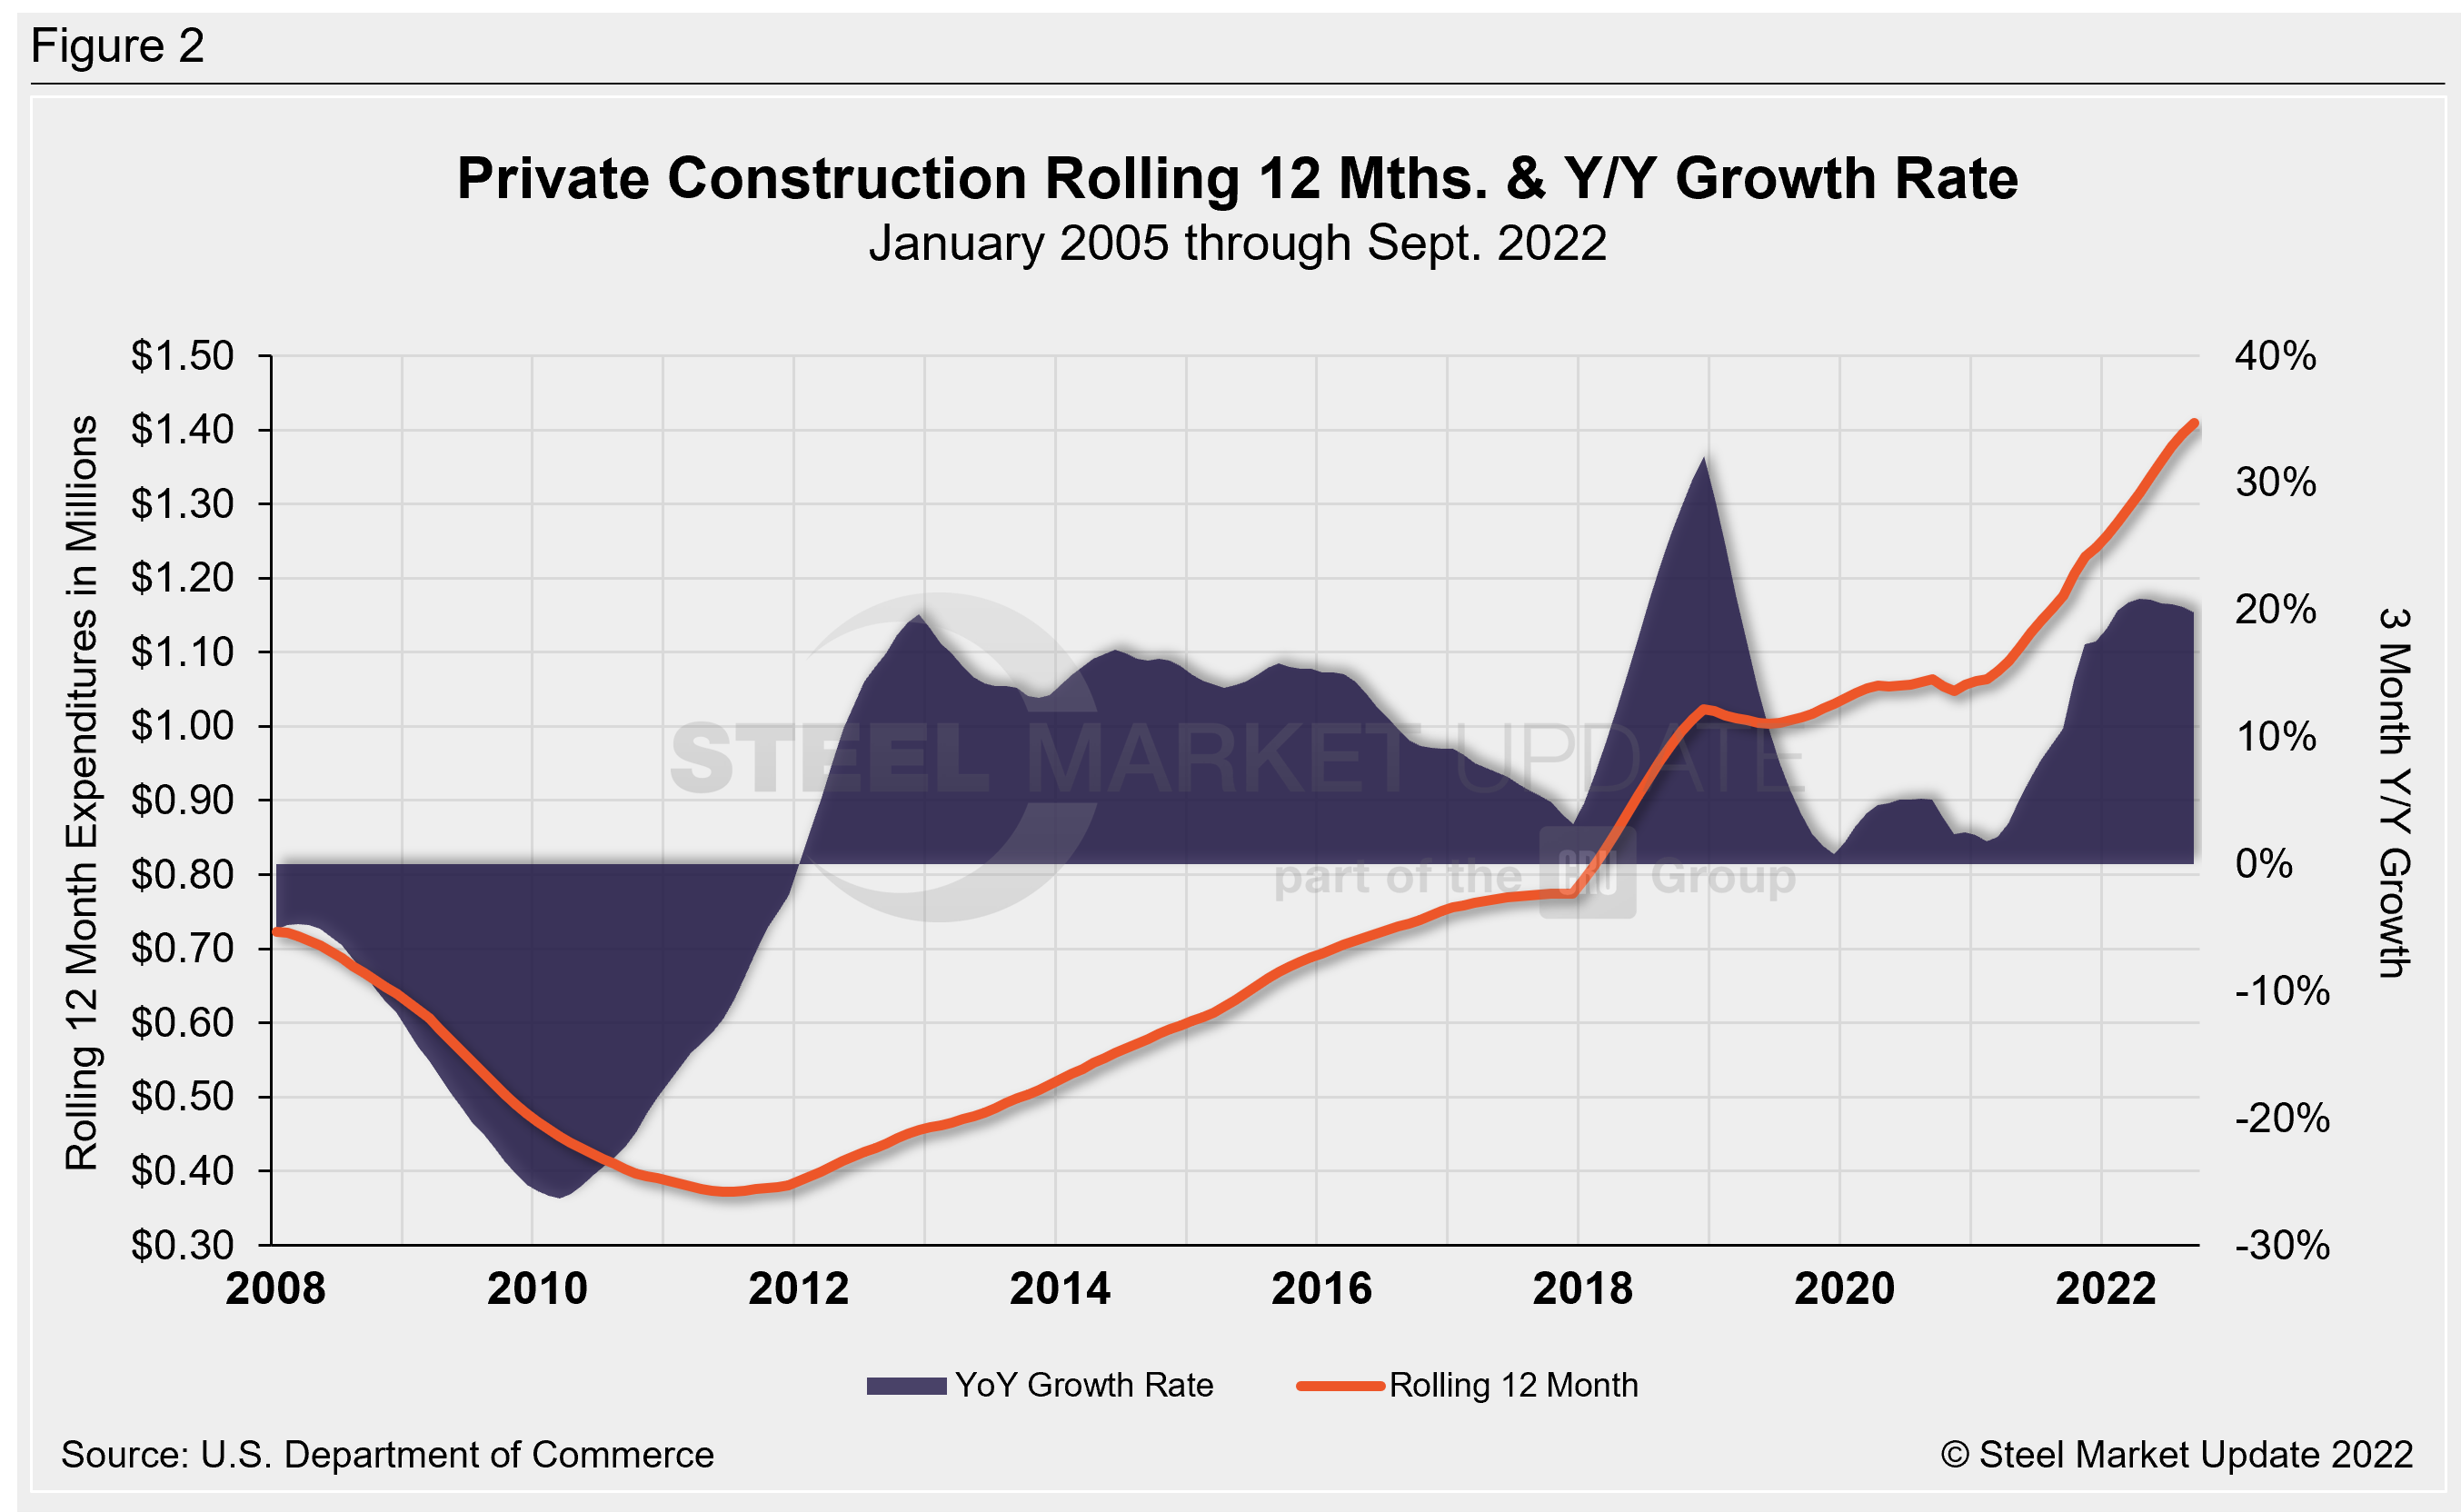
The breakdown of the $1.450 trillion private expenditures into residential and nonresidential, and their subsectors, is highlighted in Table 2 and Figure 2 below. Construction put in place in the private sector in September was up 0.4% from August’s upwardly revised estimate of $1.445 trillion.
Within that category, construction was at a SAAR of $918.0 billion, virtually unchanged from the revised August estimate of $918.0 billion. Residential investment dropped for a sixth straight quarter in Q3, the longest such stretch since the housing market collapse in 2006.
Nonresidential construction was at a SAAR of $532.3 billion in September, 1.0% above the revised August estimate of $526.9 billion.
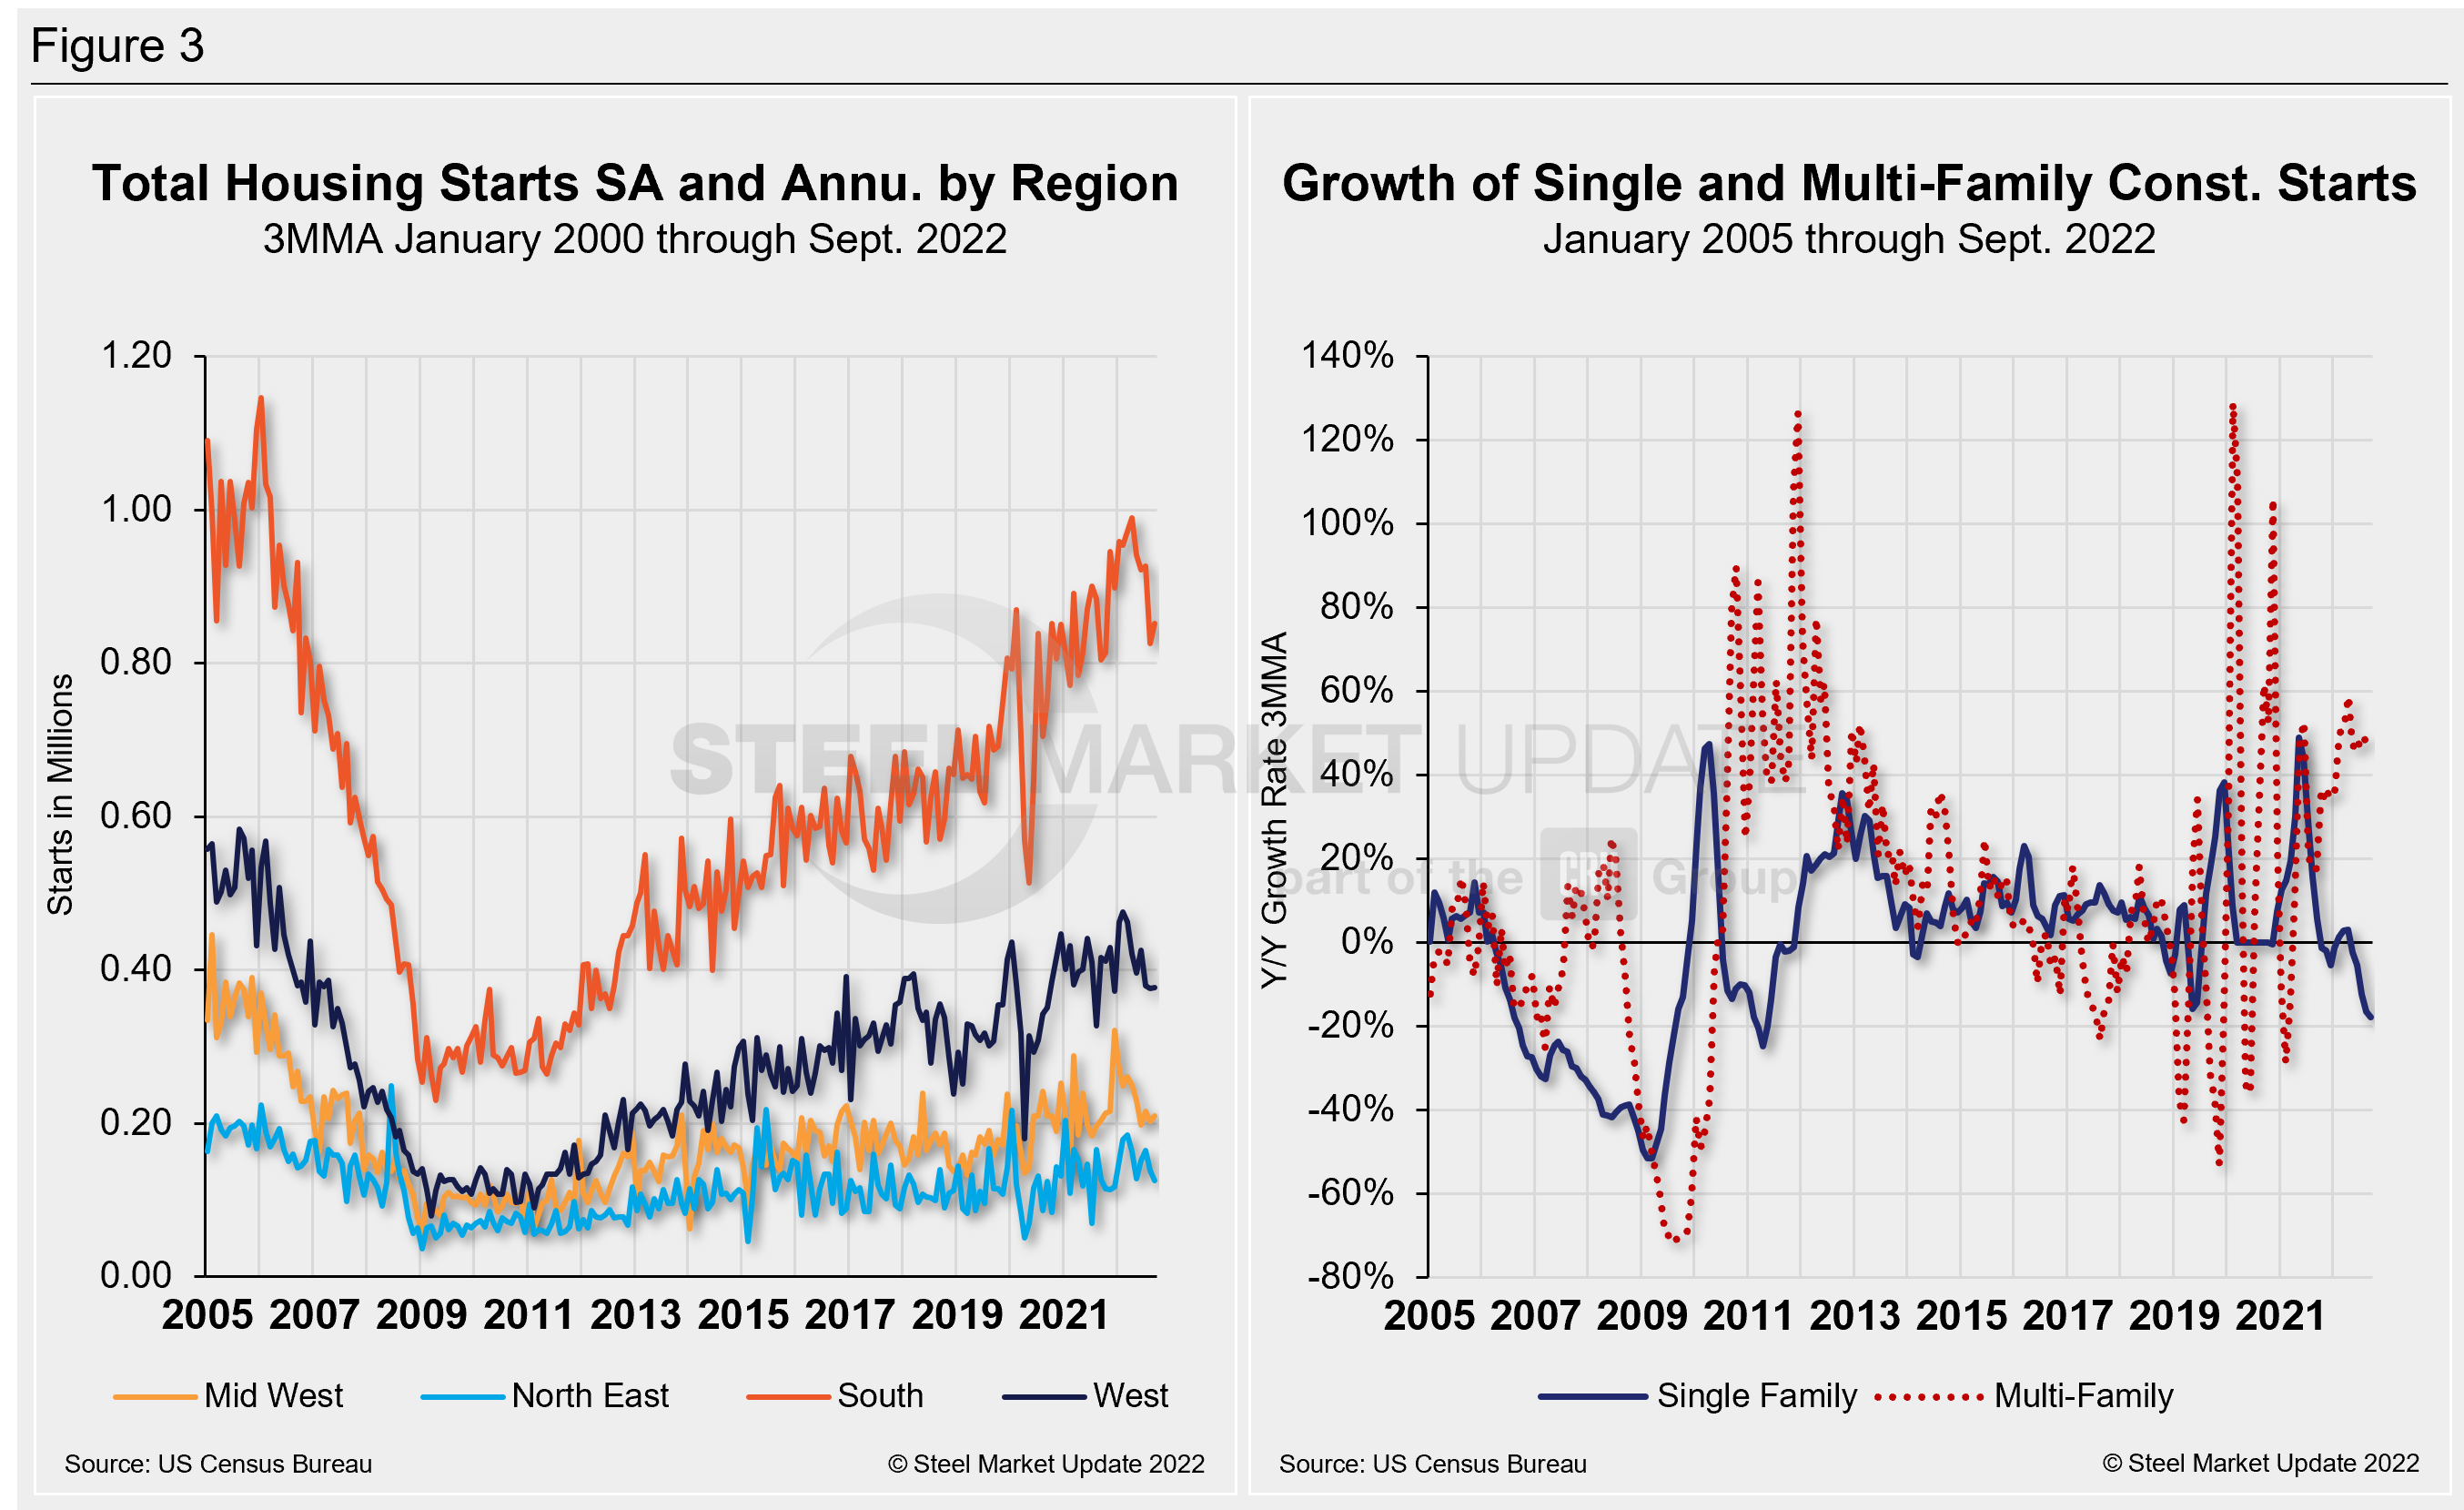
September’s homebuilding totals continue to struggle. Builders are pulling back as building costs rise and prospective buyers get priced out of the market amid rising interest rates. Total housing starts in four regions — the Midwest, Northeast, South, and West — are displayed below in Figure 3. It also displays the growth of single- and multi-family construction starts. Privately-owned housing starts in September were at a SAAR of 1.439, down 8.1% from the revised August estimate of 1.566 million.
Regional results were mixed in September. While the South, West, and Midwest all reported MoM gains, the Northeast saw a noticeable decline, down 9.4% or 13,000 fewer starts. The South saw the largest total gain (+26,000 or 3.1%), followed by the Midwest (+8,000 or 4%) and West (1,000 or 0.3%).
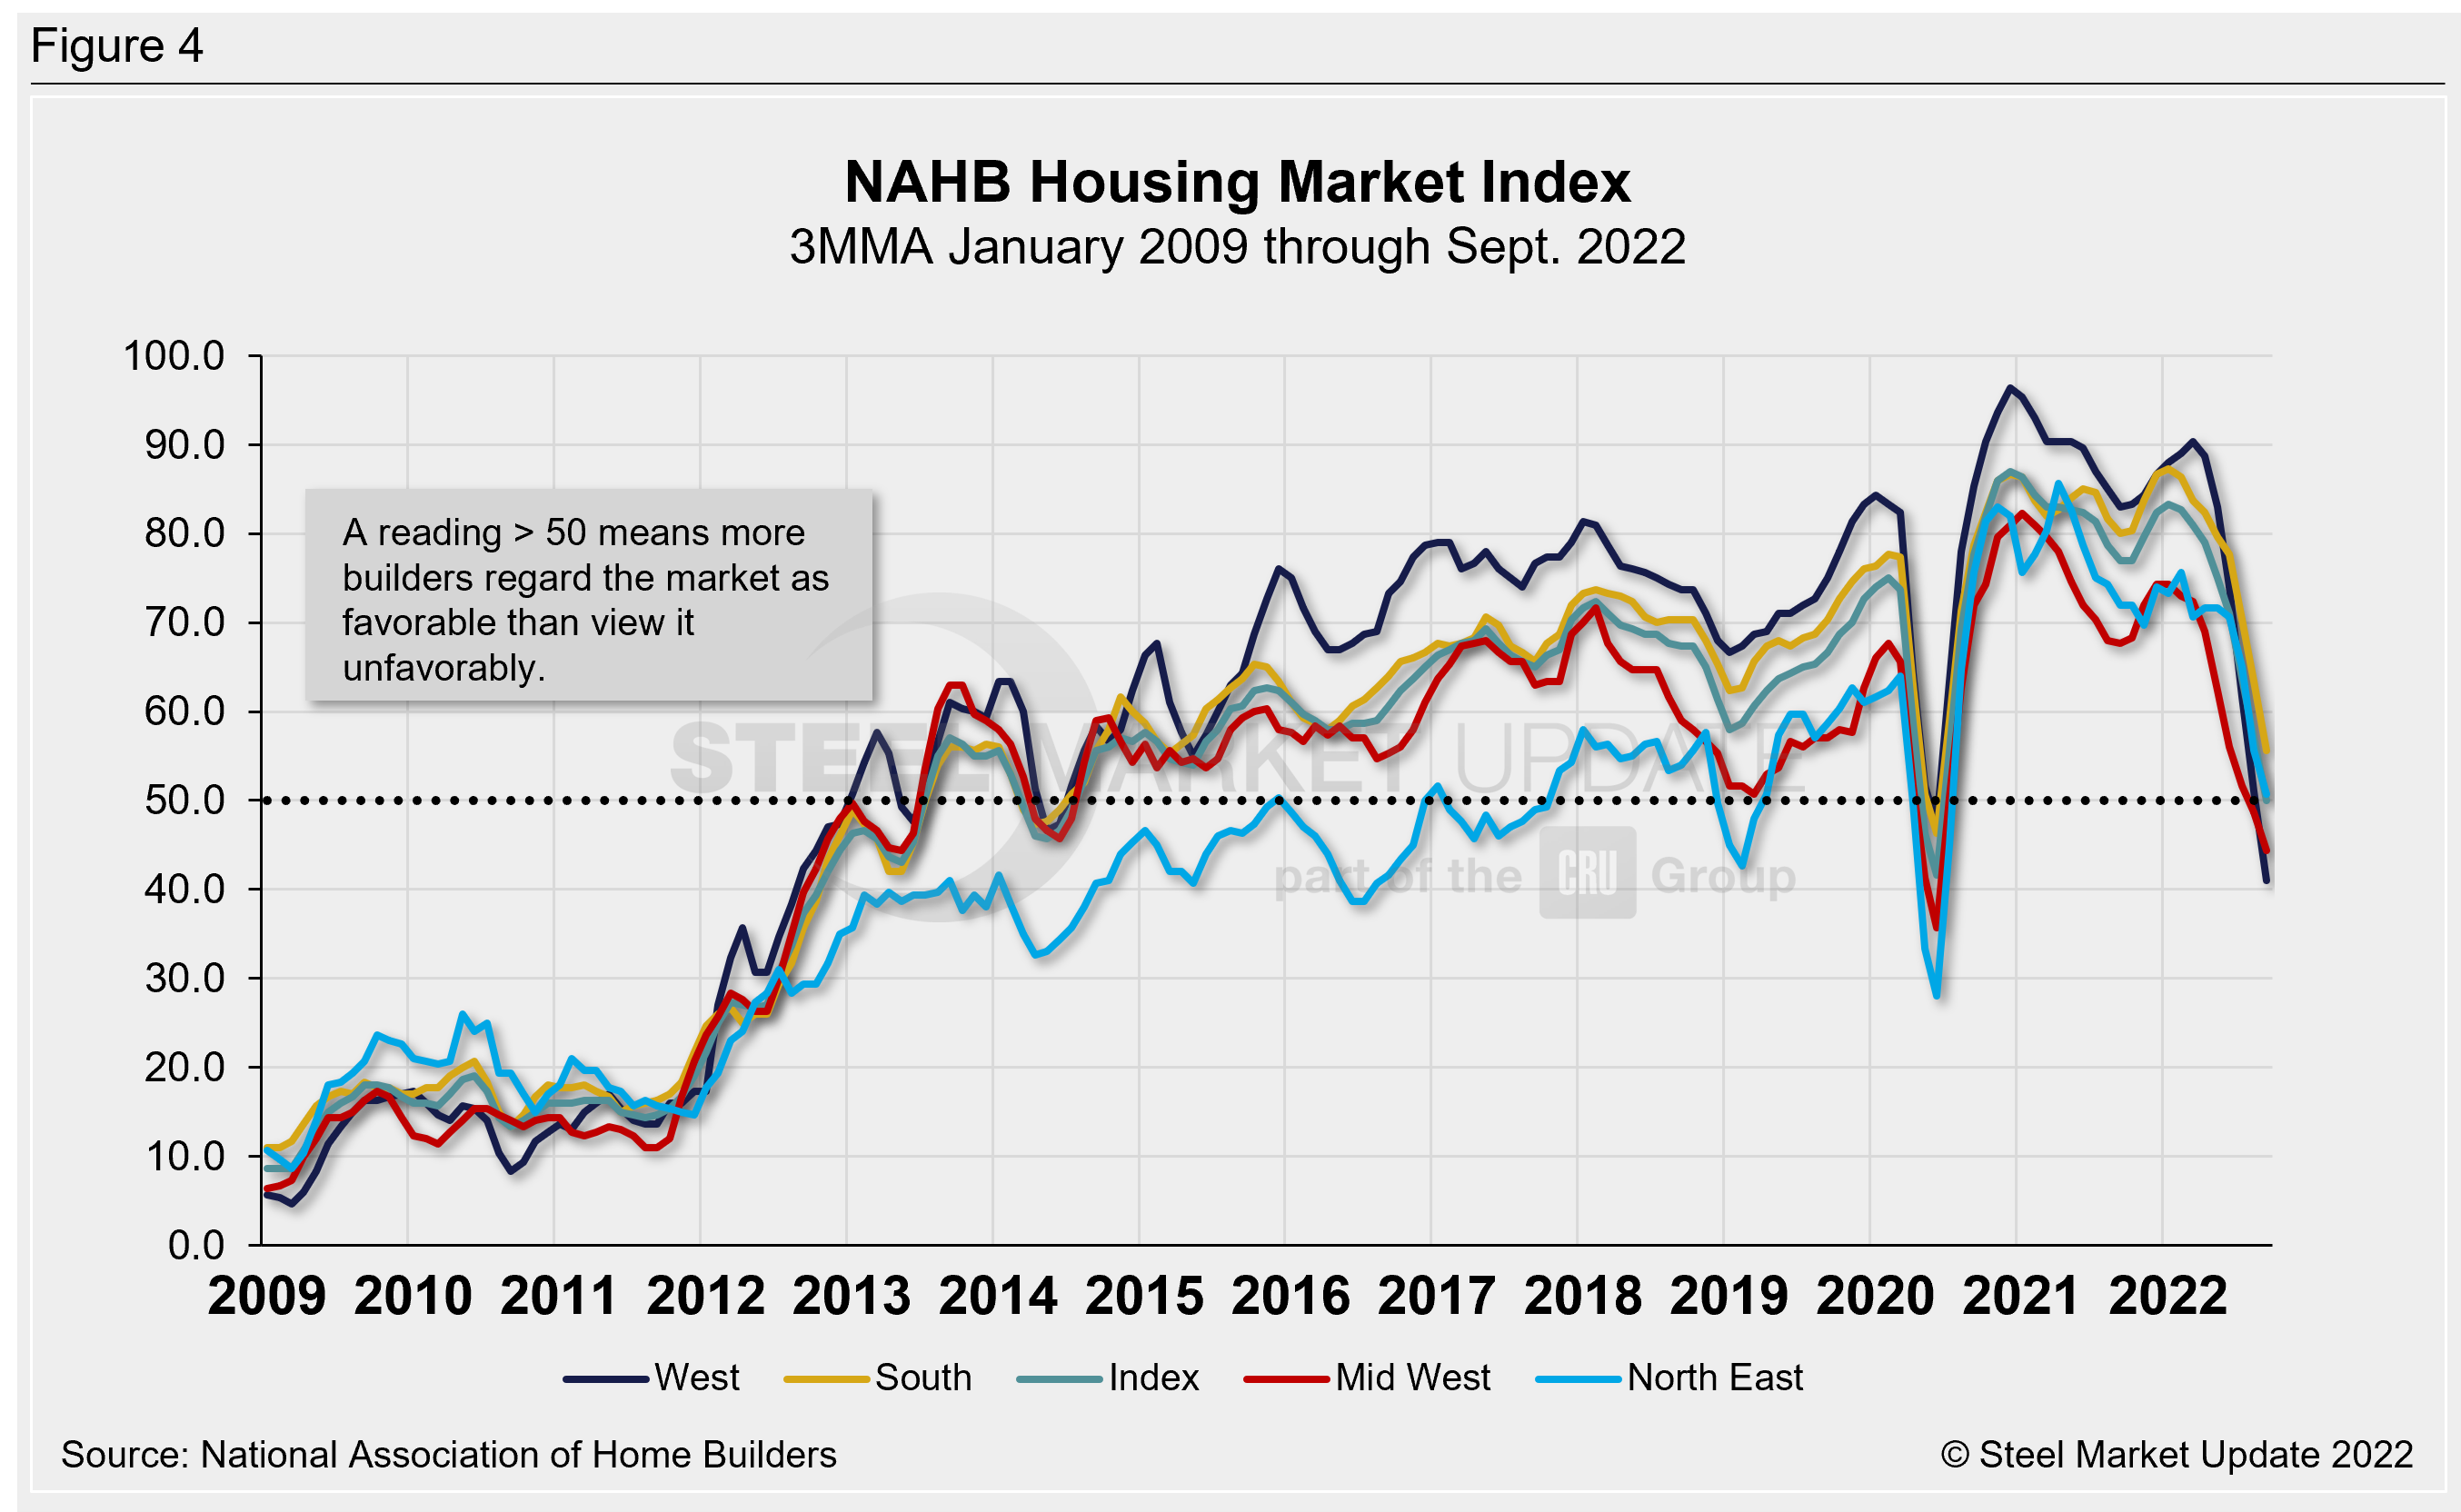
The National Association of Homebuilders (NAHB) said that prices for construction materials have increased by more than 23% in the past year, during a period of intense demand and insufficient supply. That dynamic led to building material production bottlenecks, coupled with rising inflation, which are driving construction costs higher and further delaying projects. NAHB’s Optimism Index registered 42 in September, unchanged MoM. Advance reports indicate that the index fell further in October with a reading of 38 — the lowest measure since April 2020. (Figure 4).
State and Local Construction
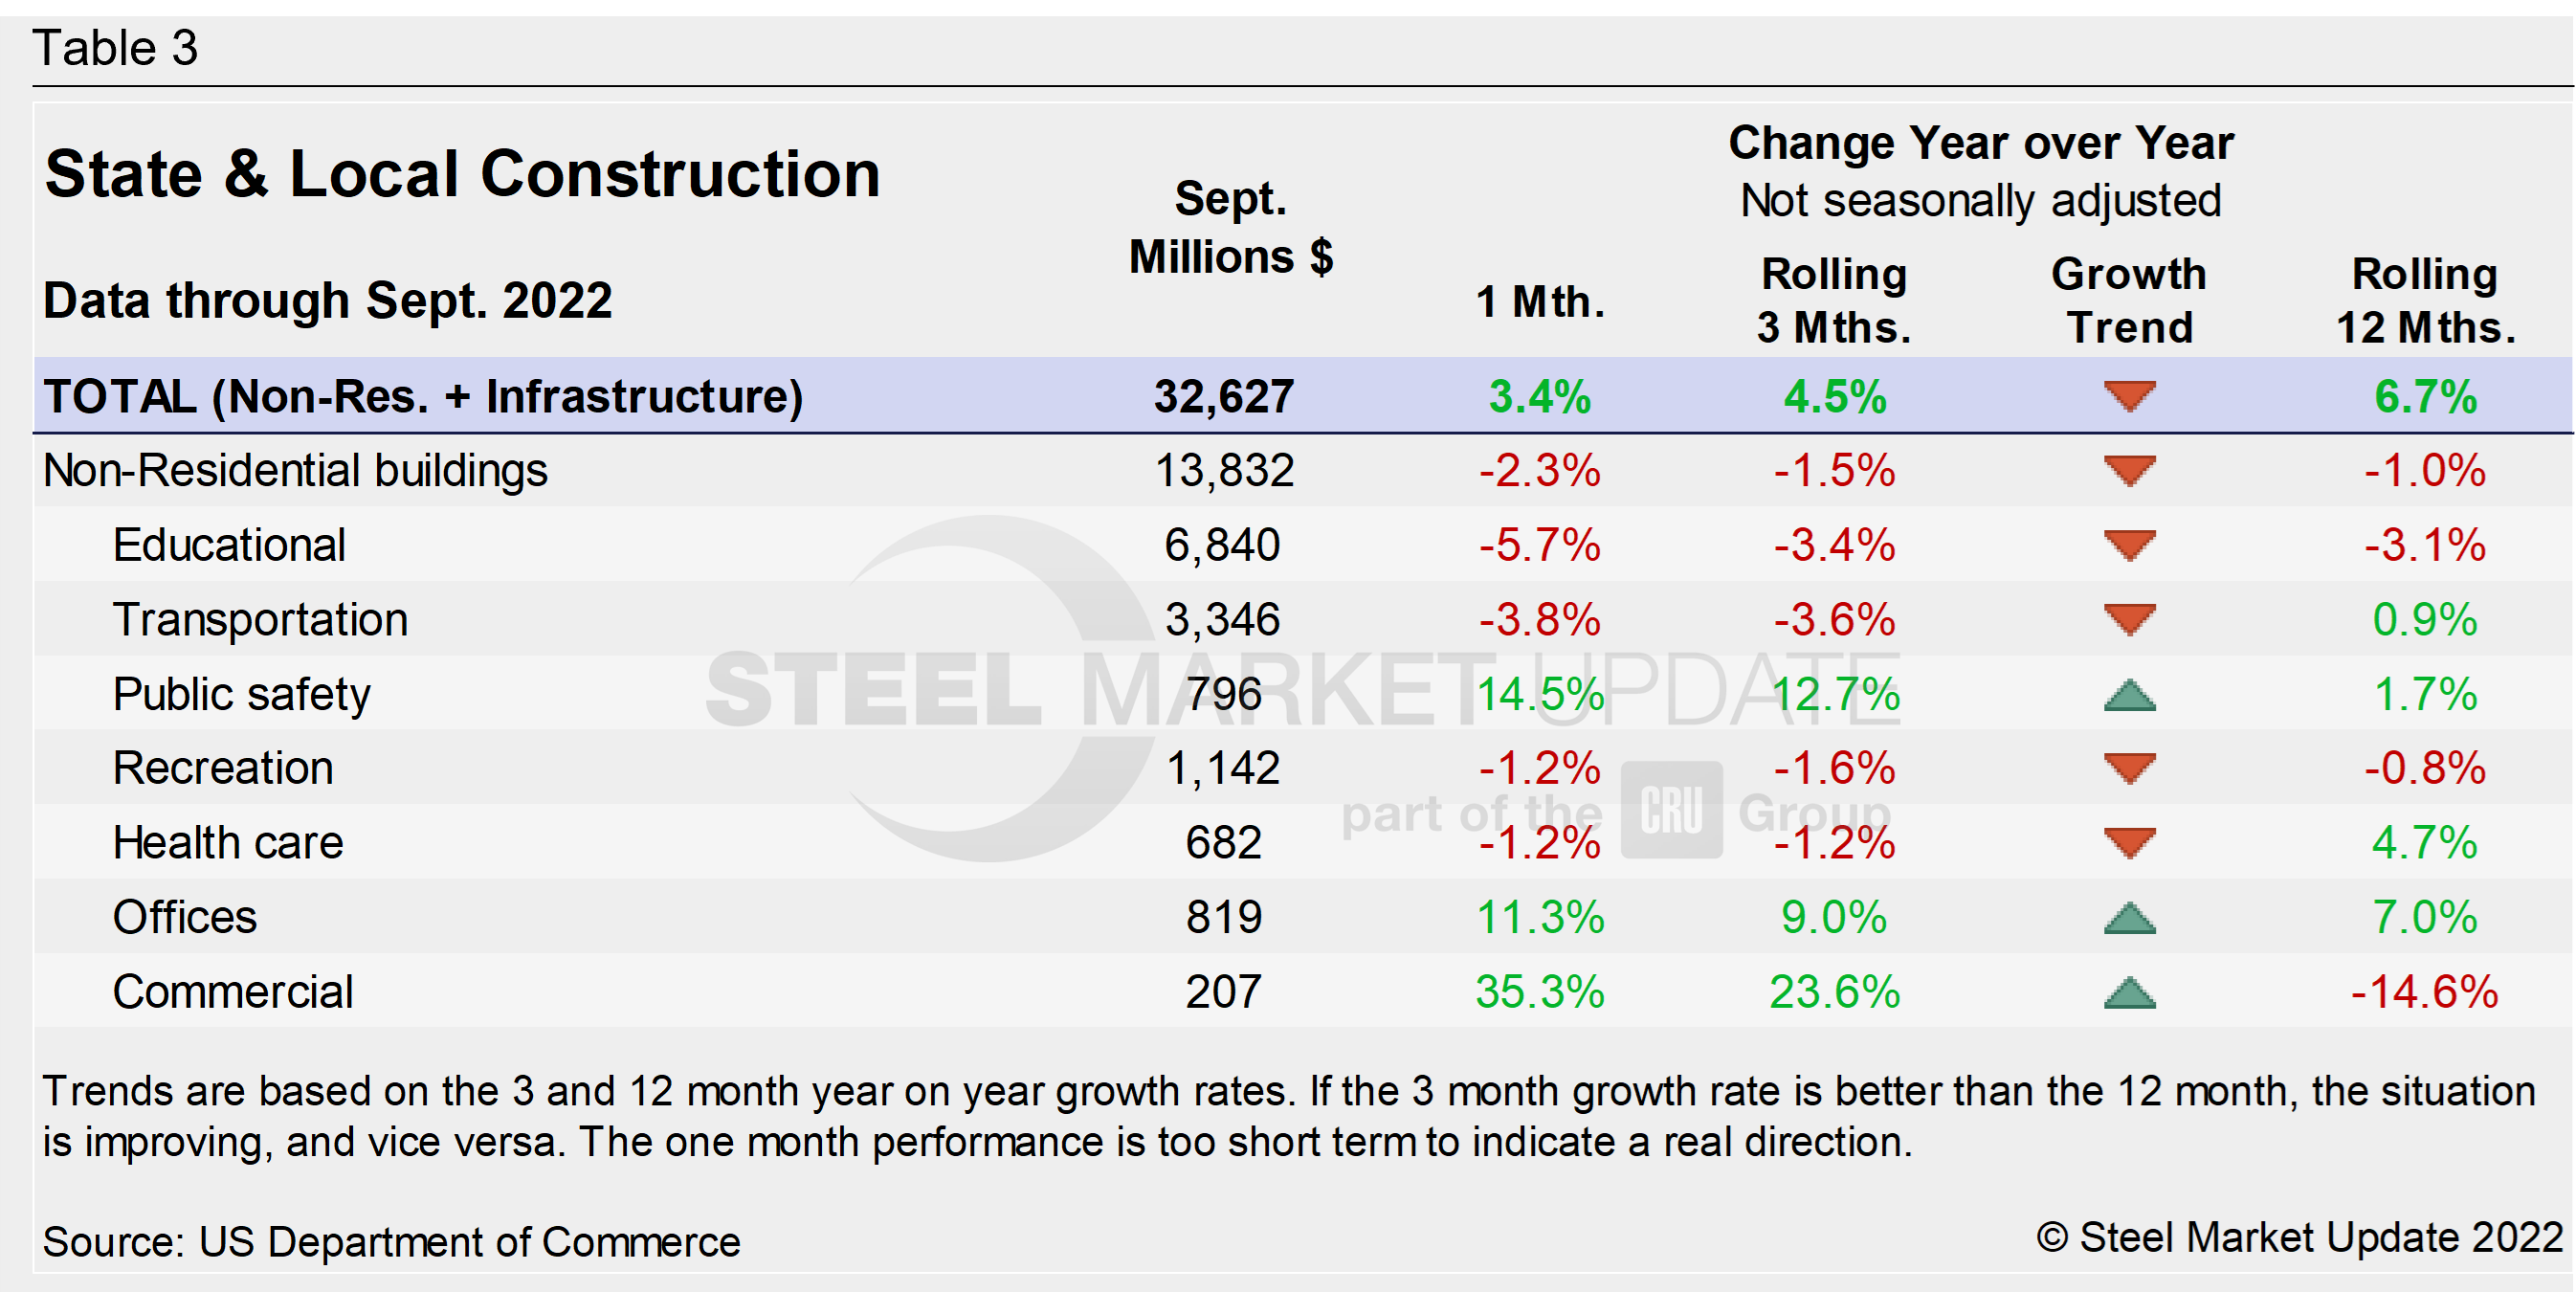
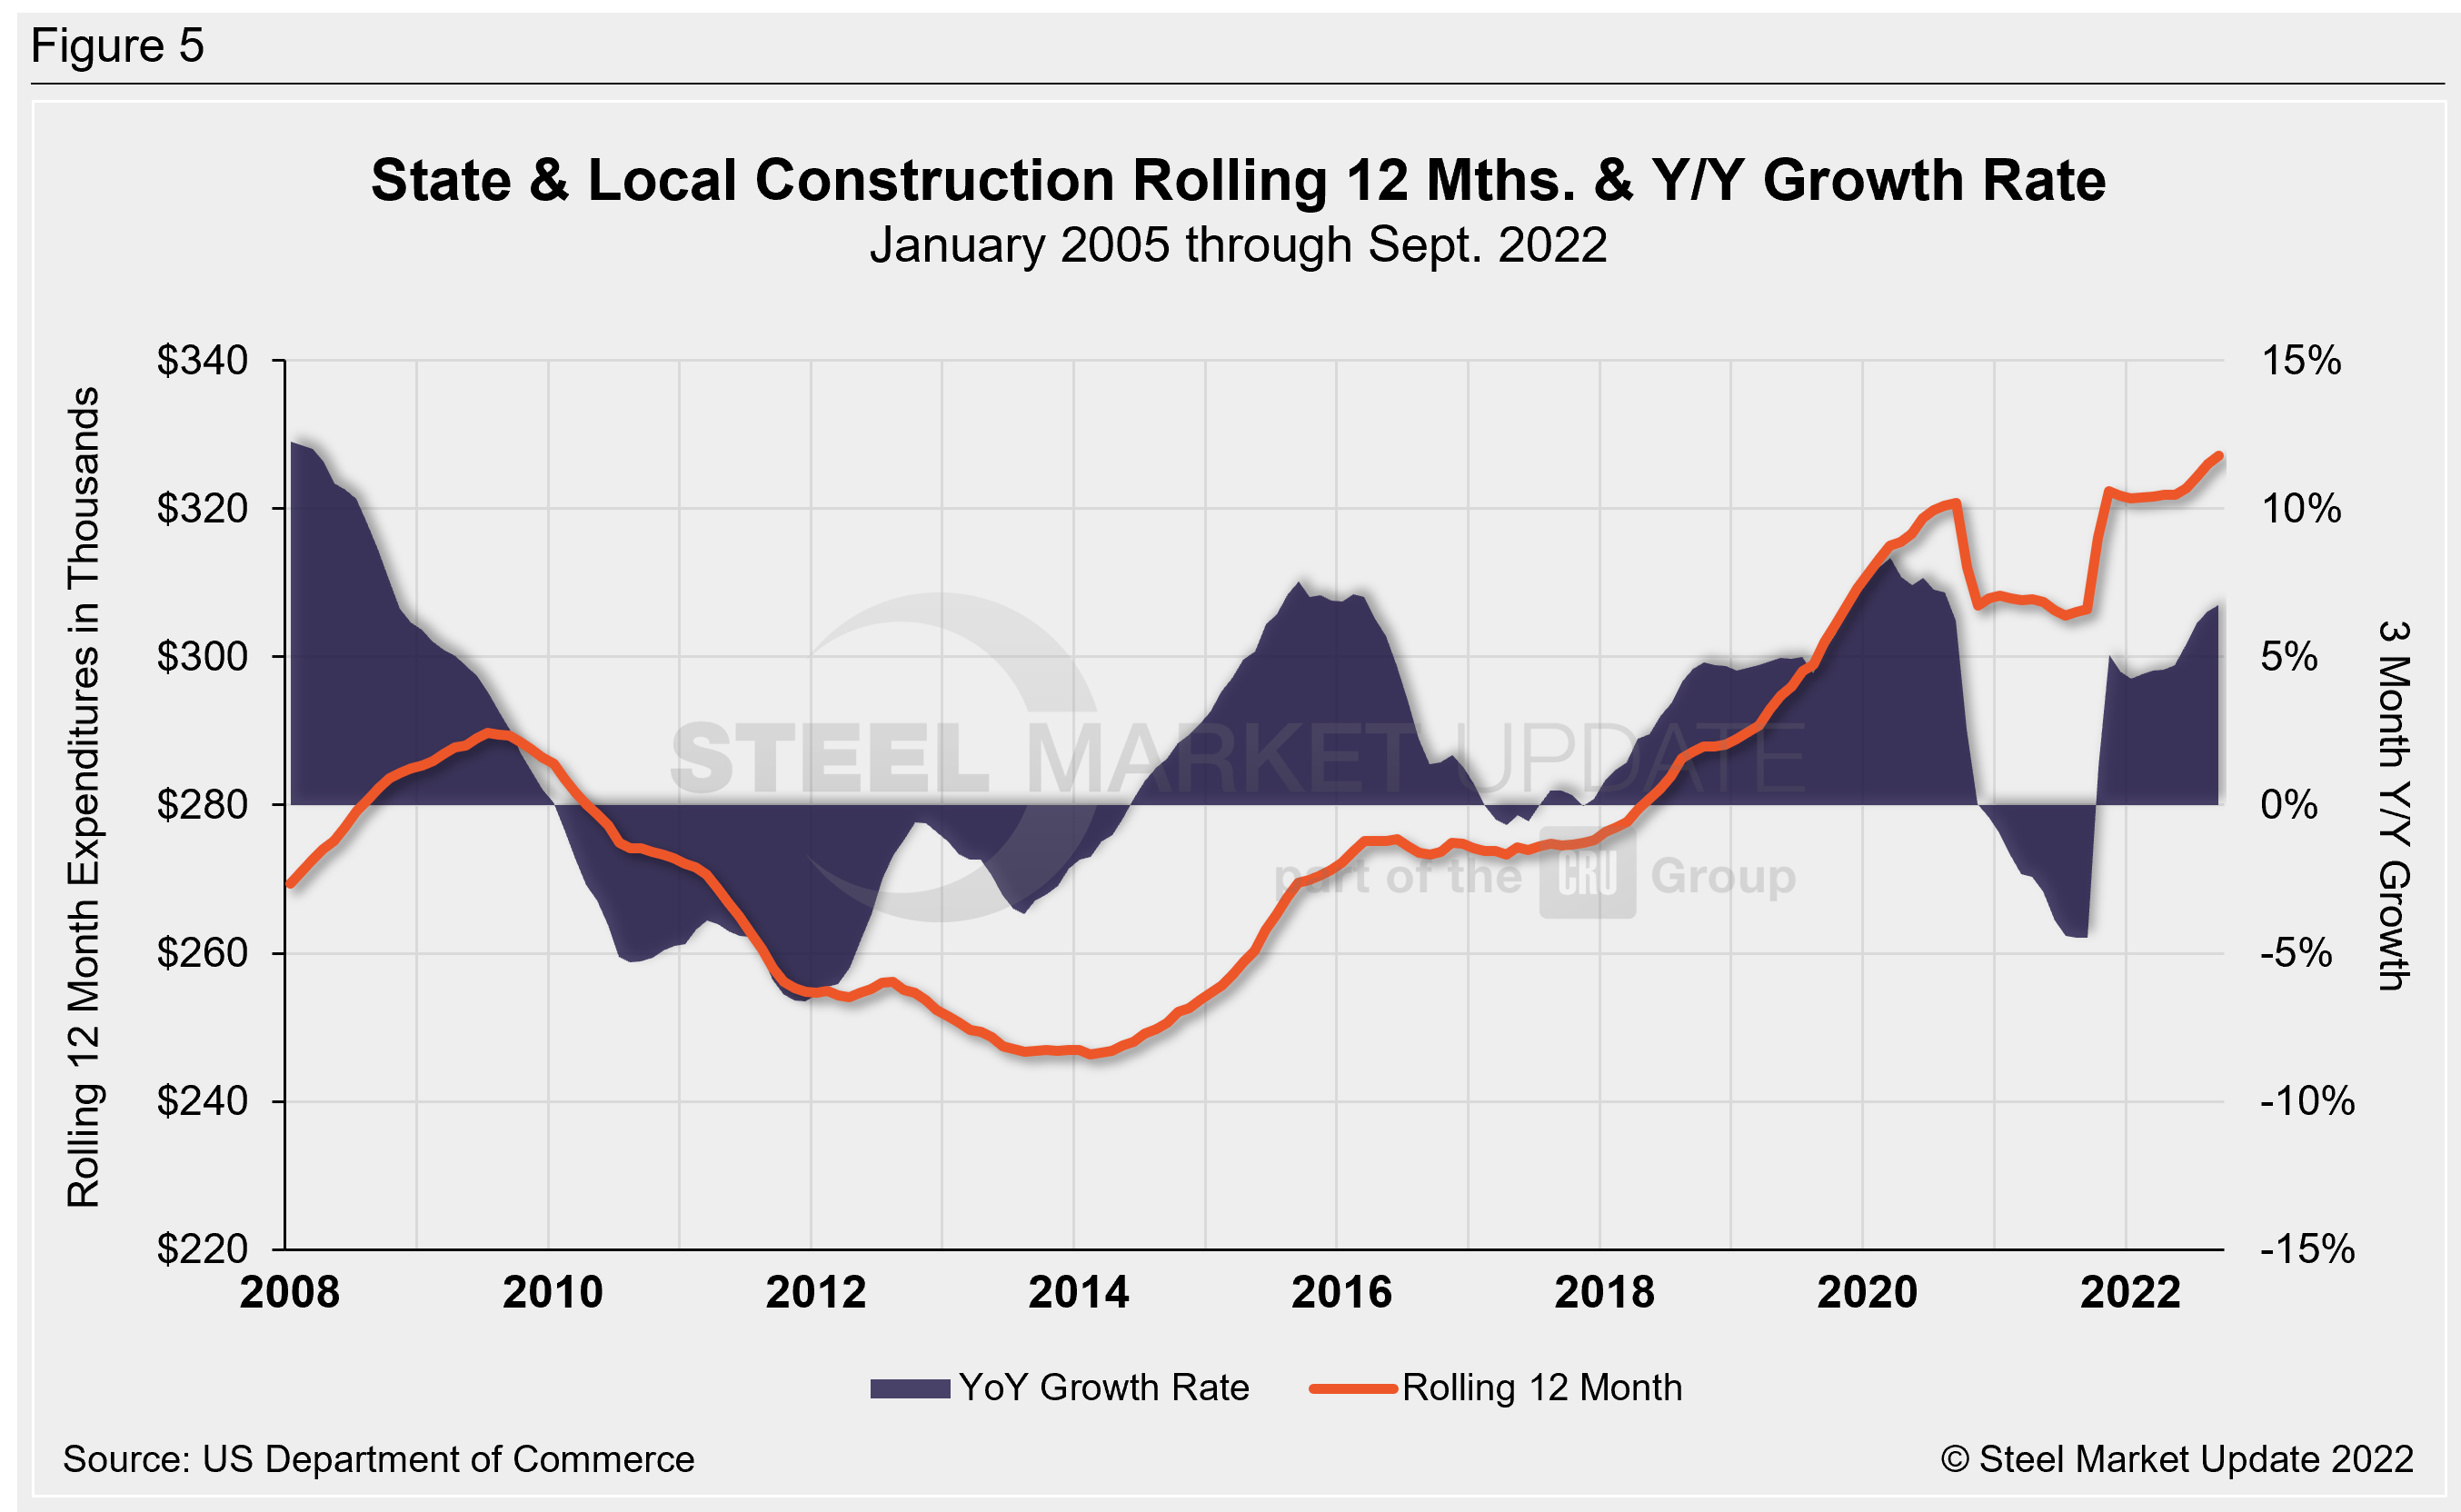
Publicly funded construction spending in September was $360.9 billion, at a seasonally adjusted rate, down 0.4% from August’s downward revised estimate of $362.1 billion. Investment in state and local government construction projects increased by 0.6%, while federal government construction spending plunged by 12.7%. (see Table 3 and Figure 5 below).
Educational construction was at a SAAR of $78.2 billion, virtually unchanged from the revised August estimate of $78.2 billion. Highway construction was at a SAAR of $108.4 billion, 1.7% above the revised August estimate of $106.6 billion.
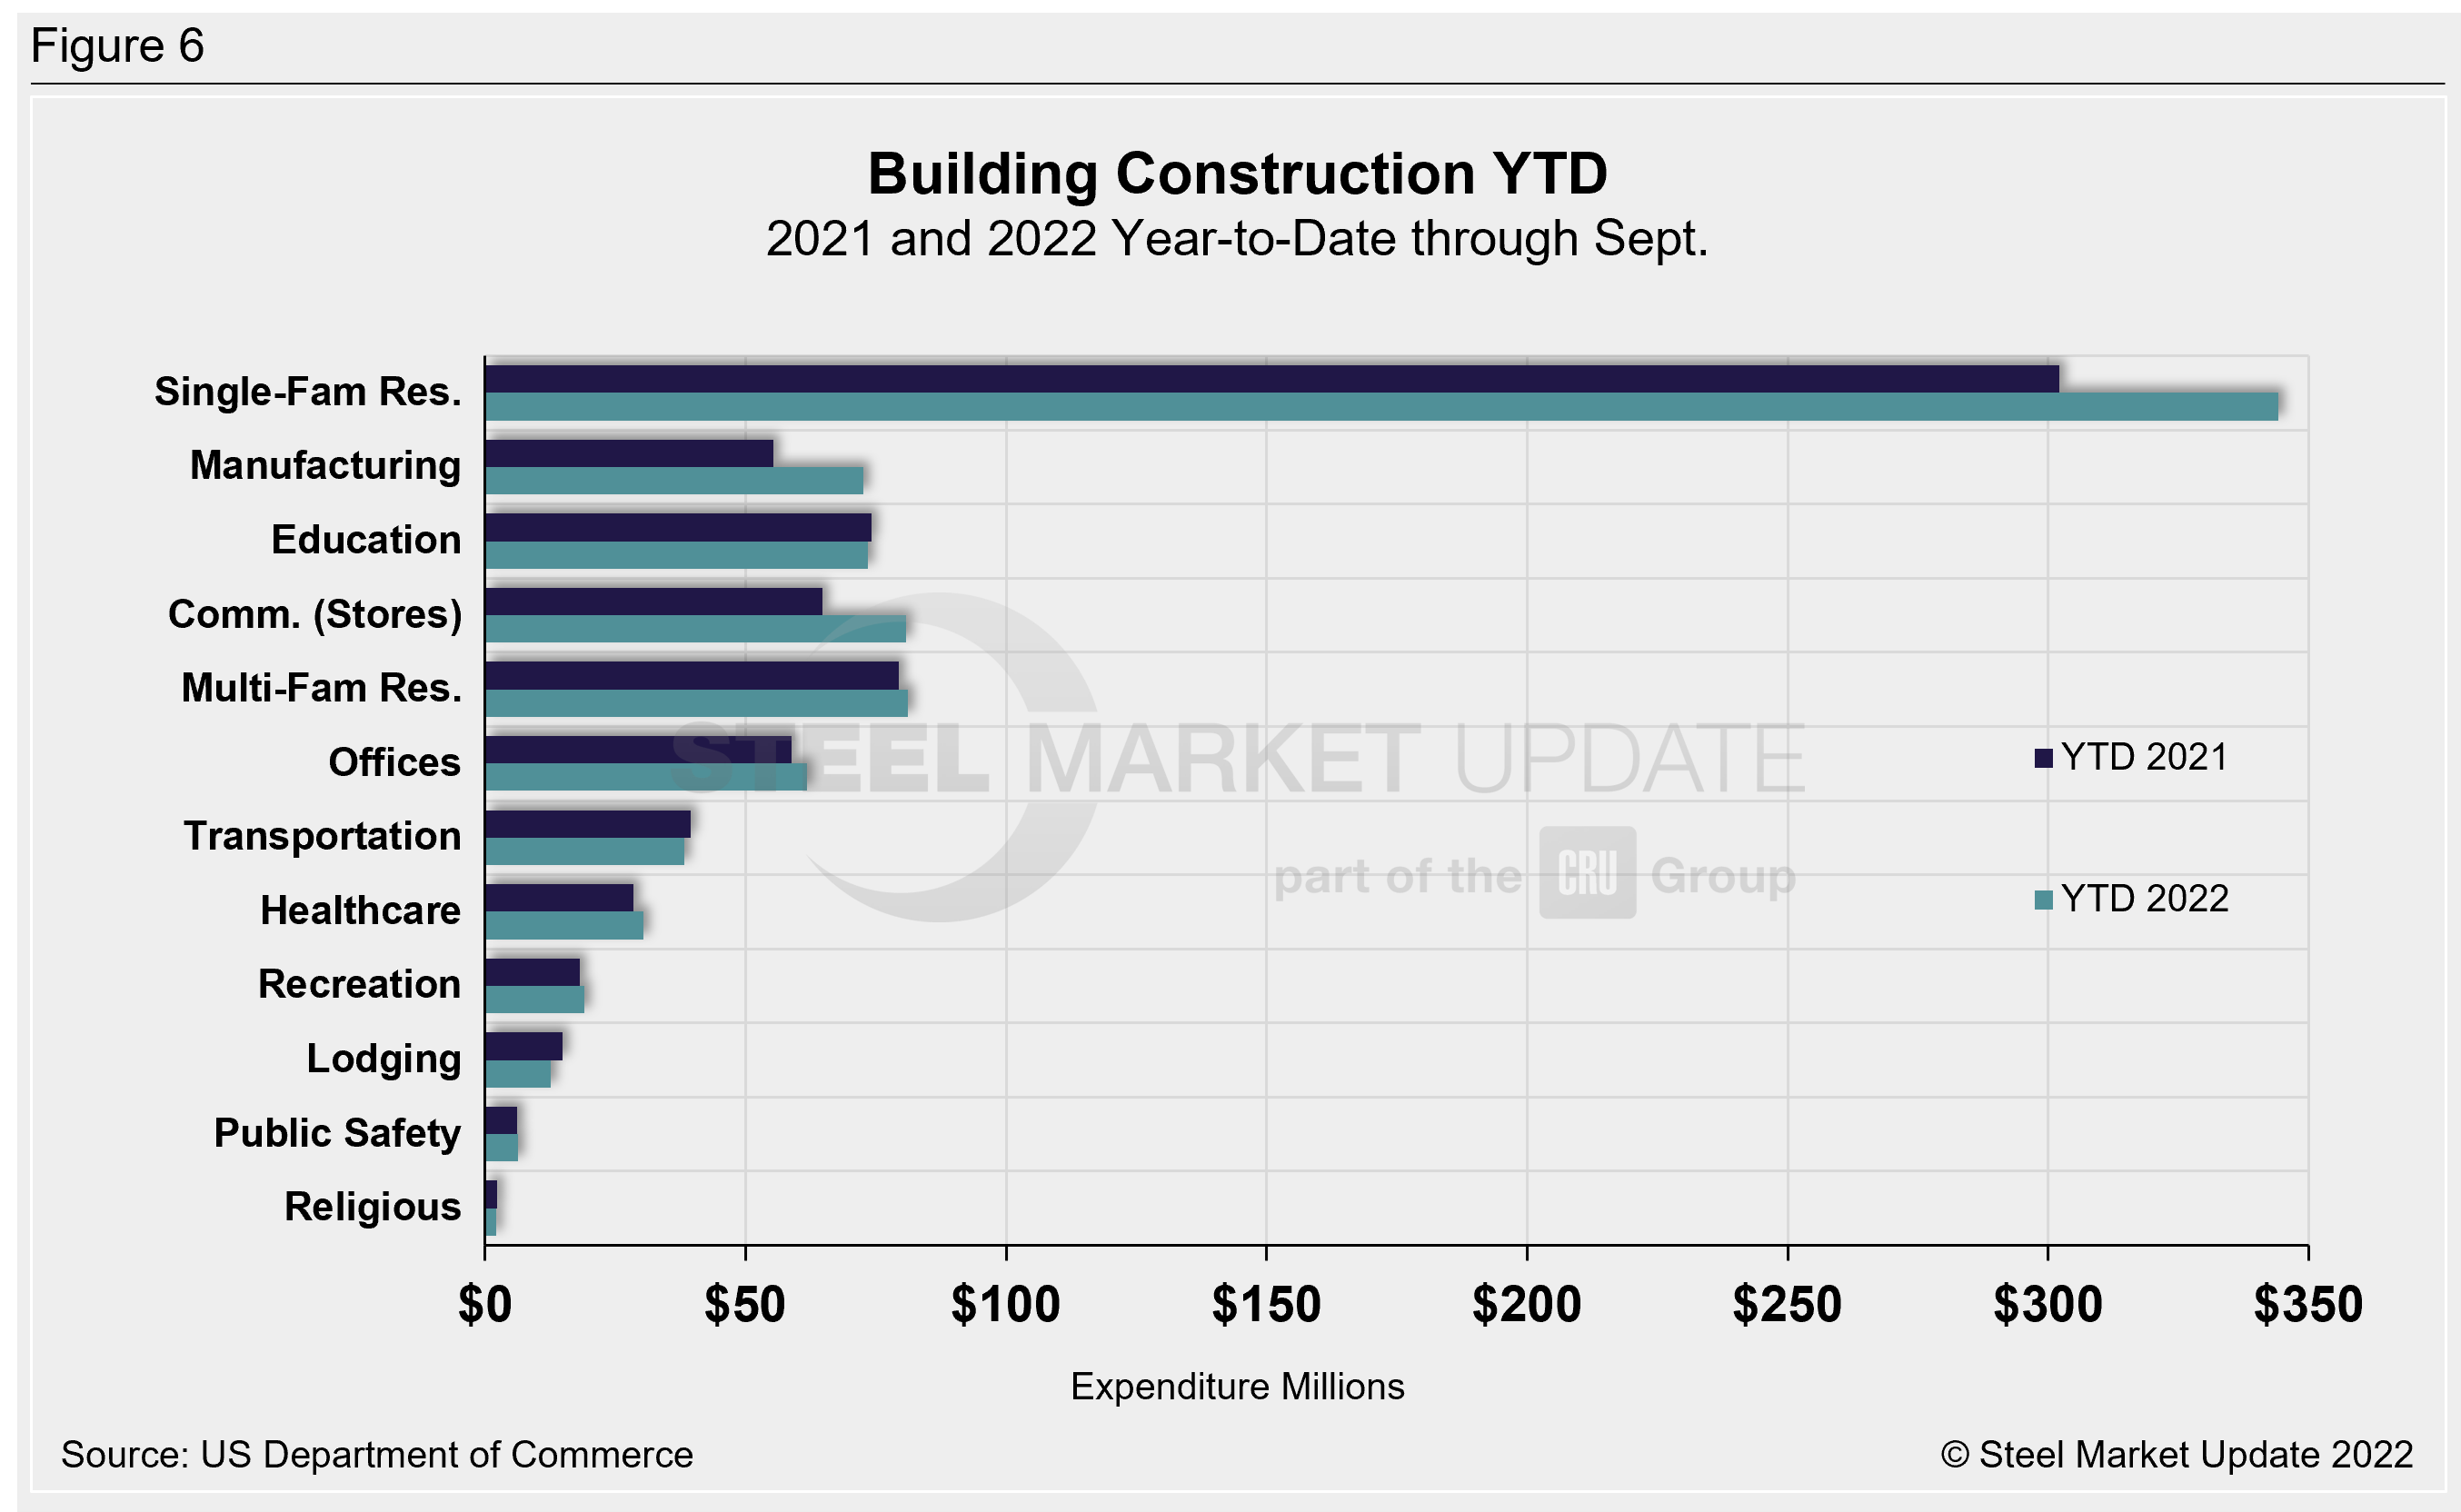
Year-to-date expenditures for construction of the various building sectors for 2021 and 2022 are compared in Figure 6. Single-family residential construction was dominant in 2021, with expenditures totaling $409.9 billion.
The trend has continued into 2022: single-family residential totaled $334.2 billion through September, 13.9% above $302.1 billion a year ago. Manufacturing (+31) had the strongest subsector growth versus last year followed by commercial (+25%). Multifamily residential grew by 2.1% and totaled $81.2 billion when compared to the same year-ago period. Lodging is behind by double digits at -14.8% YoY, followed by religious and transportation, down by 3.5% and 3.2% respectively.
Explanation: Each month, the Commerce Department issues its Construction Put in Place (CPIP) data, usually on the first working day covering activity one month and one day earlier. There are three major categories based on funding source: private, state and local, and federal. Within these three groups are about 120 subcategories of construction projects. SMU analyzes the expenditures from the three funding categories to provide a concise summary of the steel-consuming sectors.
By David Schollaert, David@SteelMarketUpdate.com