Market Segment
February 22, 2023
US Light Vehicle Sales Edge Down in January
Written by David Schollaert
US light-vehicle (LV) sales slowed to an unadjusted sales figure of 1.03 million units in January, the US Bureau of Economic Analysis (BEA) reported. Despite the month-on-month (MoM) decline, January’s total was still 4.2% higher year-on-year (YoY), and the sixth consecutive month to see YoY increases in sales.
LV sales were up 17.73% MoM in December on an annualized basis, surging to 15.7 million units, and ahead of the consensus forecast of 15.5 million.
After rising to a nine-month high in October, vehicle sales have now declined repeatedly through January. Vehicle sales began the year with a notable uptick vs. year-ago levels. The 20-month seasonally adjusted annual rate (SAAR) high was in part due to fewer year-end holiday deals and extreme weather events that likely pushed some purchases into the new year.
Census expectations are for the SAAR to moderate slightly as seasonal trends recede but are likely to remain above last year’s level.
Passenger vehicle sales increased 2.9% YoY last month while sales of light-trucks ticked up by 4.5% YoY. Light-trucks accounted for 80% of January’s sales, roughly equal to its share in January 2022.
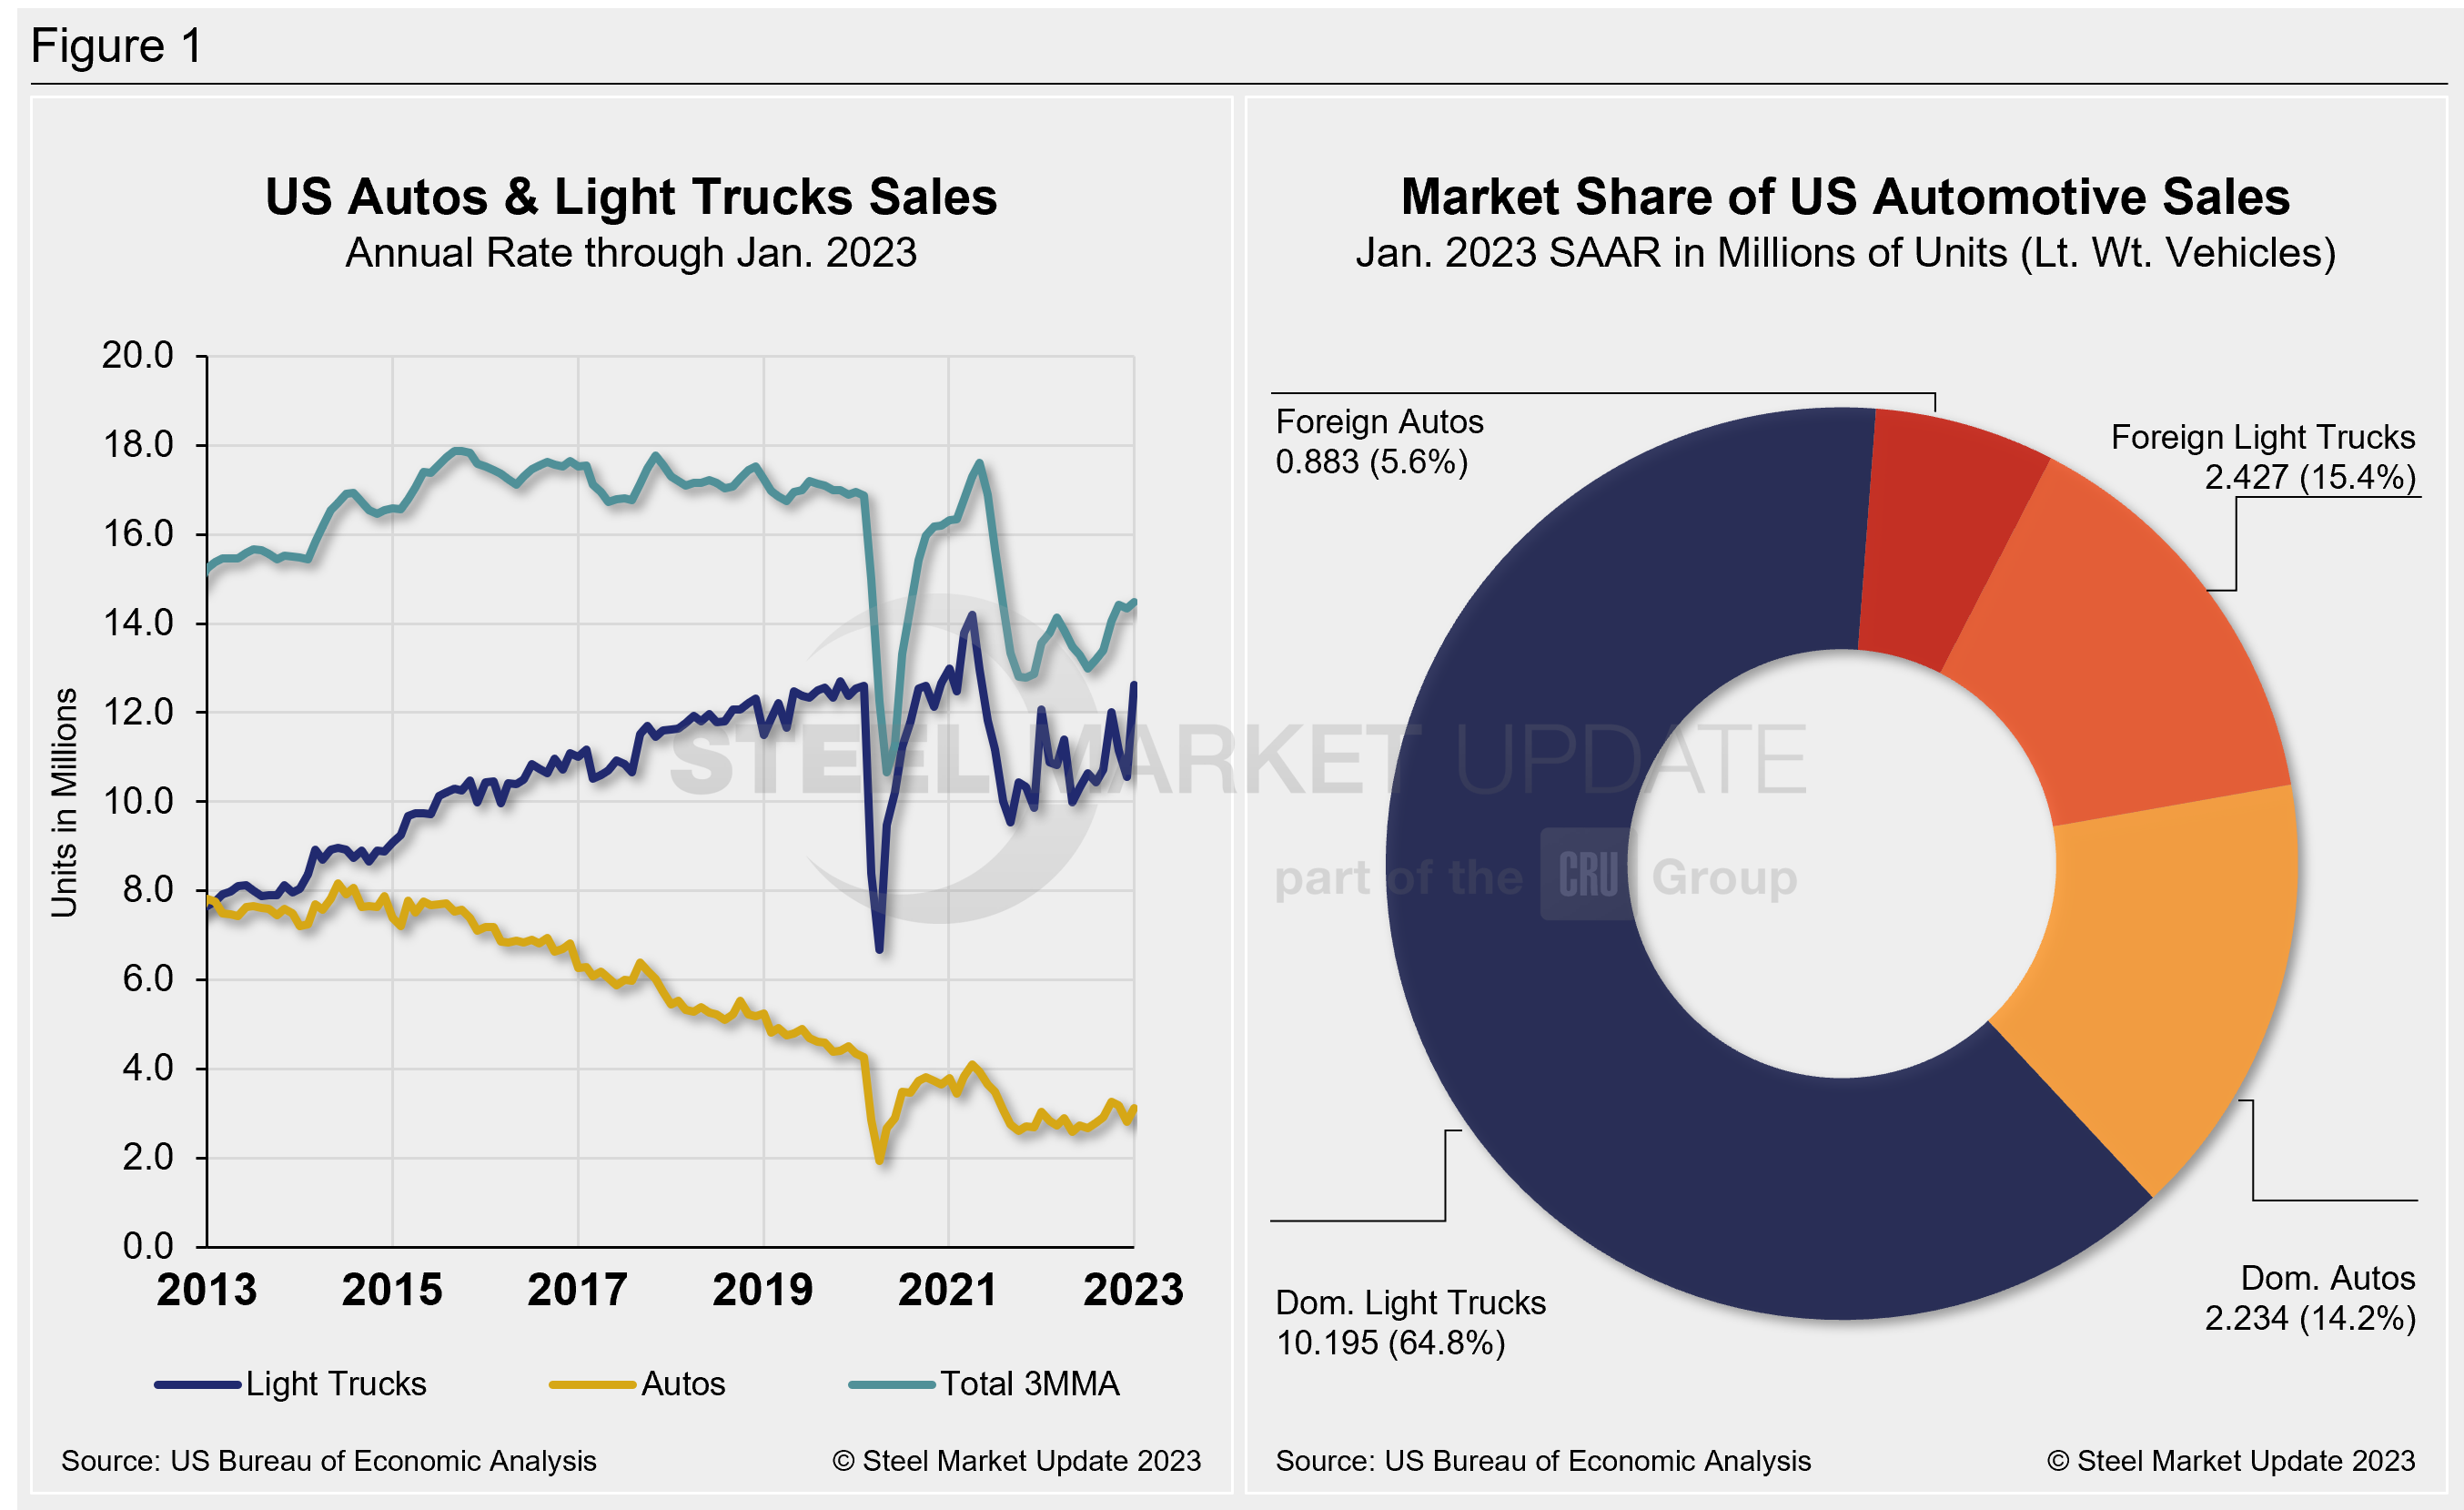
Below in Figure 1 is the long-term picture of sales of autos and lightweight trucks in the US from 2013 through January 2023. Additionally, it includes the market share sales breakdown of last month’s 15.7 million vehicles at a seasonally adjusted annual rate.
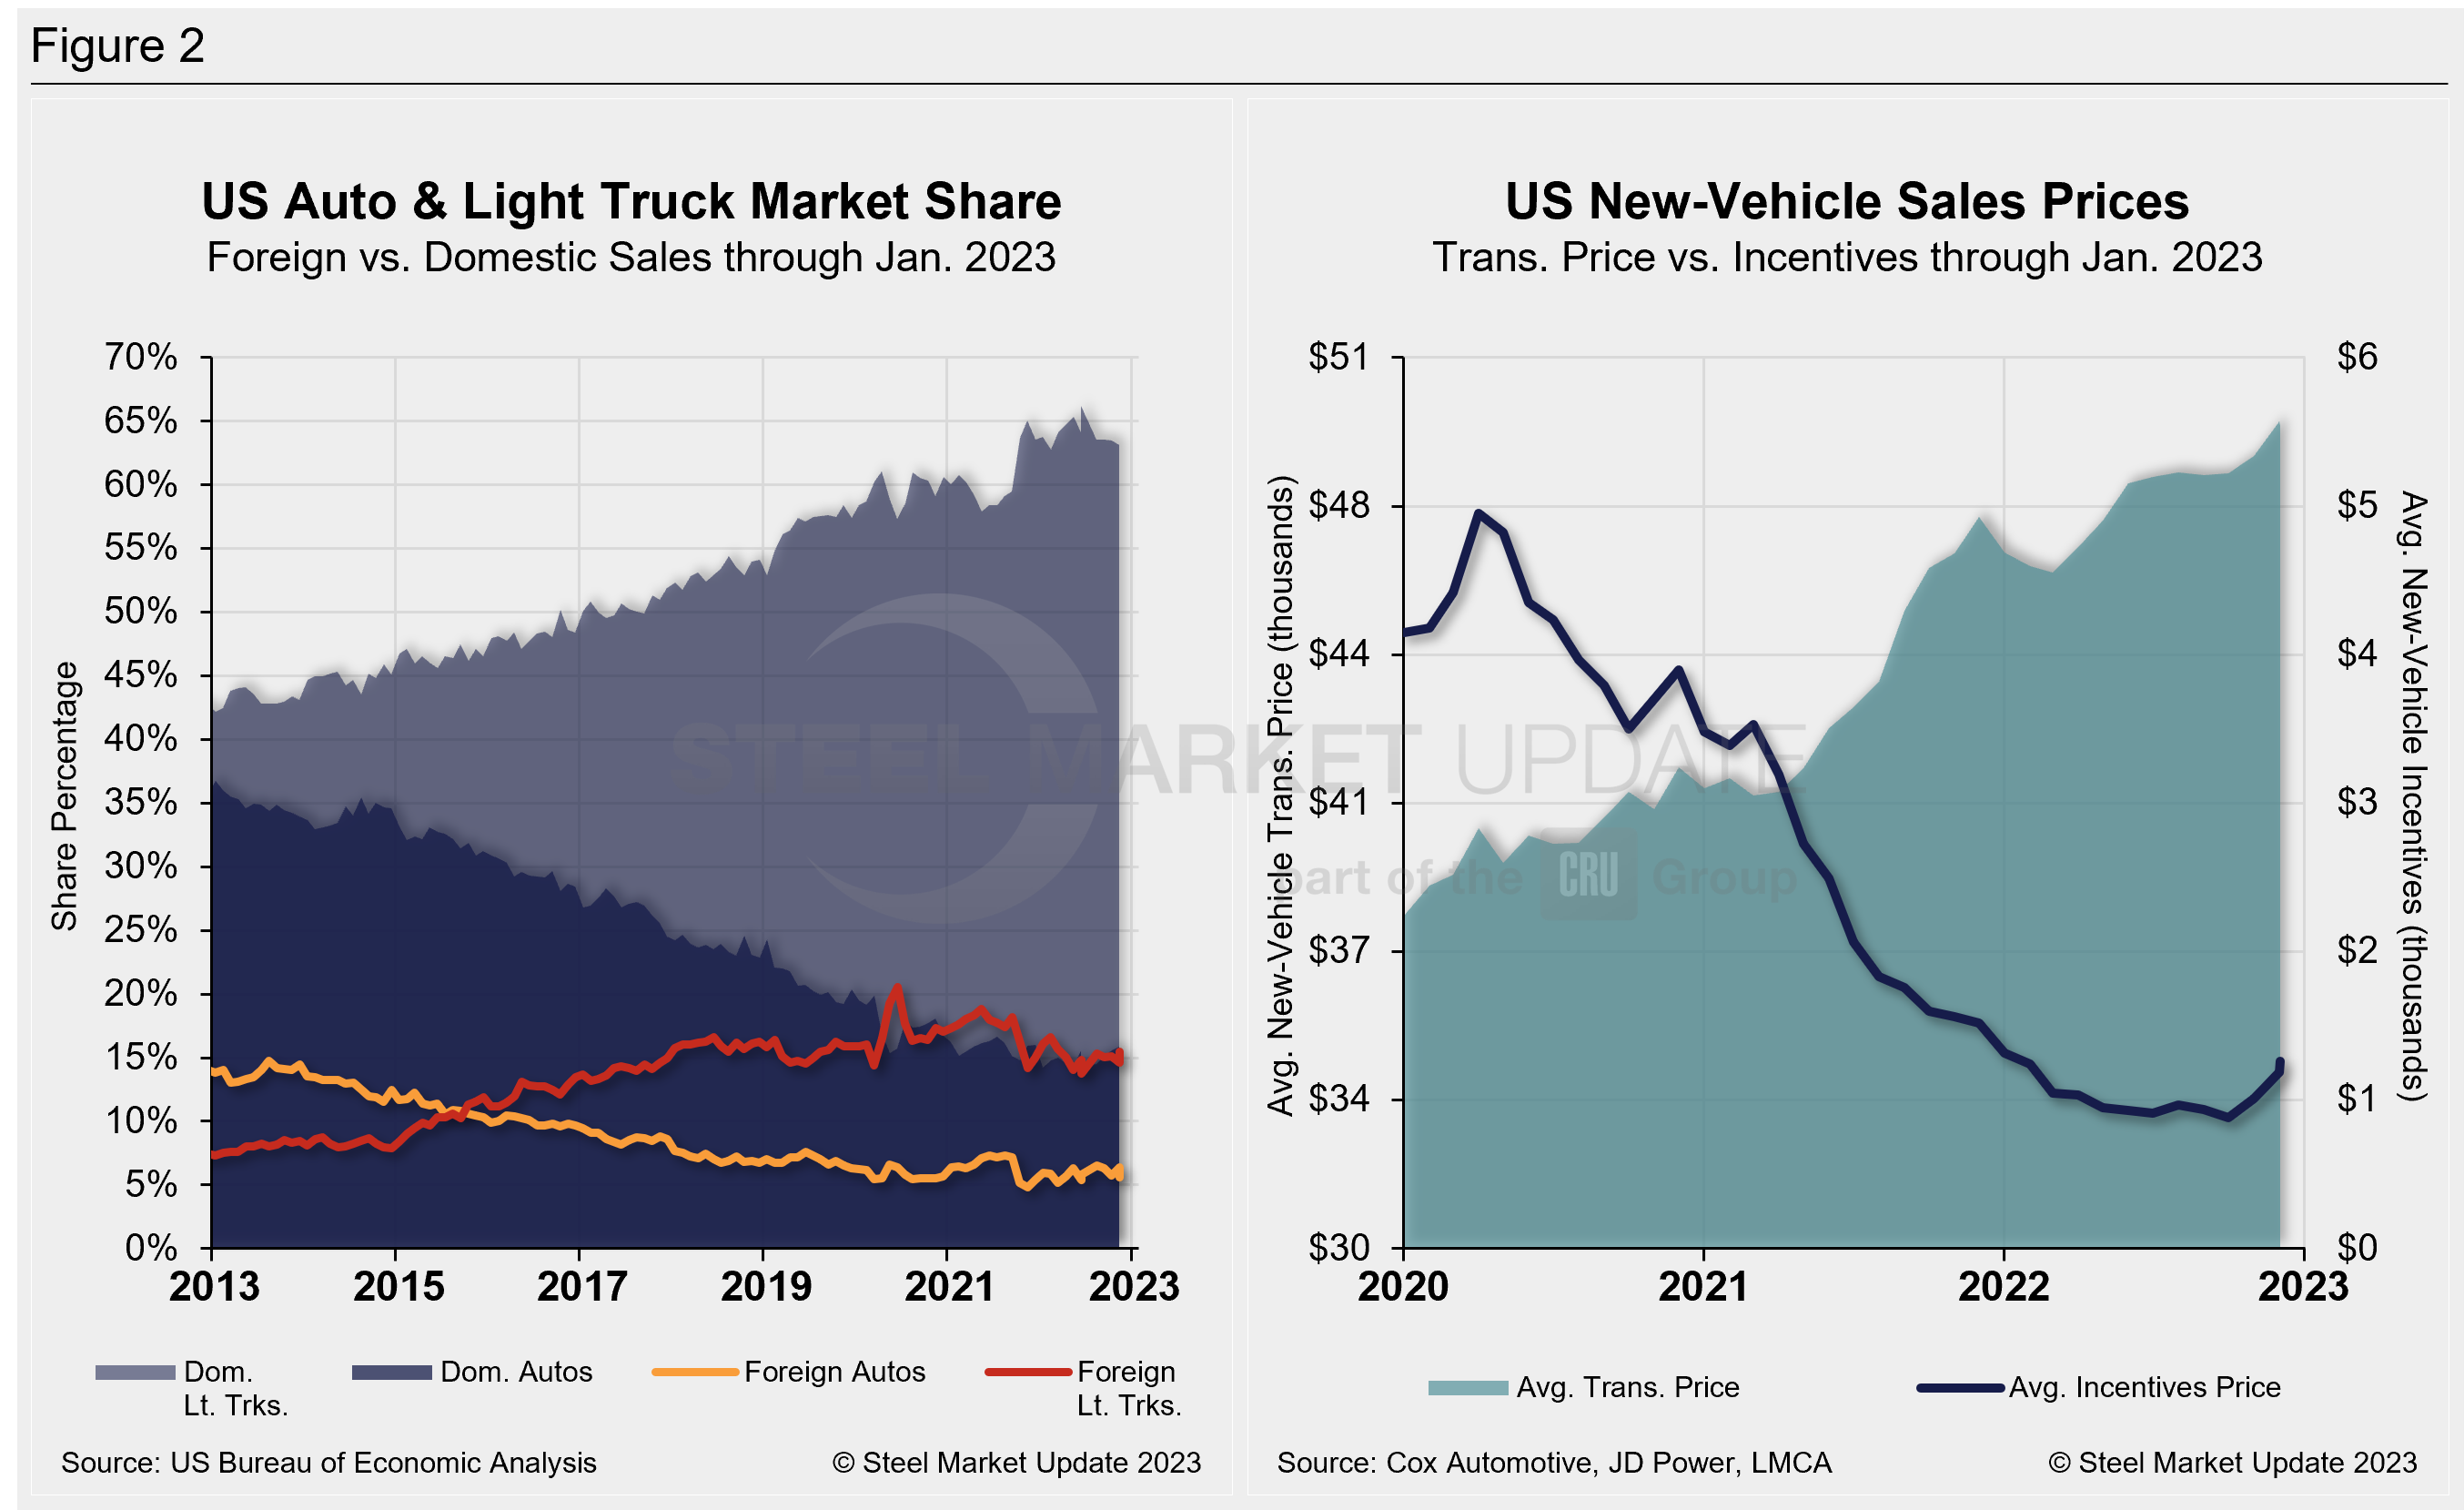
The new-vehicle average transaction price (ATP) was $49,388 in January, down from the all-time high of $49,507 in December. ATPs were just 0.2% lower (-$119) in January vs. the prior month but 6.4% (+$2,984) above the year-ago period, according to Cox Automotive data.
Incentives increased again for the third straight month. Last month’s incentives were $1,260, up from $1,187 in December. With the MoM increase, incentives remained above the $1,000 mark for the third time in nine months and roughly 2.7% of the average transaction price. Incentives are down 4.7%, or $59 YoY.
In January, the annualized selling rate of light trucks was 12.622 million units, up 19.5% vs. the prior month and still 4.6% better YoY. Auto annualized selling rates saw similar dynamics, up 10.9% and 2.6%, respectively, in the same comparisons.
Figure 2 details the US auto and light-truck market share since 2013 and the divergence between average transaction prices and incentives in the US market since 2020.
Canadian light vehicle sales were estimated to have increased by 1.6% YoY, to 96,000 units in January, according to LMC Automotive data. The selling rate is thought to have increased to 1.8 million units annually, up from 1.5 million units annually in December. Despite a strong January performance, limited inventory is likely still holding back sales, said LMC Automotive (LMCA).
Mexican light vehicle sales were up by 20% YoY in January to 94,000 units. The selling rate also increased to 1.2 million units annually, from 1.1 million units in December, the highest rate since February 2020.
Editor’s Note: This report is based on data from the US Bureau of Economic Analysis (BEA), LMC Automotive, JD Power, and Cox Automotive for automotive sales in the US, Canada, and Mexico. Specifically, the report describes light vehicle sales in the US.
By David Schollaert, david@steelmarketupdate.com