Manufacturers/End Users
November 15, 2024
US light-vehicle sales accelerate in October
Written by David Schollaert
According to data from the US Bureau of Economic Analysis, US light-vehicle (LV) sales accelerated to an unadjusted 1.33 million units in October, a rise of 1.7% from September and 10.6% from a year ago.
On an annualized basis, LV sales were 16.0 million units in October, up from 15.7 million units the month prior and well ahead of a consensus forecast of 15.6 million.
Market conditions continue trending positively. Robust growth in retail sales helped to offset disruptions related to extreme weather in the Southeast. October’s increased sales were also likely driven by the Fed’s half-point interest rate cut in September.
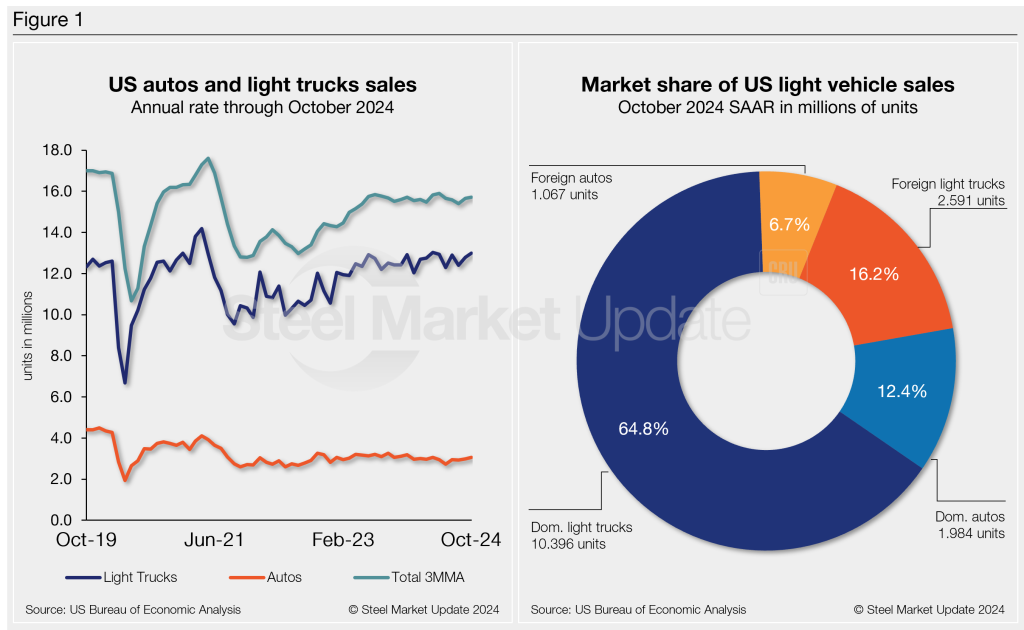
Auto sales rose 5.7% y/y, while light-truck sales jumped 11.8%. Light trucks accounted for 81% of October’s total sales, slightly above its 80% share last year.
October’s average daily selling rate (DSR) was 49,084 vehicles – calculated over 27 days – up 2.4% from the 47,926-unit daily rate a year ago.
Figure 1 below shows the long-term picture of US sales of autos and lightweight trucks from 2019 through October 2024. Additionally, it includes the market share sales breakdown of last month’s 16.0 million vehicles at a seasonally adjusted annual rate.
While auto production has recovered from the pandemic, it remains behind 2019 levels. This continues to impact average transaction prices (ATP) for new vehicles, with a lack of base trim models.
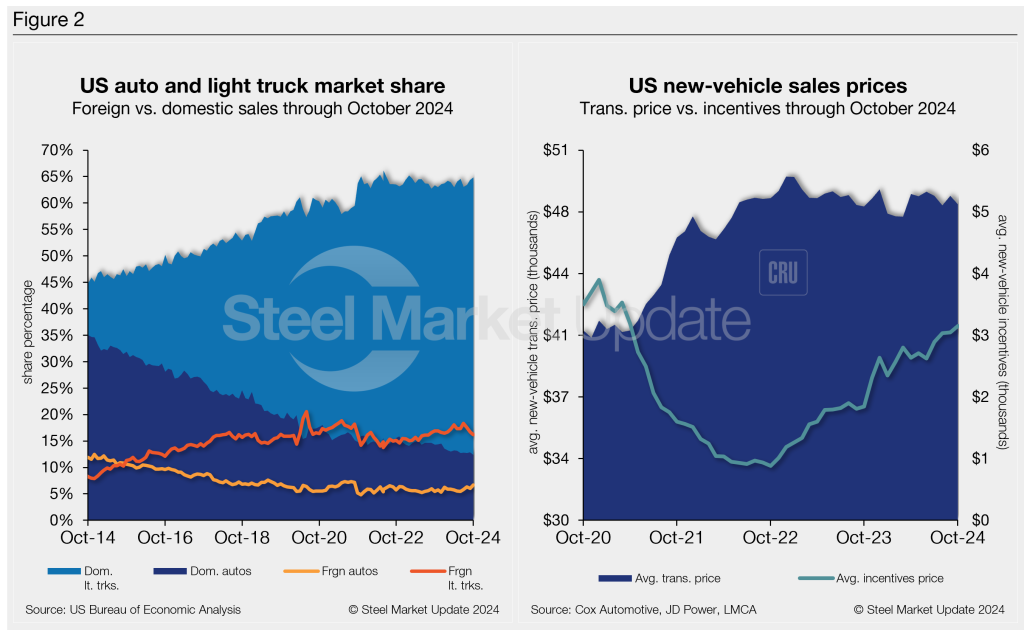
Average ATP year-to-date was $48,001, a whopping 27.6% (+$10,395) above 2019’s ATP, according to data from Cox Automotive. October’s ATP of $47,936 was down 1.0% m/m but 0.3% (+$139) higher y/y.
Incentives rose 3.3% m/m, reaching a 43-month high of $3,149. Incentives now represent roughly 6.6% of the ATP. Compared to last year, incentives are up more than 70%, or $1,302.
The annualized selling rate of light trucks for October was 12.987 million units, up 1.6% vs. the prior month and 4.6% higher y/y. Annualized auto selling rates increased by 2.2% m/m but were even with last year.
Figure 2 details the US auto and light truck market share since 2014 and the divergence between average transaction prices and incentives in the US market since 2020.
Editor’s note: This report is based on data from the US Bureau of Economic Analysis (BEA), LMC Automotive, JD Power, and Cox Automotive for automotive sales in the US, Canada, and Mexico. Specifically, the report describes light-vehicle sales in the US.