Market Data
January 16, 2025
January energy market update
Written by Brett Linton
In this Premium analysis we cover North American oil and natural gas prices, drilling rig activity, and crude oil stock levels. Trends in energy prices and active rig counts are leading demand indicators for oil country tubular goods (OCTG), line pipe, and other steel products.
The Energy Information Administration (EIA) released their January Short-Term Energy Outlook (STEO) earlier this week. Their latest forecast predicts crude oil prices will see little movement across the year and slightly ease into 2026 as growing production outweighs demand. Meanwhile, natural gas prices are expected to increase over the next two years as rising demand surpasses production growth. Click here to read the full January STEO report covering energy spot prices, production, inventories, and more.
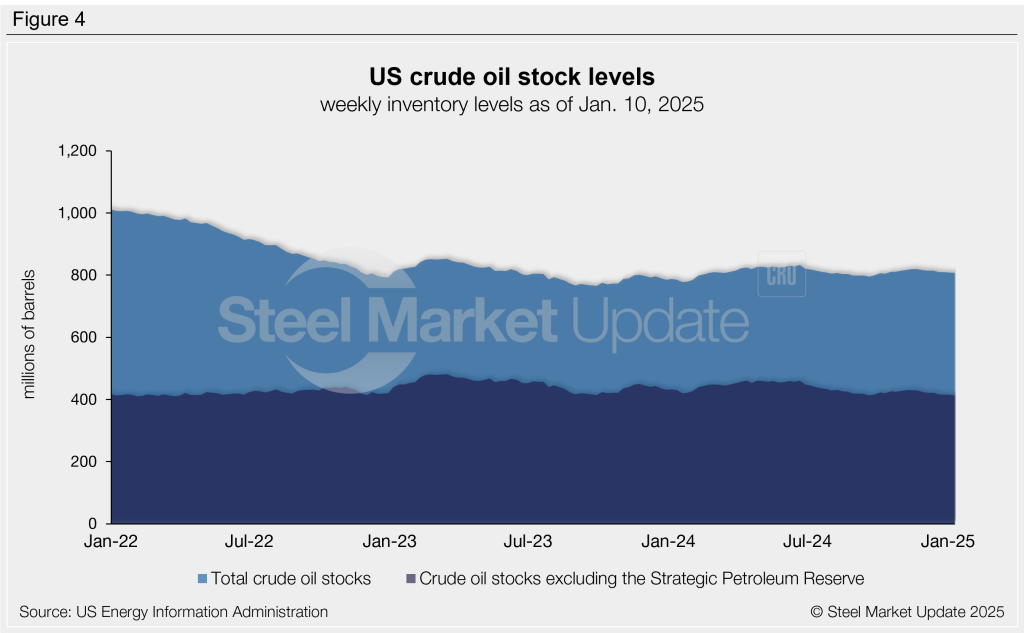
Oil spot prices
The weekly West Texas Intermediate oil spot market price has trended higher in recent weeks but remains in the $70-90 per barrel (b) range generally observed in the last two and a half years. Spot prices recently fell to a near three-year low of $68.38/b in mid-November. The latest spot price has recovered to a three-month high of $75.14 as of Jan. 10 (Figure 1).
The January STEO forecasts oil spot prices to average $74/b across 2025, unchanged from their prior monthly forecast, and $66/b in 2026.
Gas spot prices
Following multi-decade lows seen earlier in 2024, natural gas spot prices have ticked higher since November due to increased winter heating consumption. The latest natural gas spot price is up to a one-year high of $3.93/mmBtu as of Jan. 10.
The EIA forecasts natural gas prices to peak this month, following regular seasonal patterns. Their long-term forecast is for prices to average $3.10/mmBtu across the year and $4.00/mmBtu in 2026.
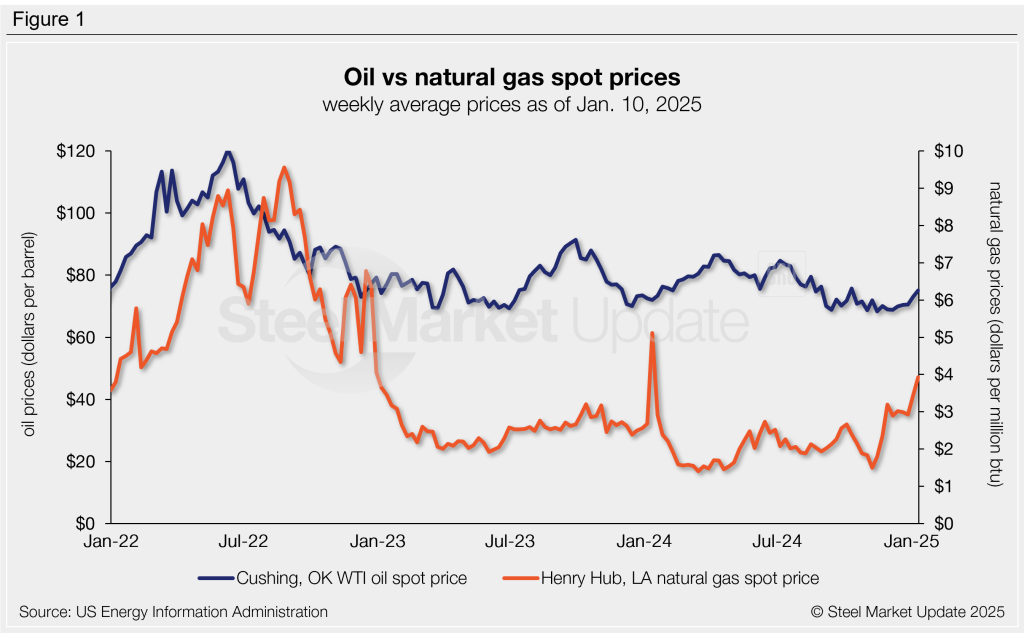
Rig counts
The number of active US drilling rigs in operation remains near multi-year lows, as they have since June (Figure 2). The latest US count is 584 active drill rigs as of Jan. 10, the lowest level seen since November, according to Baker Hughes. Compare this to the two-and-a-half-year low witnessed back in June 2024 of 581 rigs.
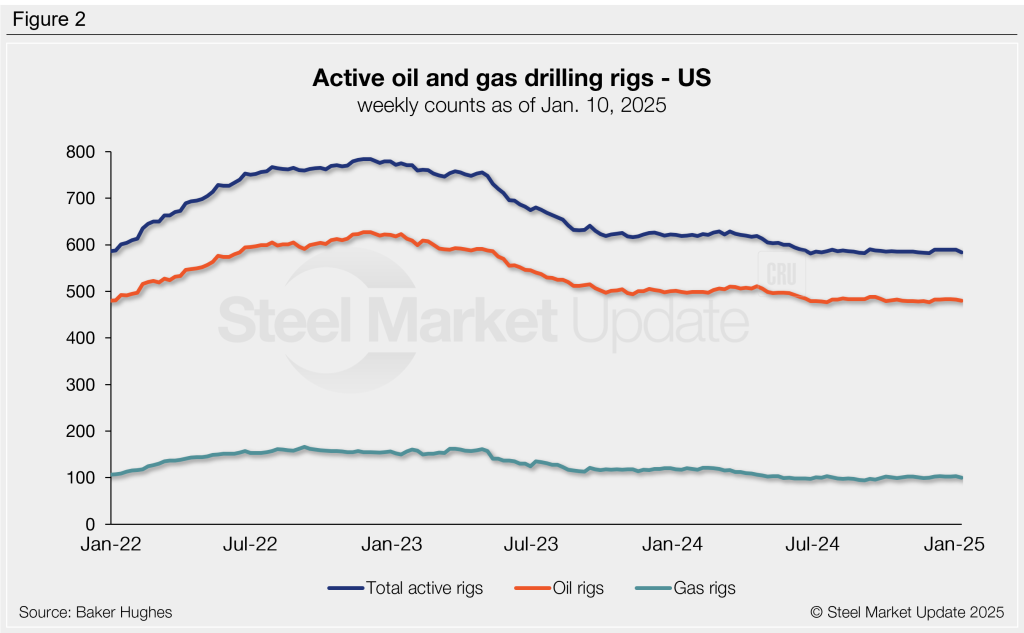
The latest active Canadian rig count rebounded to 216 rigs as of Jan. 10 (Figure 3). This recovery follows the typical seasonal downturn seen around the end of each year. Canadian counts typically soar in January and February, then begin to ease as warmer spring weather approaches and thawing ground conditions limit access to roads and sites.
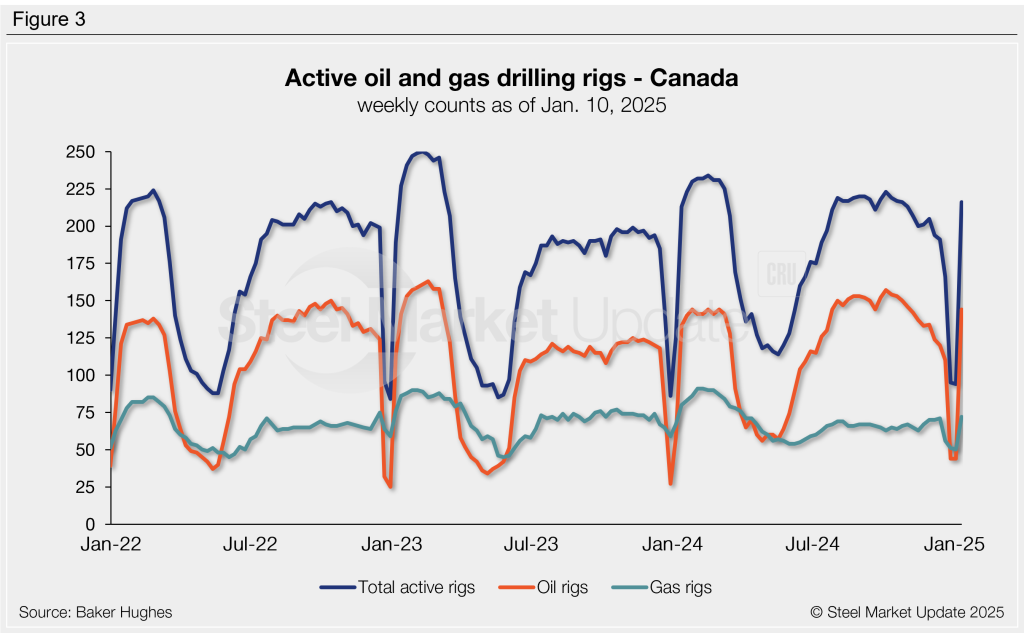
Crude stock levels
US crude oil stock levels have been relatively stable for the past two years. Following the seven-month low of 795 million barrels recorded last September, stocks partially recovered through November to reach 819 million barrels, but have declined since. The latest US stock level has eased to 807 million barrels as of Jan. 10. Stock levels are 3% higher than this time one year ago, but 2% lower than they were in January 2023 (Figure 4).