Manufacturers/End Users
January 31, 2025
US light-vehicle sales accelerate again in December
Written by David Schollaert
US light-vehicle (LV) sales jumped to an unadjusted 1.49 million units in December, a rise of 9.6% from November and 2% from a year ago, according to data from the US Bureau of Economic Analysis.
On an annualized basis, LV sales were 16.8 million units in December, up from 15.6 million units the month prior and well ahead of a consensus forecast of 16.5 million.
Market conditions continue trending positively, as LV sales surprised to the upside for a third straight month. Holiday incentives and an ongoing gradual decline in rates drove the gain.
Auto sales jumped 9.3% y/y, while light-truck sales rose 4.6%. Light trucks accounted for 84% of December’s total sales, above the 82% share a year earlier.
December’s average daily selling rate (DSR) was 59,543 vehicles – calculated over 25 days – up 26.1% from the 56,110-unit daily rate a year ago.
Figure 1 below shows the long-term picture of US sales of autos and lightweight trucks from 2019 through December 2024. Additionally, it includes the market share sales breakdown of last month’s 16.8 million vehicles at a seasonally adjusted annual rate.
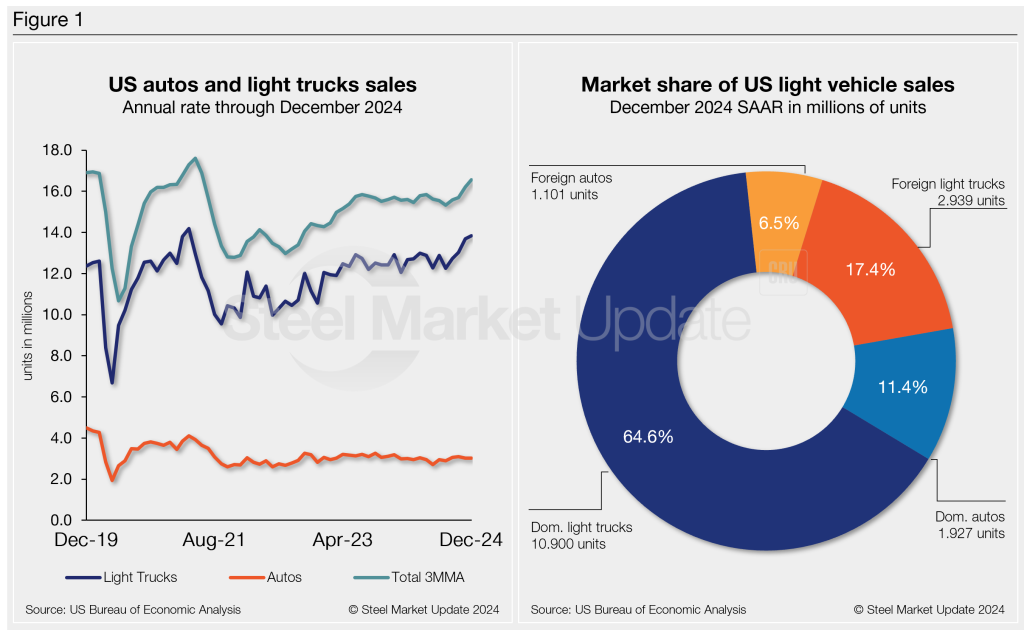
Auto production has recovered from the pandemic and is now largely above 2019 levels. The rebound has come despite the continued impact of higher average transaction prices (ATP) for new vehicles.
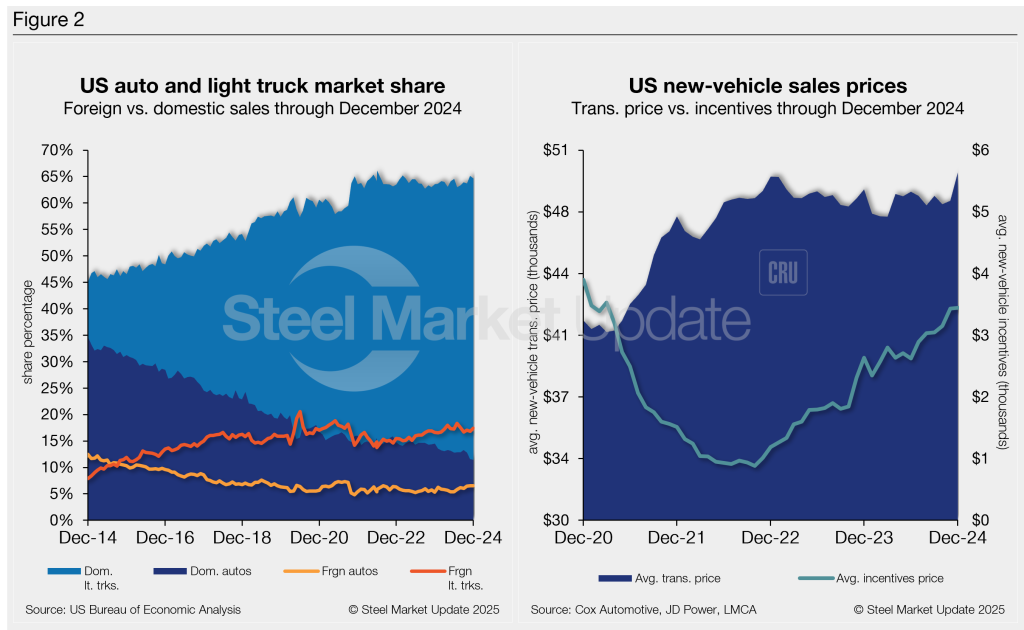
For 2024, the ATP was $48,001, a whopping 24.6% (+$9,519) above 2019’s ATP, according to data from Cox Automotive. December’s ATP of $49,740 was up 3.4% m/m and 2% (+981) higher y/y.
Incentives rose 0.3% m/m, reaching a 45-month high of $3,442. Incentives now represent roughly 6.9% of the ATP. Compared to last year, incentives are up 31%, or by $809.
The annualized selling rate of light trucks for December was 13.84 million units, up 1.2% m/m and 7.1% y/y. Annualized auto selling rates increased by 0.4% m/m but were down 5.2% from last year.
Figure 2 details the US auto and light truck market share since 2014 and the divergence between average transaction prices and incentives in the US market since 2020.
Editor’s note: This report is based on data from the US Bureau of Economic Analysis (BEA), LMC Automotive, JD Power, and Cox Automotive for automotive sales in the US, Canada, and Mexico. Specifically, the report describes light-vehicle sales in the US.