Manufacturers/End Users
August 18, 2025
US light-vehicle sales rebound in July
Written by David Schollaert
US light-vehicle (LV) sales increased to an unadjusted 1.37 million units in July, 8.7% over June and 6.6% above year-ago totals, according to US Bureau of Economic Analysis data.
On an annualized basis, LV sales were 16.4 million units in July, up from 15.3 million units the month prior and notably outpacing the consensus forecast of 16 million.
Sales started the second half of 2025 on a strong footing. They have fluctuated since a late tariff-driven surge was seen from March through April, followed by two subdued sales months.
A major component of the gain is that automakers have largely absorbed the impact of tariffs, limiting the pass-through to consumers. This trend is likely to subside for 2026 models.
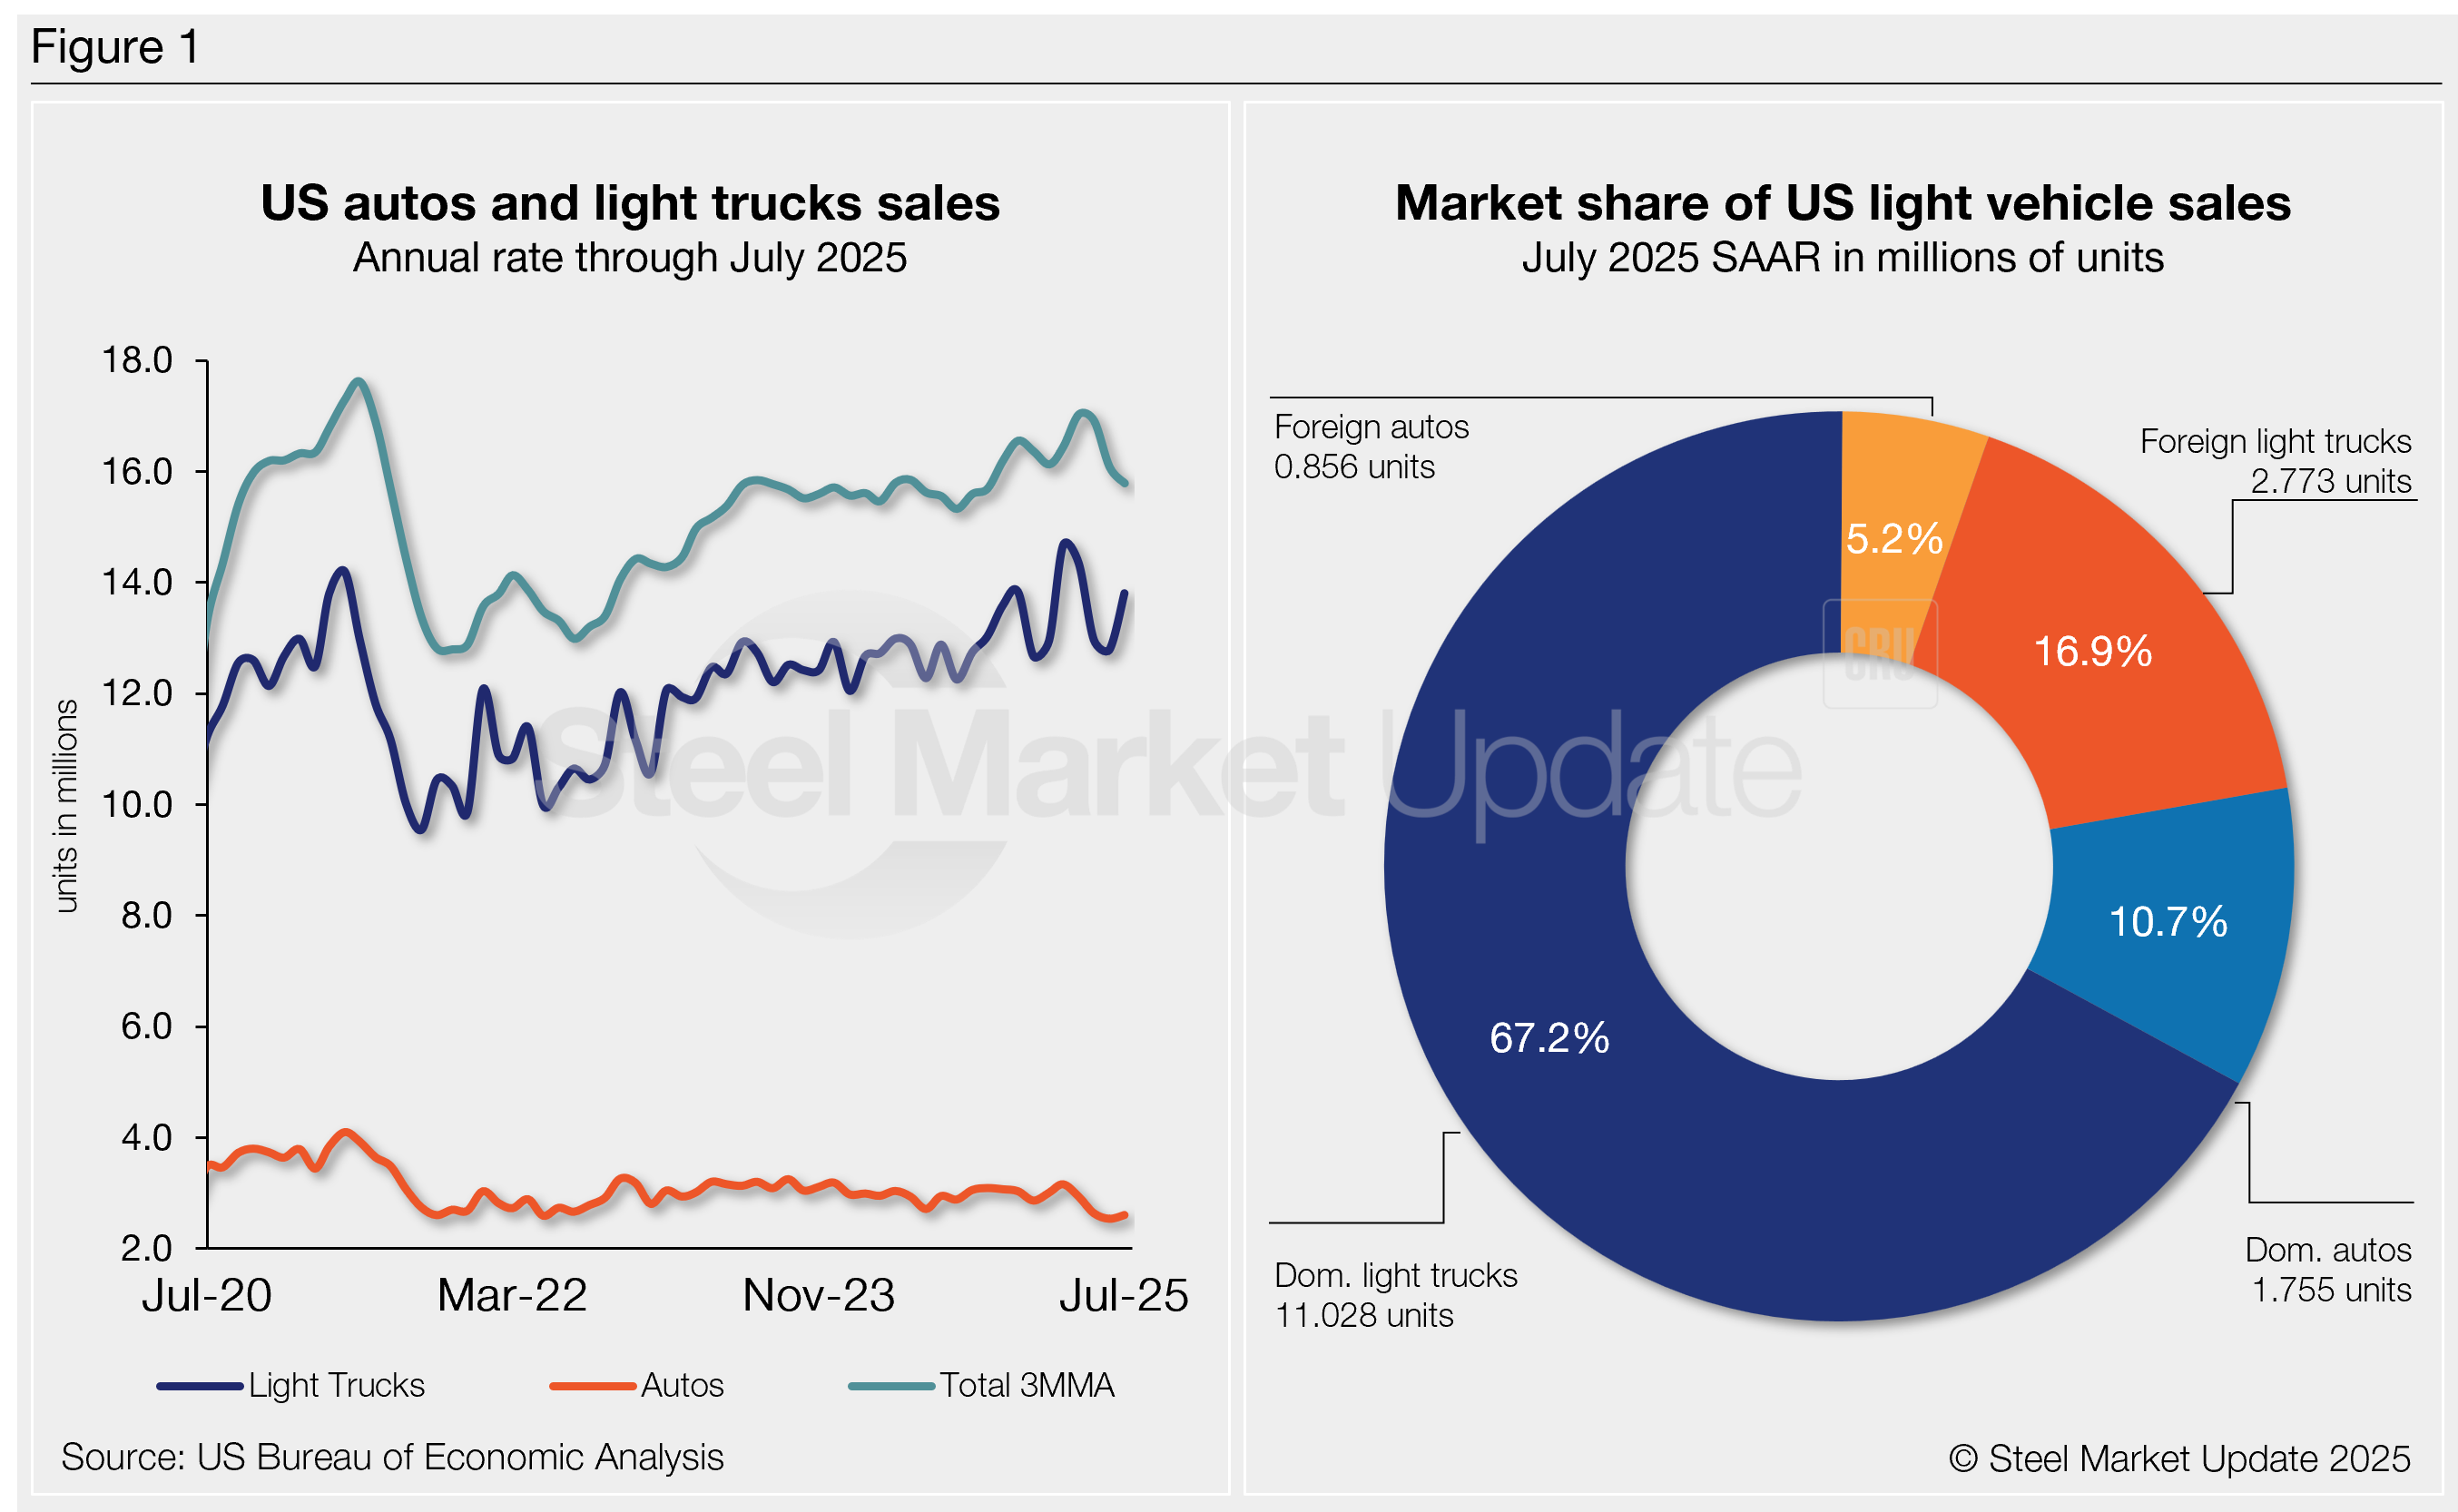
Auto sales fell 11.5% year over year (y/y), while light-truck sales rose 7.1%. Light trucks accounted for 84% of July’s total sales, above the 81% share a year earlier.
July’s average daily selling rate (DSR) was 52,695 vehicles – calculated over 26 days – up 2.5% from the 51,428-unit daily rate a year earlier.
Figure 1 below shows the long-term picture of US sales of autos and lightweight trucks from 2020 through July 2025. Additionally, it includes the market share sales breakdown of last month’s 16.4 million vehicles at a seasonally adjusted annual rate.
Auto production has fluctuated recently but has recovered from pandemic-driven disruptions. Assemblies are now largely above 2019 levels. Despite improving, higher average transaction prices (ATP) and interest rates continue to weigh on new vehicle sales.
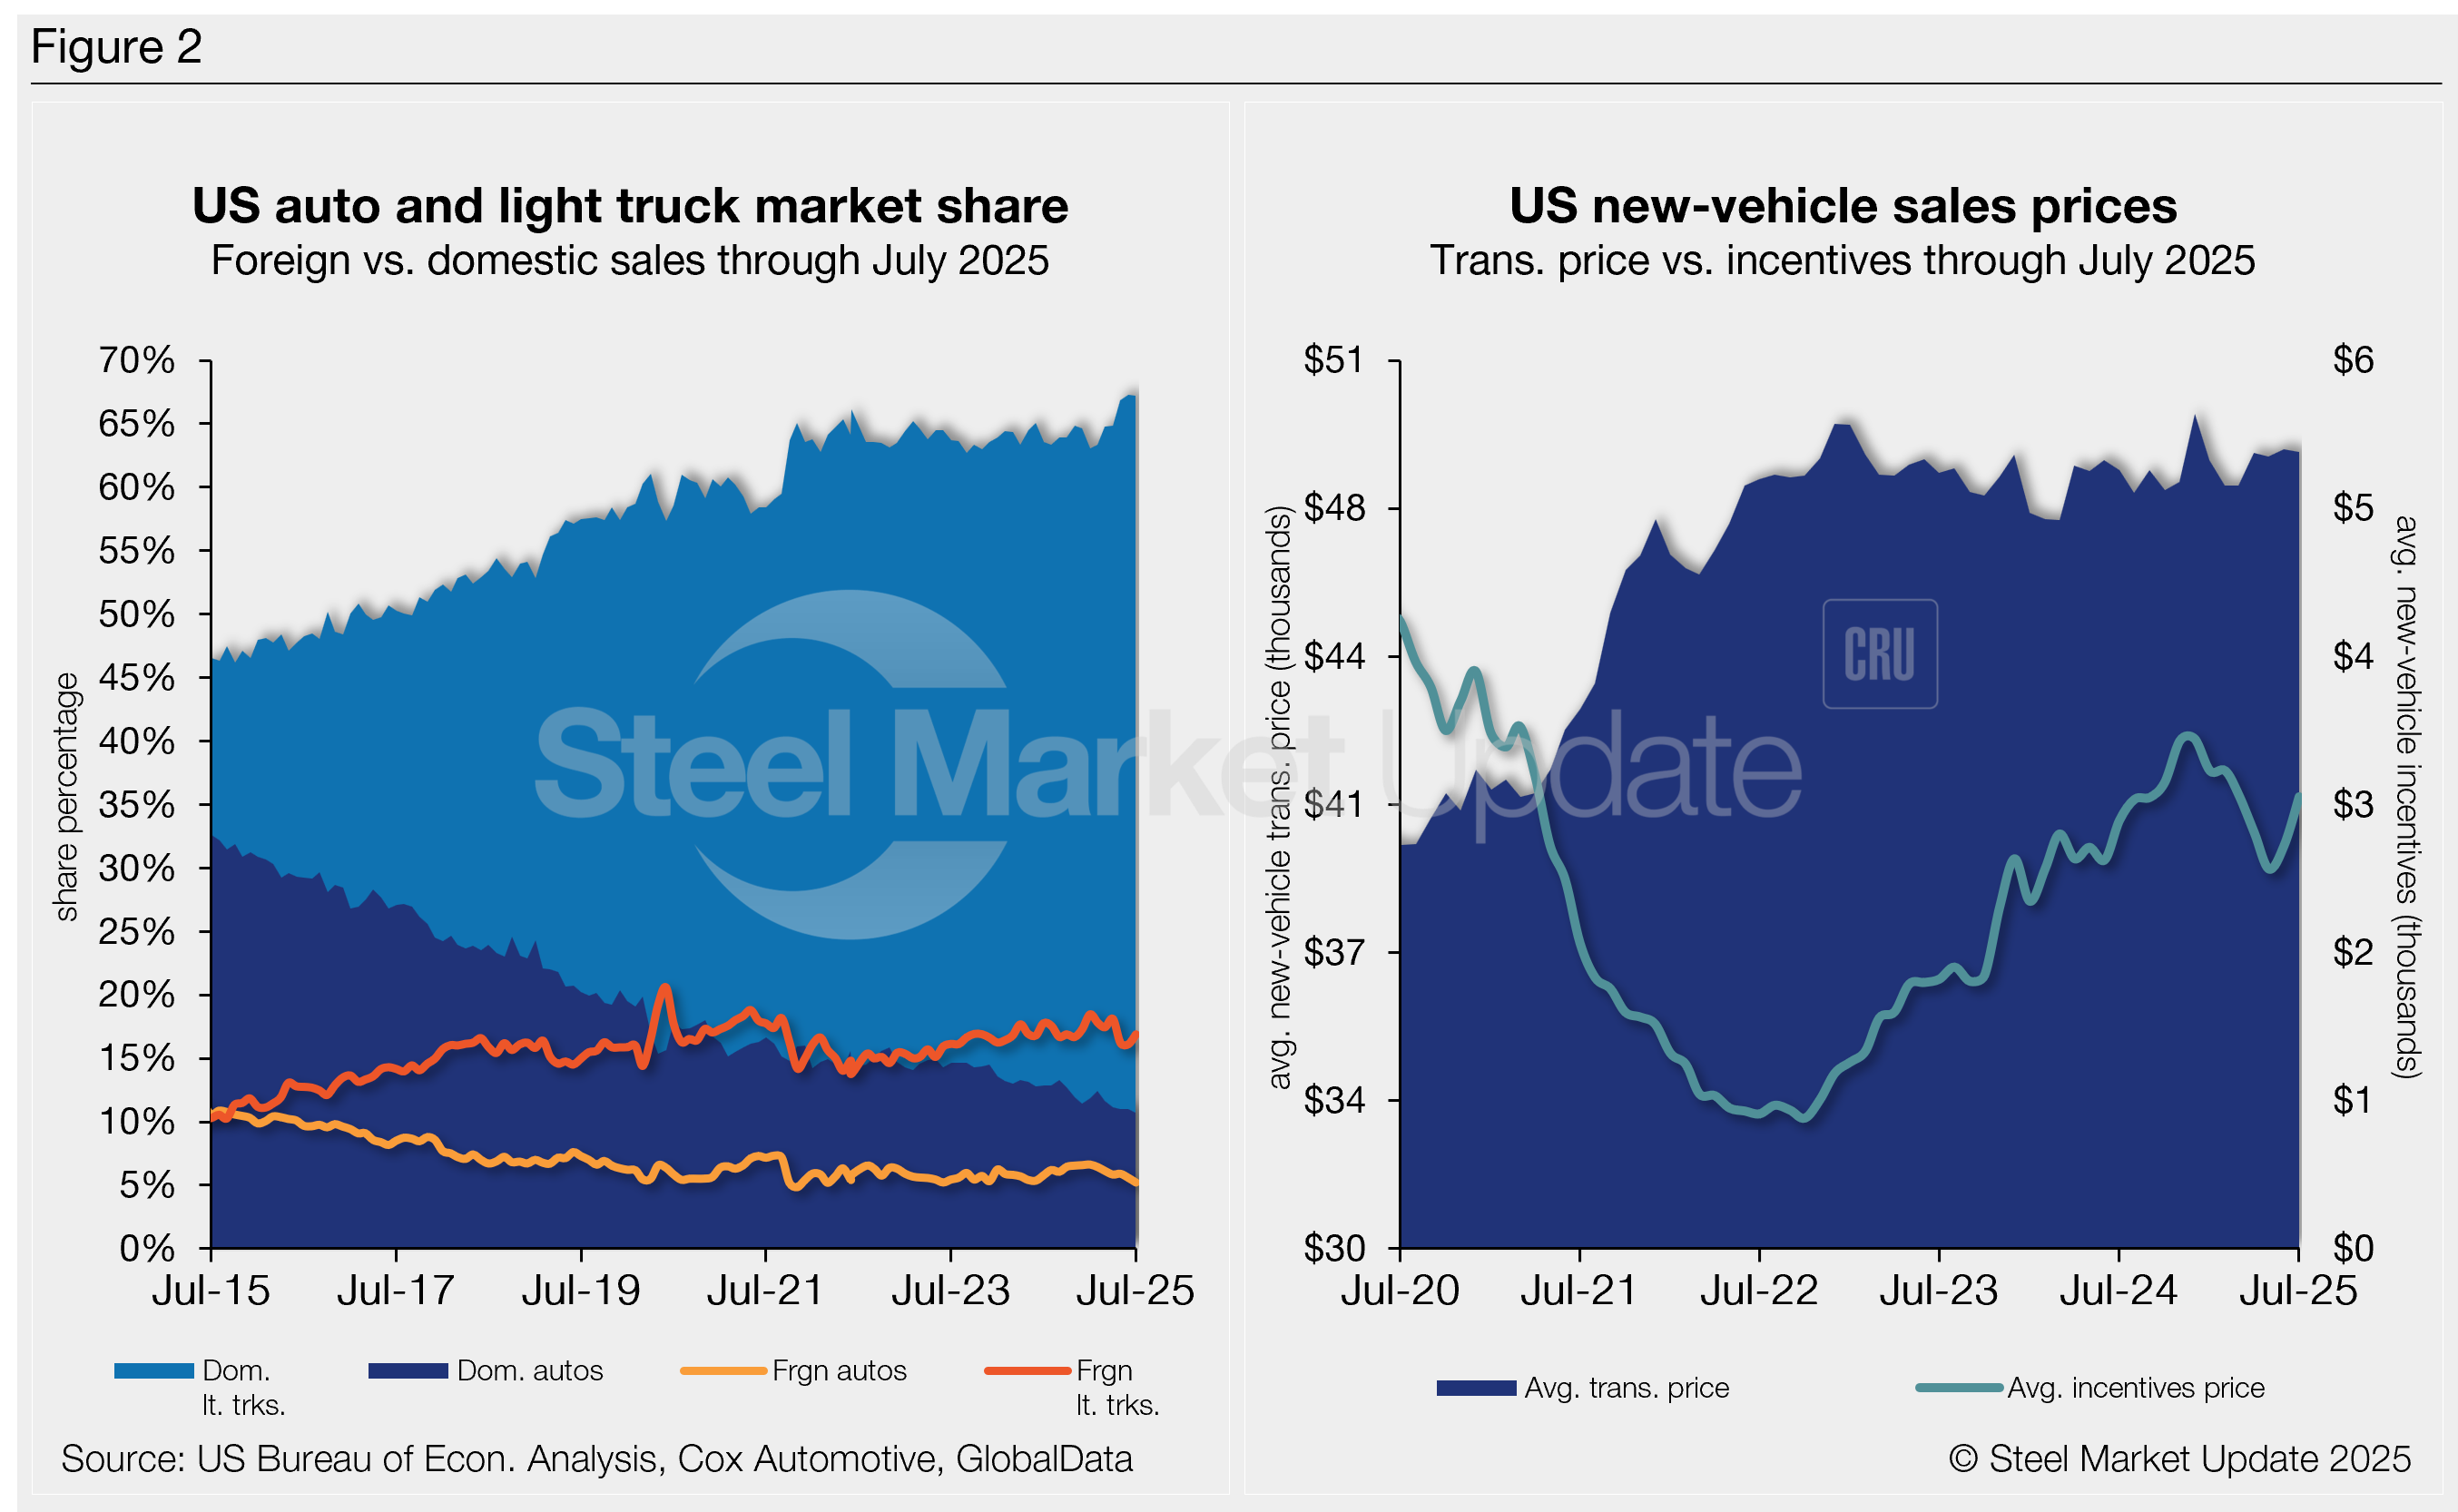
July’s ATP was $48,841, down marginally month over month (m/m) and just 0.9% (+$440) higher y/y.
Incentives increased 11.9% m/m to $3,051, but were well below a recent high of $3,442 in December. Incentives now represent roughly 6.2% of the ATP. Compared to last year, incentives are up 5.5%, or $159.
The annualized selling rate of light trucks for March was 13.8 million units, up 8% m/m and up 7.2% y/y. Annualized auto selling rates also ticked up 2.7% m/m but were down 11.6% from last year.
Figure 2 details the US auto and light truck market share since 2015 and the divergence between average transaction prices and incentives in the US market since 2020.
Editor’s note
This report is based on data from the US Bureau of Economic Analysis (BEA), GlobalData, JD Power, and Cox Automotive for automotive sales in the US, Canada, and Mexico. Specifically, the report describes light-vehicle sales in the US.