Analysis

December 11, 2025
HR Futures: How long will the rally run?
Written by Gaby Ain
After another eventful week in the steel market comes to a close, one of the most interesting developments has been timing.
When I wrote my last column on Nov. 6, the market had found its footing, but calling it a rally still felt tentative. It was early stages, with a fair amount of skepticism baked in. Since then, it has become clear a rally is underway.
The natural next question becomes: how high and how long can it run? This week, a small move on the screen, but a meaningful one, suggests the rally, at least in the futures market, has been granted more runway.
CME Midwest HRC futures curve (12/11 in white, 12/4 in blue, 11/6 in orange)
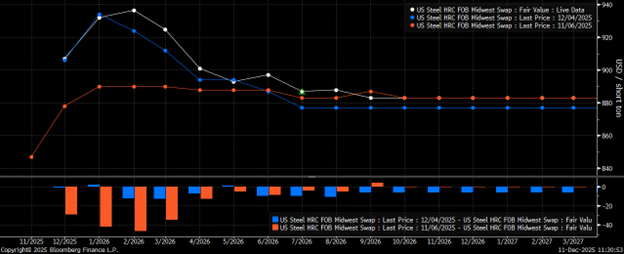
In early November (orange, the date of my last column), the market was cautious, acknowledging tightening conditions but still unsure about momentum. The curve sat in the upper $870s-890, with January holding the ceiling.
A week ago (blue), the rally had already been confirmed, the front lifted sharply into the $905-935 range as lead times lengthened, mills firmed up, and a restocking boost occurred. Even then, January remained the high point on the board.
Today’s curve (white) changes the story a bit. December and February continue to sit in the $905-935 range. However, February has overtaken January as the peak of the curve and nearly reached $940.
That shift implies that the market is no longer treating this as a short, one-month squeeze. Instead, market participants are pricing in a rally with at least some staying power, one that carries into the middle of Q1 rather than losing steam at the calendar turn.
Recent fundamentals can help justify the extension. Mills pushed through another round of price increases, scrap moved up $10-20 with expectations for more, restocking and inventory dynamics in play, imports have dropped, and production has been running sub-76% capability these past two weeks, suggesting some mill discipline.
But just as important as what moved is what didn’t move. Beyond February, enthusiasm fades and by April-May, today’s curve converges almost perfectly with last week’s. By summer, the curves are essentially stacked on top of one another. And the back of the curve, late 2026 and early 2027, is back in line with a month ago.
This is a way of drawing a boundary around the rally. The market believes in a bit more longevity, but not a fundamental repricing. Anything past late-Q1 still carries expectations of looser supply and, overall, skepticism.
Disclaimer
The content of this article is for informational purposes only. The views in this article do not represent financial services or advice. Any opinion expressed by Flack Global Metals or Flack Capital Markets should not be treated as a specific inducement to make a particular investment or follow a particular strategy, but only as an expression of his opinion. Views and forecasts expressed are as of date indicated, are subject to change without notice, may not come to be and do not represent a recommendation or offer of any particular security, strategy or investment. Strategies mentioned may not be suitable for you. You must make an independent decision regarding investments or strategies mentioned in this article. It is recommended you consider your own particular circumstances and seek the advice from a financial professional before taking action in financial markets.