Analysis

February 5, 2026
HR Futures: A different kind of confidence
Written by Daniel Doderer
Since my last column, confidence within the physical market has been restored. However, that does not mean necessarily confidence in the outlook for demand. More so, it’s confidence that better pricing is not lurking around the corner. So where do we go from there?
The chart below widens the aperture and adds some broader context on what stage of the rally we are likely in.
SMU price ranges and recent corresponding forward curves
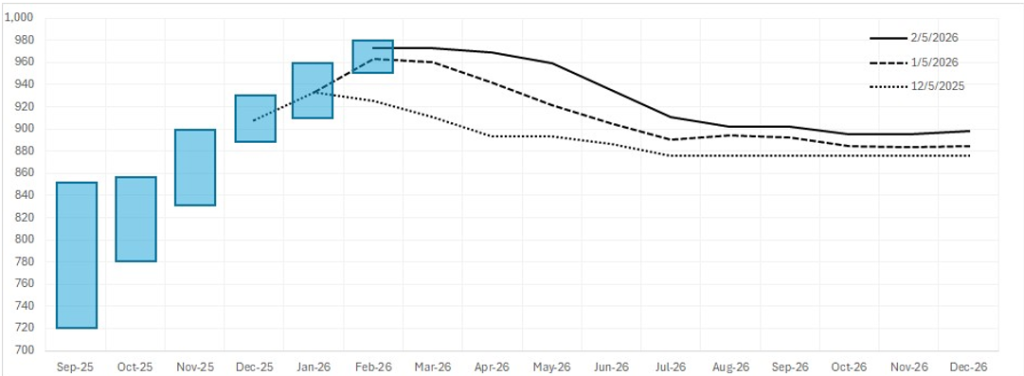
Starting with the width of price ranges in the physical market, you see a narrowing of the band as the rally has progressed from ~$130 in September to roughly $30 in the early part of February. Turning to financial markets – you can see clearly how confidence in position taking has grown since December as well. In the early stages, there was little confidence that the physical market would hold up, as evidenced by January (second month contract) was the highest month trading, followed immediately by successive lower months.
Once we get to January trading, that narrative begins to shift. Even though it is still the second month contract trading at the highest level (now February), the ensuing months have all shifted higher as well, with March (third month contract) only a few dollars lower.
Fast forward to today, this is a much more significant shift. February is currently holding as the highest month – not a great signal for momentum – although February and March have recently been trading places by a few dollars.
The more important shift, however, comes from the fact that through May (fourth month contract), the market is currently only pricing in a ~$20 decline. That is, the market is pricing in a surprisingly durable plateau, implying very little change in price for roughly 14 weeks. If you ask anyone who has spent time in the steel market, I think they would agree a $20 price range over a 14-week period would be highly unlikely.
Beneath the surface
So let’s take a step back and see what’s going on beneath the surface. The chart below is a new one for me, so give me a moment to introduce it.
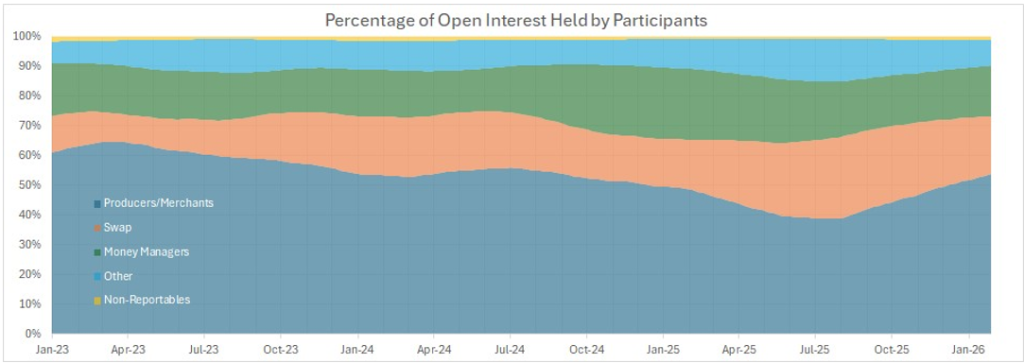
The futures market includes a mix of participants with different objectives: Producers and merchants (purple) use futures to hedge real-world price risk tied to physical production or consumption. Swap dealers (typically banks, orange) act as middlemen and hedge client risk. Managed money (green) consists of professional investors trading to profit from price movements. Other reportables (light blue) are large traders whose strategies don’t fit neatly into hedging or speculation. And non-reportables (yellow) are smaller participants with positions below reporting thresholds. The chart below shows the six-month moving average of the relative size of positions held by each group.
I want this context for two reasons. First, a notable underlying force to flag is the “reactivation” of producers and merchants since the market began to solidify in August and September. When you dig into the data further, they accounted for the lion’s share of selling – which is normal, as they are the natural sellers given their physical length. More than anything, this is a signal of stability and health that they have reentered the market after months of decaying participation.
The second reason is to add clarity around how large money managers’ presence in the market actually is before digging deeper into their dynamics. The answer is that they typically account for roughly 10–30% of total positions, but they warrant close monitoring because they are consistently the most speculative group.
The chart below should be familiar. It is a detailed breakout of money-manager positioning. The black-dashed line represents the net position, green denotes longs, red shorts, and yellow spreads (i.e., simultaneously long one month and equally short another).
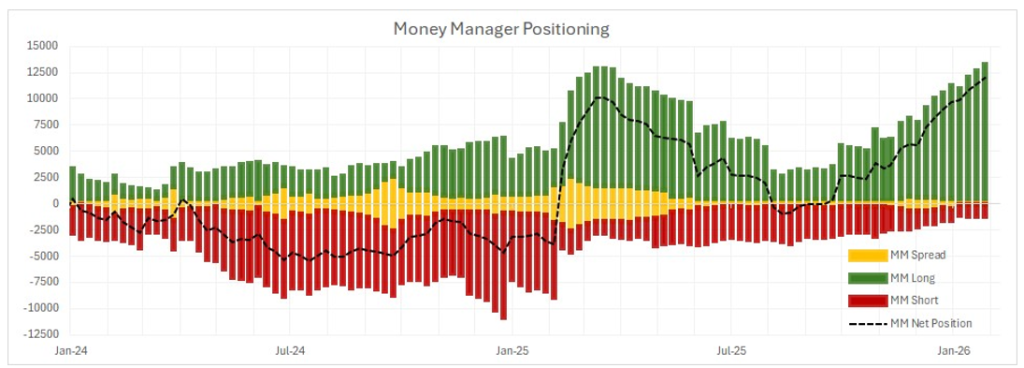
One of the most notable takeaways is that net positioning is now the longest it has been since October
In 2021, when prices officially peaked in the post-pandemic record-breaking cycle. Another important distinction is how little spreading is occurring. What we are seeing instead is a preference for outright positioning, which is notably different from this time last year.
So what does all of this mean taken together? There are several possible interpretations, but I’ll flag two. First, the market is clearly very tight – imports are effectively nonexistent (by design), and domestic production appears laser-focused on meeting demand exactly where it is. That combination certainly supports a steady higher-for-longer pricing dynamic at current levels.
On the other hand, upward pressure on spot pricing may be starting to lose momentum, as suggested by the top chart. With such a large speculative long position already in place, it would be unrealistic to assume these participants would be comfortable watching profits erode. Any clear sign of deterioration could prompt a rapid repositioning and a profit-taking correction.
Disclaimer
The content of this article is for informational purposes only. The views in this article do not represent financial services or advice. Any opinion expressed should not be treated as a specific inducement to make a particular investment or follow a particular strategy. Views and forecasts expressed are as of date indicated. They are subject to change without notice, may not come to be, and do not represent a recommendation or offer of any particular security, strategy or investment. Strategies mentioned may not be suitable for you. You must make an independent decision regarding investments or strategies mentioned in this article. It is recommended you consider your own particular circumstances and seek the advice from a financial professional before taking action in financial markets.