Analysis

February 17, 2026
January service center shipments and inventories report
Written by David Schollaert
Flat rolled = 58.5 shipping days of supply
Plate = 50.8 shipping days of supply
Flat rolled
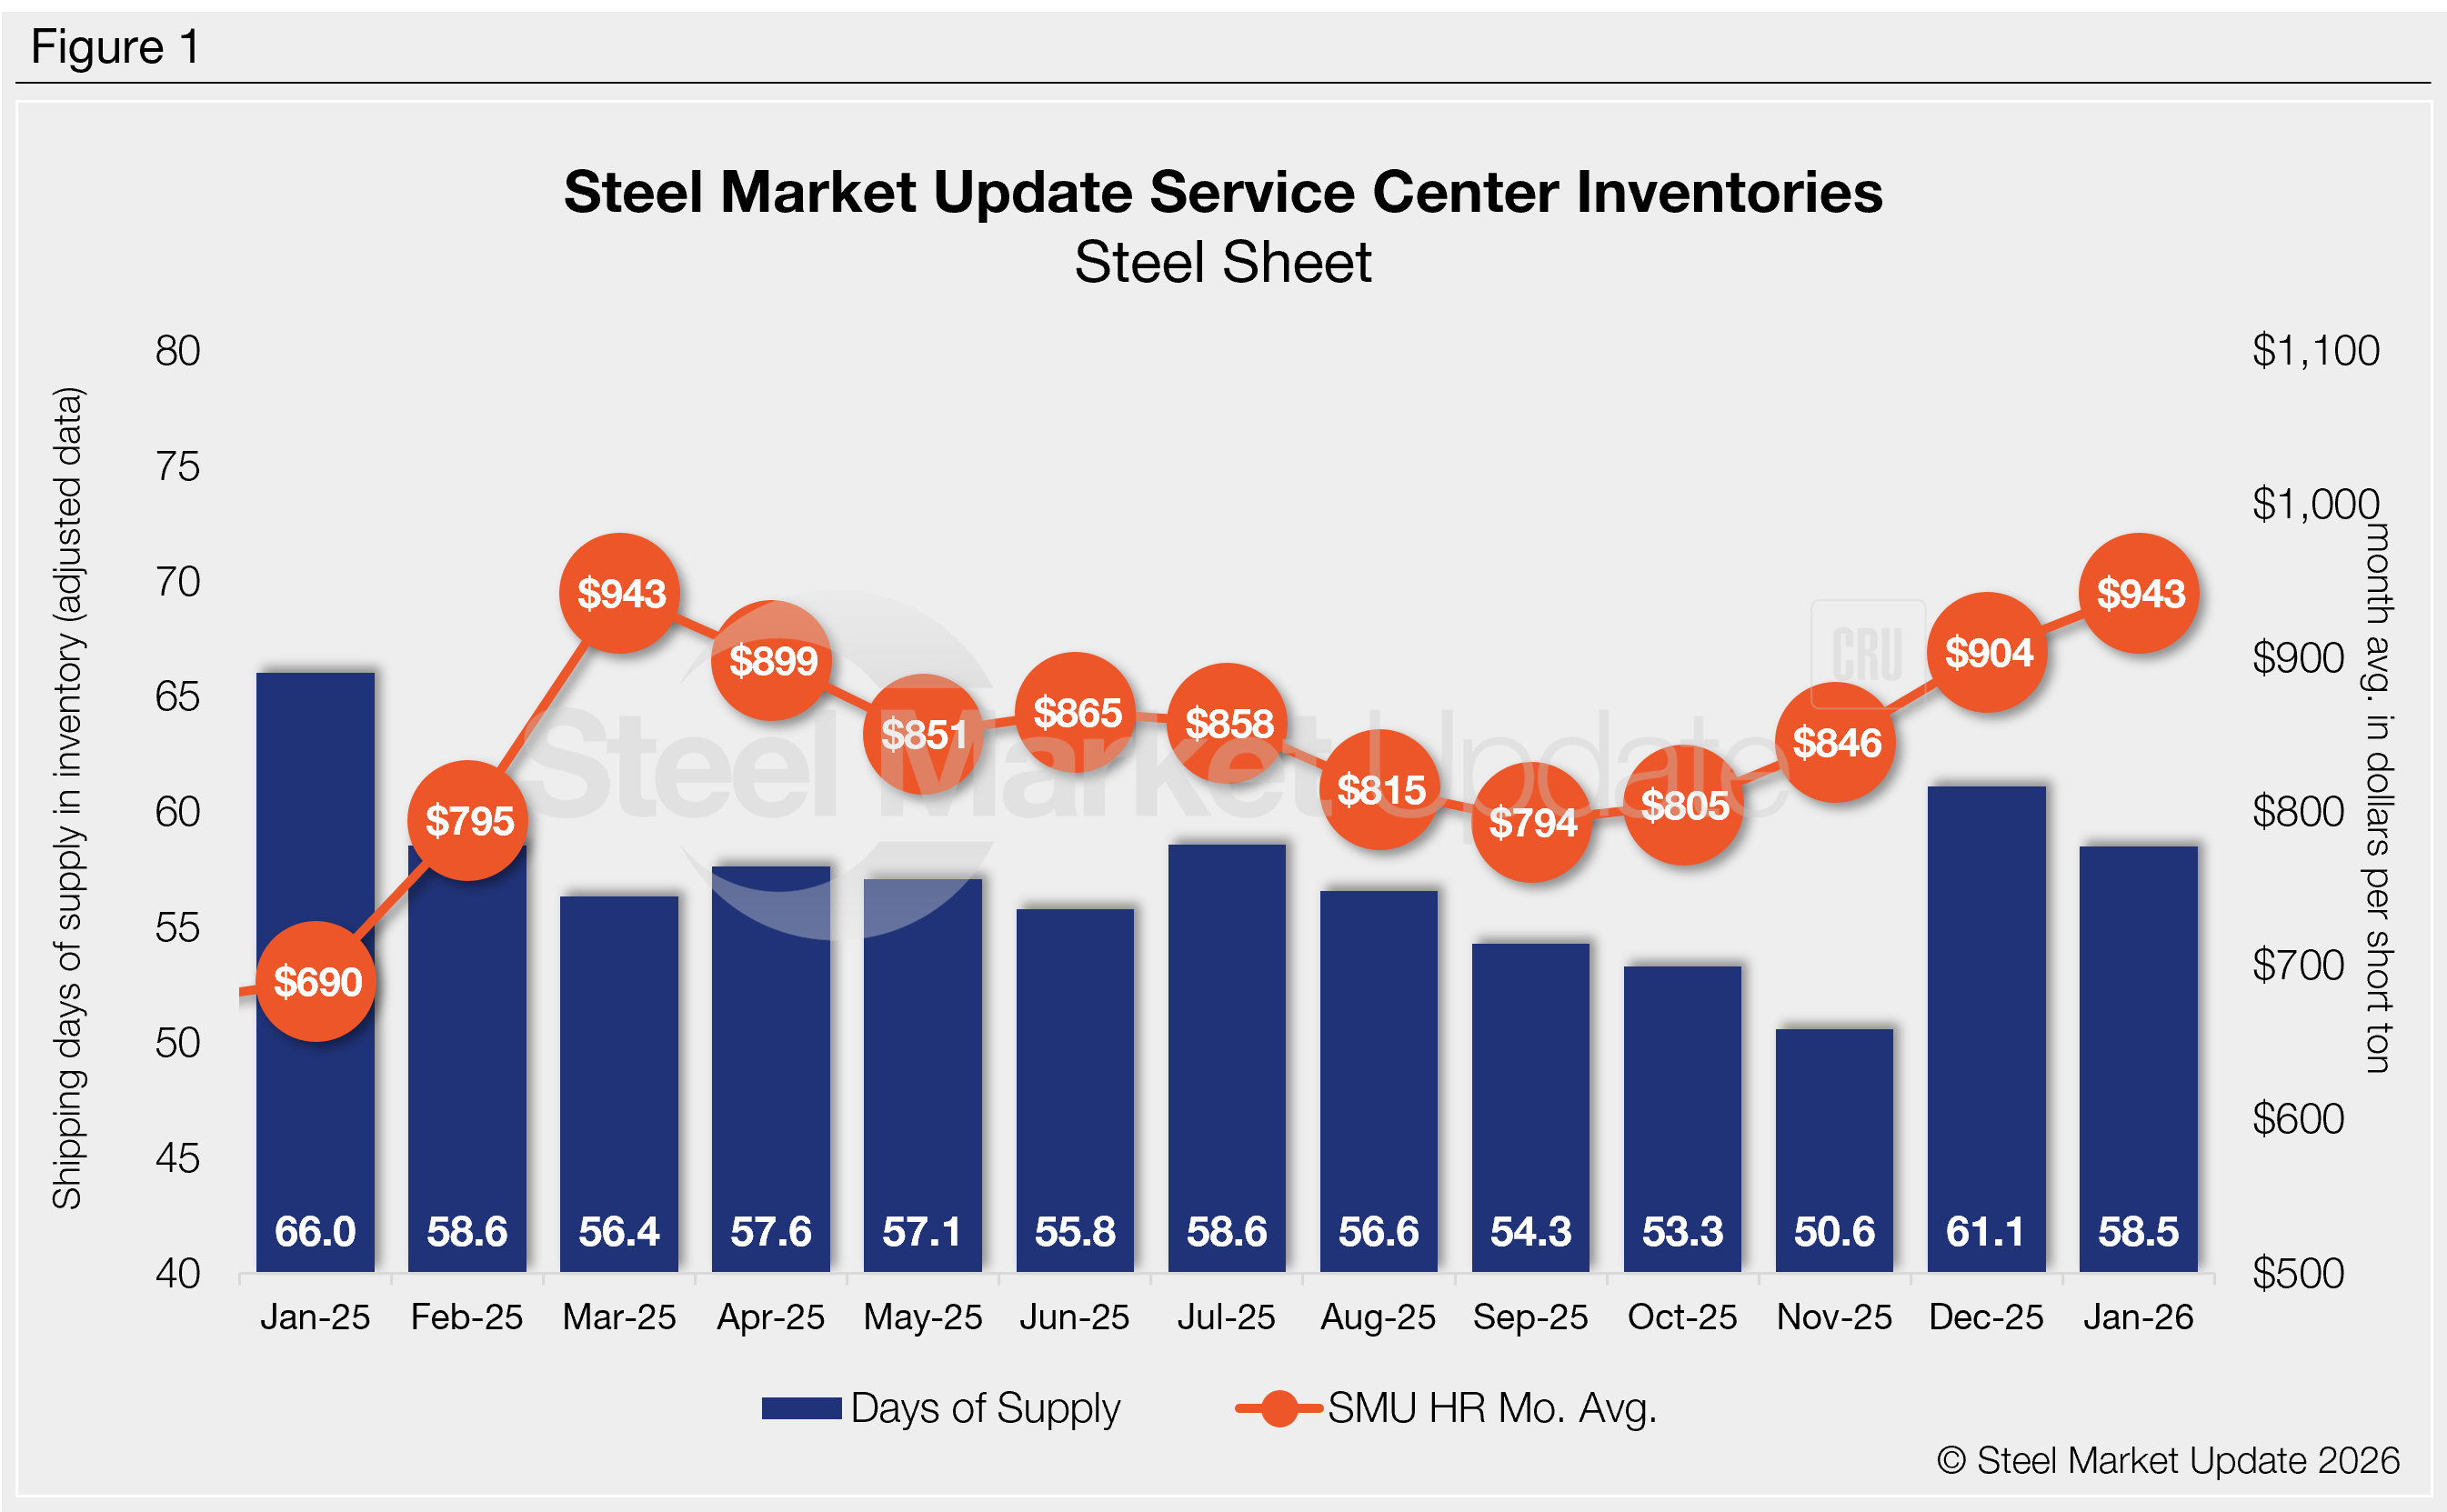
US service centers’ flat-rolled steel supply declined in January, after trending higher in December. Shipping days of supply slipped to 58.5 on an adjusted basis at the end of January, according to SMU data.
Flat roll supply eased in January after reaching its second-highest total for 2025 in December. The result is also a noticeable decline from 66.0 shipping days in January 2025, and a three-year low.
Flat roll inventories represented 2.78 months of supply in January, down from 3.06 in December, and below 3.00 months in January 2025. The month-on-month (m/m) decrease in inventories came largely due to an increase in shipments, a typical seasonal trend.
Shipments in January were up 12.1% m/m but followed a 4.5% decline from November to December. The gain in shipping pace was supported by a slight increase in shipping days and an upward turn in prices. The move appears to maintain a balance between service center supply and flat-to-up demand.
The data aligns well with SMU’s mid-January survey, which found that 43% of service centers were releasing the same amount of steel compared to one year ago, while 40% were releasing more steel. Just 17% reported they were releasing less vs. the same time a year earlier. While demand has seen marginal improvement, pricing gains still kept spot buying limited as Q1 2026 got underway. Thus, it’s no surprise to see an increase of 4.8% m/m in on-order volumes.
At the end of January, service centers shipping days of supply on order were down 1.8% m/m, but a notable increase y/y of nearly 15% vs. the 2025 average.

The latest SMU survey from Feb. 6 showed hot-rolled coil lead times at 5.88 weeks, down from 6.04 weeks a month earlier.
The result corresponds well with SMU’s January survey, which saw, on average, 10% of service centers building inventory. Eighty percent maintained material, with the remaining 10% reducing inventory.
Plate
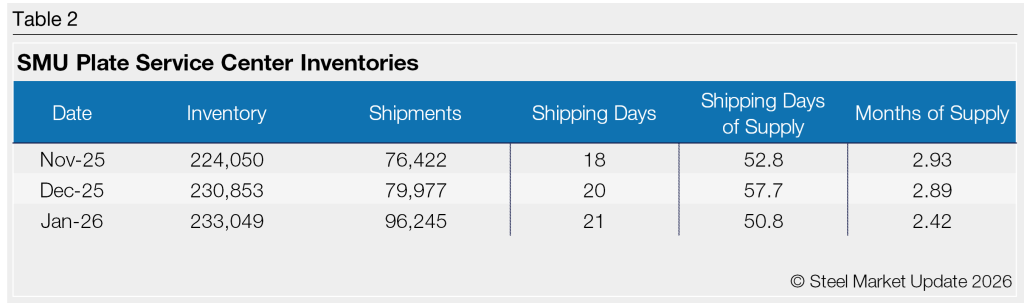
US service center plate inventories were noticeably down in January, supported by a jump of 514.6% in the daily shipping rate, according to SMU data. At the end of January, service centers held 50.8 shipping days of supply, down from 57.7 in December. Plate supply in January represented 2.42 months of supply, down 16% from 2.89 months in December.
January plate supply is also lower vs. year-ago levels, when service centers carried 54.3 days of supply or 2.47 months of supply. Latest inventory levels are low, suggesting lean levels resulting from uneven demand dynamics. Some suggest this dynamic could bump prices up further should order volume increase to balance inventory levels.

Material on order rose in January, up 3.5% m/m, after increasing nearly 6.7% from November to December. The trend was aided by an increase in shipping days of supply on order.
At the end of January, service centers shipping days of supply on order were down 9.7% from December, but up 2.3% from January 2025. Service centers do not need to carry as much inventory because of additional domestic capacity, and plate lead times remain normal at 6.18 weeks, up from 6.00 weeks vs. a month prior, according to the latest SMU survey. But when is lean, too lean?
Service center demand has not picked up materially for the better part of the past six months-plus. But sources continue to report an uptick in special projects. And strong order books in February and March have been reported, with more sources reporting a more bullish outlook for 2026.
Mills have been pushing through price increases as the market starts to look deeper into Q1, though increases have not been as quick to stick.