Analysis
March 20, 2026
CRU: The macroeconomic impact of conflict in the Middle East
Written by Alex Tuckett
This item was first published by CRU. To learn about CRU’s global commodities research and analysis services, visit www.crugroup.com.
The ongoing conflict in the Middle East has led to higher and more volatile energy prices, and impacts on numerous other commodity markets – in particular fertilizers and aluminum. If disruption to Middle Eastern supply continues, this will have a serious negative impact on the global economy. This Insight explores which economies are most exposed and quantifies what some of the impacts could be under different scenarios.
Our Daily Wrap will continue to provide an overview of impacts on commodity markets.
Energy requirements are the critical factor for vulnerability
The single most important aspect of the crisis from an economic point of view is the disruption to oil and natural gas. Countries most exposed to an economic shock are therefore countries which have high net imports of energy relative to the size of their economy.
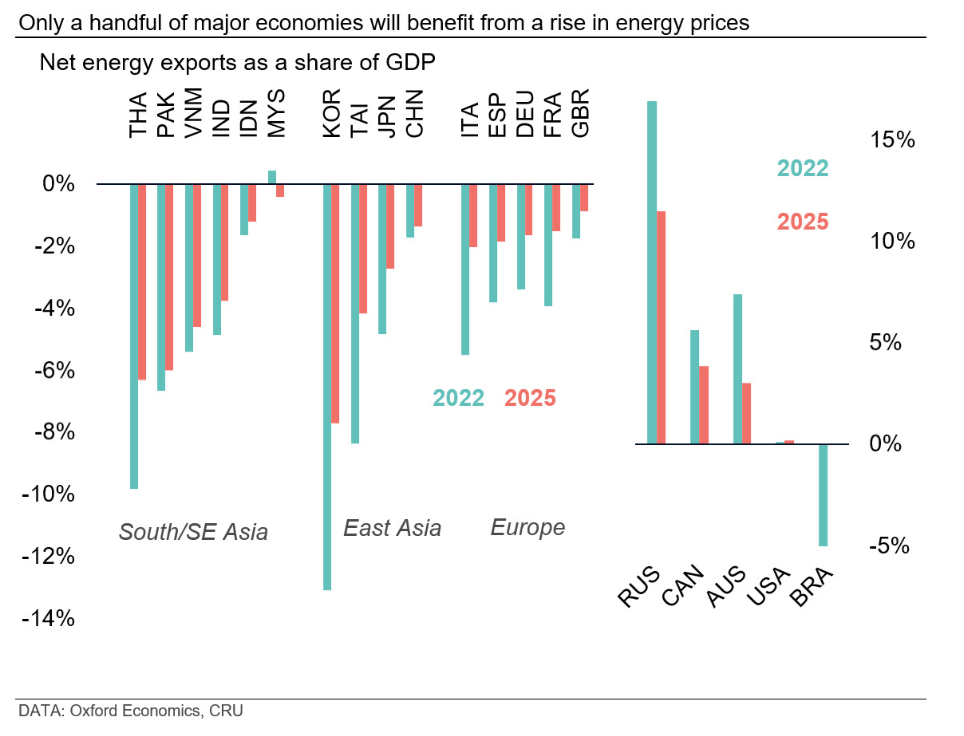
Economies in South and East Asia were the largest importers of oil and gas products from the Gulf, and so will feel the impact most quickly. However, in seeking to replace lost imports from the Gulf, they will quickly bid up energy prices globally. In the energy crisis that followed the Ukraine war, what was initially Europe’s problem quickly became Asia’s problem too. The reverse will now happen; indeed, Brent and TTF, the European oil and gas benchmarks, have already risen sharply.
Overall, in a scenario of lasting disruption, energy import needs relative to GDP are the best overall measure of vulnerability. Within East Asia, Korea stands out. In 2025, it spent almost 8% of GDP on net energy imports. If this were to return to 2022 levels, it would increase to 13%. This would wipe out much of their current account surplus, depressing the currency and further adding to inflationary pressure on households. The economy could easily be pushed into recession. A number of countries in South and Southeast Asia are also highly vulnerable; India, Pakistan, Vietnam and Thailand all have net energy import to GDP ratios of around 4–6%.
Although China is the largest single importer of oil in the world, and a major importer of LNG, as a share of GDP, its energy import needs are more modest. Furthermore, it has accumulated substantial inventories of oil over the past year, which it could use to keep a lid on domestic prices.
All major European economies are net importers of energy, although not to the same extent as countries in South and South-East Asia. Although most Gulf energy exports flow eastwards to Asia, there are particular areas where Europe is a heavy buyer, such as diesel and jet fuel. More importantly, Europe will be exposed to higher prices as Asian countries bid for alternative sources of energy, e.g. US LNG cargoes.
Relatively few major economies outside of the Gulf are net beneficiaries of higher energy prices (see chart below). The shale revolution has turned the US from a big net importer to being roughly neutral. Russia, Australia and Canada will all benefit, but together they account for less than 6% of global GDP. Normally, higher energy prices would boost growth in GCC states, but of course, currently they are unable to export freely and face many other headwinds to their growth (see below).
Distributional effects will be painful even for energy-producing countries
Being a net exporter of energy does not insulate all sectors in a country from higher energy prices. For example, higher energy prices will boost the oil and gas sector in the US, generating higher profits and potentially leading to more investment. But they will hurt manufacturing by pushing up costs. Higher energy prices will also hurt consumers, especially with mid-term congressional elections coming up in November.
The situation will be worse in Europe. The impact on oil prices is likely to be similar, as oil is heavily traded globally. But the impact on European gas prices will be much greater than on US gas prices; less than 10% of the vast (over 1,000 bcm) output of the US gas industry is exported as LNG, whereas Europe is heavily dependent on LNG imports. Furthermore, power prices in Europe are highly sensitive to gas prices.
European industry will face a crippling rise in costs, just as it was beginning to stabilize from the Ukraine energy shock. And European consumers will be hit by more expensive petrol/diesel, gas and power.
Many Asian countries do not face the same issues with power costs. For example, in China or India, power prices are not determined by the cost of gas in the same way as Europe, given the preponderance of coal power (and in China, increasingly solar and wind) in the grid. However, in Japan, Korea and Taiwan, China, power prices are closely linked with LNG prices. Moreover, Asian countries have many consumers on lower incomes for whom energy costs make up a large share of spending.
Governments will face pressure to step in and support consumers and some industries. The EC has already openly discussed subsidizing or capping energy prices in Europe. Where this is done using subsidies, it will limit some of the short-term economic damage, at the expense of increasing government debt levels.
Non-energy commodities also have the potential to cause economic pain
Although energy markets have the greatest potential to cause economic damage globally, the conflict has caused huge disruptions to other commodity markets as well, especially aluminum, sulphur and nitrogen-based fertilizers. A large amount of primary capacity in the Gulf is cut off, and the reduction in flows of oil and gas from the Gulf is creating knock-on problems.
Higher prices and lower availability for aluminum will become a problem for many manufacturing sectors, and to a lesser extent, construction. Disruption to fertilizers will have knock-on effects on food prices, adding to pressure from higher freight costs.
The table below summarizes qualitatively which regions are most exposed to disruption in different commodity markets. Note, this is designed to measure the macroeconomic vulnerability to a particular disruption. The European fertilizer sector is heavily exposed to high natural gas prices, but fertilizers and agriculture make up a small share of the European economy, in contrast to South Asia, for example.
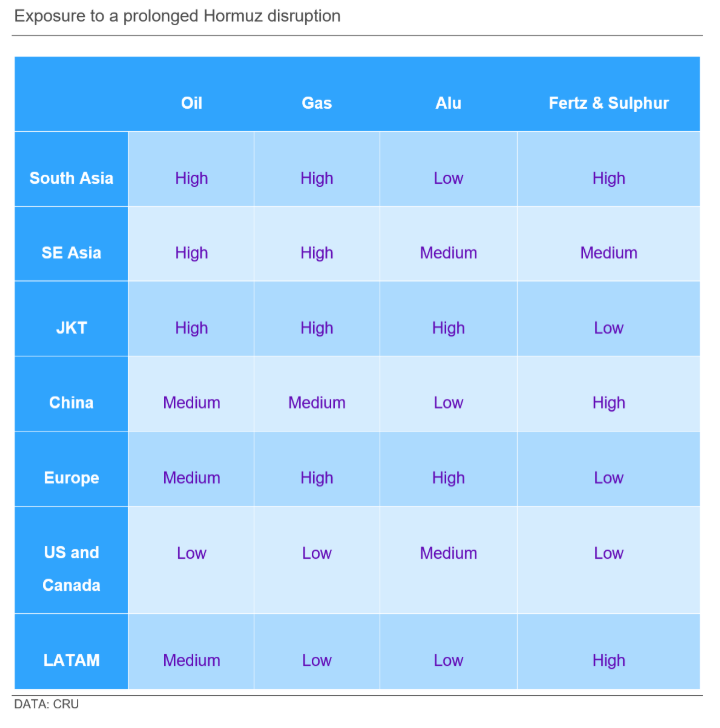
In terms of end-use sectors, chemicals is likely to face severe pressure from a tightening in the global natural gas market – and the loss of sulphur, helium and other feedstock from the Gulf. The global auto sector will also be exposed heavily to higher oil prices on the demand side, and on the supply side, higher aluminum and, in some regions, power prices.
There have been some concerns that the loss of sulphur supply will cause problems for the semiconductor supply chain, as sulphuric acid is needed to clean wafers. However, Gulf sulphur is not a direct supply for this use; the semiconductor sector makes up a tiny share of global demand for sulphur, and sulphuric acid makes up a very small share of the cost-base for this industry.
However, it is likely that there will be unanticipated knock-on effects as supply disruptions in one sector interact with others. All manufacturing sectors will face some form of cost pressure from higher energy and freight prices, and lower consumer demand as higher energy prices squeeze consumer real incomes.
Disruptions to travel and remittances will damage growth in Middle East and Asia
There will also be some economic impacts unrelated to commodity markets. The Gulf states will see a severe economic impact from the loss of commodity revenue, but service sectors in the region will also be hit as travel plunges.
Millions of migrant workers from South Asia work in the Gulf States. A prolonged crisis will threaten their incomes and ability to send money back home.
Impacts on world growth and industry under different scenarios
Our previous Insight set out three scenarios for how the situation could develop: a ‘short-term’ disruption to traffic in Hormuz lasting 3-4 weeks, a medium-term disruption lasting 1-6 months, and an ‘escalation’ scenario with substantial damage to regional energy infrastructure and heavy disruption to Hormuz for 6-12 months.
We are now in the third week of the war and there is little sign of de-escalation. We have therefore lengthened our ‘short’ disruption scenario to 6-8 weeks, to maintain its relevance. The effect on energy prices is summarized in the table below.
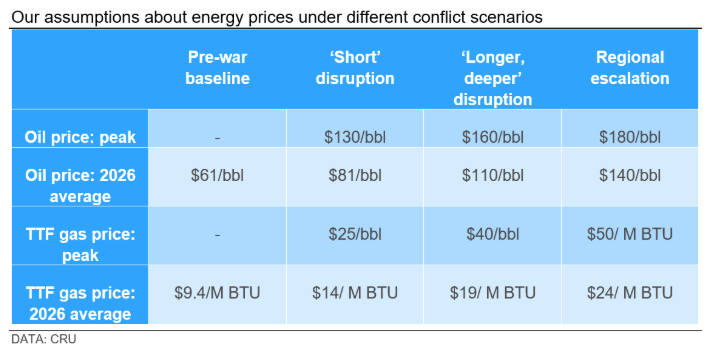
We have also assumed a 50% shock to fertilizer prices, which, together with energy, feeds through to boost food prices. The Gulf states are assumed to suffer significant direct impacts on their GDP from loss of oil and gas production (calibrated based on the length of outage in each scenario), loss of tourism and other service activity, a squeeze on imports, and damage to infrastructure. Iran is assumed to suffer an impact on GDP of 30% in 2026, consistent with the experience of Ukraine following the Russian invasion in 2022.
The impacts of each scenario, relative to our February GEO baseline, are shown in the charts below. The ‘Short Disruption’ scenario takes about 0.3ppt off GDP growth this year. Relative to our February GEO baseline of 2.8% growth, this would mean growth of 2.5%. The ‘Regional Escalation’ scenario would reduce growth to just 1.8% – excluding the pandemic, its weakest pace since the Great Financial Crisis. What is more, the impact of the ‘Regional escalation’ scenario deepens in 2027, rather than stabilizing in the milder scenarios. This is a far more severe impact than what the world economy saw following the 2022 energy crisis, where growth only dipped a little below the trend rate of 3% in 2023 and 2024. As the current crisis affects a much larger share of world energy production, that is not surprising.
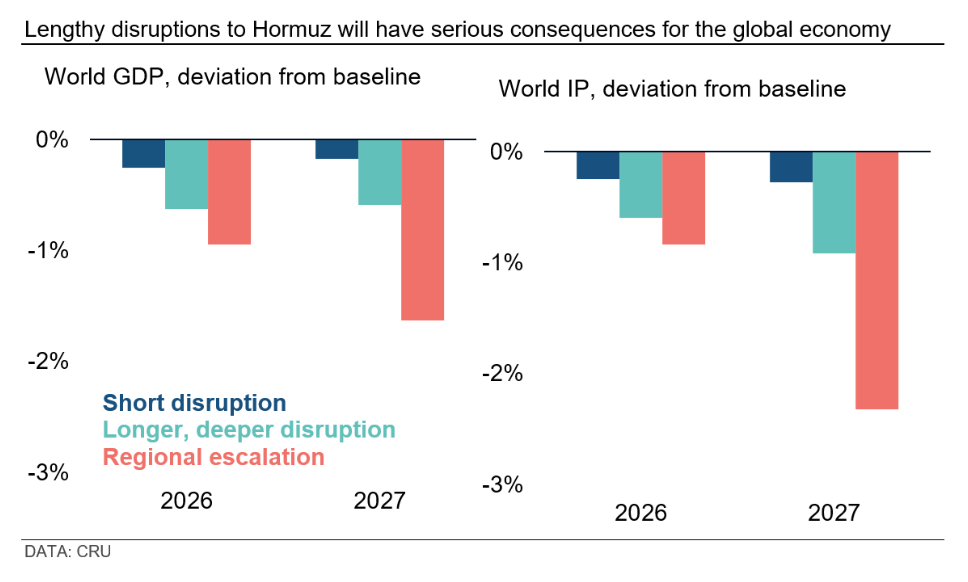
The industrial sector is certainly more exposed to an energy shock than the economy as a whole, as Europe’s experience following the Ukraine energy shock showed. It took until 2023 for the damage to become clear, however. Reflecting this, the impact on industrial production is initially similar to GDP for all scenarios, becoming deeper into 2027.
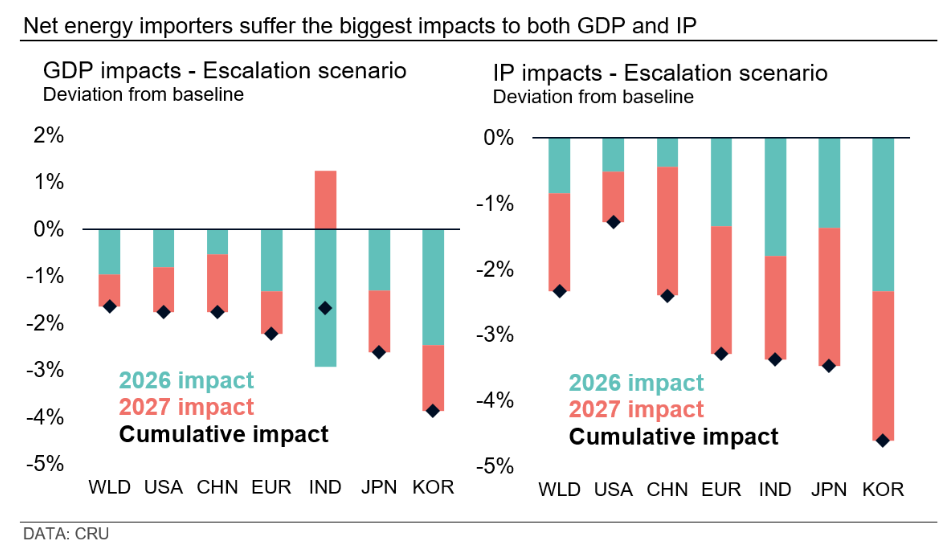
The charts below show the impact on major economies for the most severe scenario. As set out above, net importers of energy tend to be worse hit. The significant recovery in Indian GDP in 2027 is related to the role of remittances, which are assumed to fall sharply in 2026 but then recover as Gulf economies normalize in 2027.
In the longer term, this crisis will encourage spending on energy independence and defense
Even if disruption to energy exports from the Gulf proves to be brief, there will be long-lasting consequences from the conflict. Energy-importing countries around the world are likely to accelerate the deployment of renewables and electrification to reduce their reliance on fossil fuels. Energy-exporting countries in the Gulf are likely to invest in infrastructure to reduce their reliance on Hormuz seaborne trade, although this will not be quick or cheap. Faced with more aggressive and less predictable US foreign policy, countries are likely to spend more on defense.
These longer-term trends have the potential to be positive for commodity demand. However, in the short-term, the risks are very much on the downside. A global energy crisis will push up costs across almost all value chains and destroy final demand for goods, which can only be bad for material demand.